- 1Tsukuba AI Application Support Center Co., Tokyo, Japan
- 2Business Informatics on Social Science, University of Tsukuba, Tokyo, Japan
- 3Graduate School of Business Sciences, University of Tsukuba, Tokyo, Japan
We present a brute-force approach to analyze the concept drift behind time sequence data. This approach, named SELECT, searches for the optimal length of training data to minimize error metrics. In other words, SELECT searches for the start point of a new concept from the input sequence. Unlike many related methods, SELECT does not require a pre-specified error threshold to detect drift. In addition, the visual analysis obtained from SELECT enables us to understand how significant a drift has occurred. We test SELECT on two real-world datasets, stock price and COVID-19 infection data. The experimental results show that SELECT can improve the model performance of both datasets. In addition, the visual analysis shows the points of significant drifts, e.g., Lehman’s collapse in stock price data and the spread of variants in COVID-19 data. These results show the effectiveness of the brute-force approach in analyzing concept drift.
1 Introduction
The concept drift behind time sequence data has been studied on classification and regression problems. Most previous studies use a pre-specified error threshold. Such studies assume concept drift when the error exceeds the threshold.
In this paper, we present a brute-force approach to analyze concept drift. This approach, named SELECT, searches for the optimal length of the training data that minimizes error metrics. In other words, SELECT searches for the start point of a new concept from the input sequence. Unlike many related methods, SELECT does not require a pre-specified error threshold to detect drift. In addition, the visual analysis obtained from SELECT enables us to understand how significant a drift has occurred.
We test SELECT on two real-world data sets, stock price and COVID-19 infection data. The experimental results show that SELECT can improve the model performance of both data sets. In addition, visual analysis shows the points of significant drift, e.g., Lehman’s collapse in stock price data and the spread of new variants in COVID-19 data. This paper also compares SELECT with other methods used in previous studies using synthetic data. The experimental results show the effectiveness of the brute-force approach in analyzing concept drift.
The remainder of this paper is organized as follows: Section 2 presents a survey of concept drift studies to clarify the importance of this research. Section 3 describes the proposed method. Sections 4, 5 report the experimental results, and Section 6 summarizes our findings.
2 Related works
Concept drift has been studied in classification [1, 2] and regression problems [3, 4]. Among them [5], surveyed the concept drift studies and referred to drift detection methods (DDMs) [1], such as early drift detection methods (EDDMs) [2] and Hoeffding drift detection methods (HDDMs) [6] as representative detection methods. Most of these methods require a pre-specified error threshold. When the error exceeds the threshold, a concept drift is assumed to have occurred.
DDM, for example, tries to detect a concept drift in the model,
A common drawback of these methods is that they require a pre-tuned threshold. Since we could not find any appropriate threshold, we used the SELECT brute-force approach. SELECT generates prediction models using all possible lengths of the training data. Then, it selects a training data length that produces the best accuracy. This brute-force approach makes the requirement of the pre-tuned threshold unnecessary.
Early results of this study have been reported at the COMPSAC 2022 workshop as [4] and KES2022 as [7]. This paper presents an extension of the study by comparing SELECT with previous studies based on the review results of the COMPSAC 2022 workshop and KES2022.
3 Brute force tuning of training length
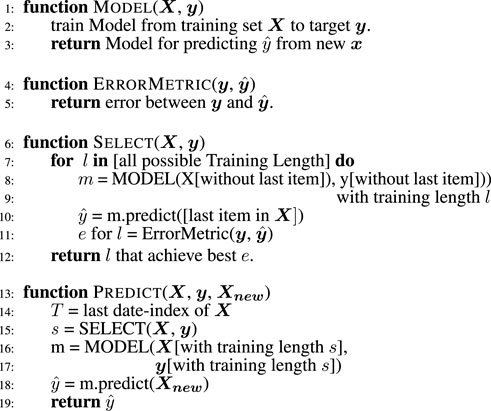
SELECT is a brute-force tuning method that finds the best training length for time-sequential data. Figure 1 shows the algorithm to predict the next target value,
Unlike most previous methods (DDM, HDDM, and EDDM), this brute-force method does not require pre-tuned thresholds. Instead of using pre-tuned thresholds, SELECT uses the results of machine learning models. By selecting the best training length, it can find the concept drift point as the starting point of the training data.
To the best of our knowledge, the properties of this simple method have not been well investigated, possibly because it has a higher computational cost than existing methods. However, the current high-speed computers (especially with the improvement in parallel processing performance) can efficiently process this simple method, which may lead to interesting results, as shown in the following sections.
Heatmaps are important by-products of SELECT. The heatmaps (Figures 2, 4, 8, 10) obtained from SELECT enables us to understand how concept drift occurred. In the heatmap, the x-axis denotes the time-point, t, and the y-axis denotes the training length at the corresponding points. The color indicates the value of the ErrorMetric, and areas with similar colors indicate concept periods. See later sections for details.
4 Experimental results on real-world data
4.1 Stock price prediction
4.1.1 Attention of stock price data
Recent studies have challenged the efficient market hypothesis (EMH [8]) that entails the unpredictability of stock prices. A significant breakthrough has been achieved using the deep learning framework. Many supervised deep neural networks have been proposed to predict stock prices using various attributes, such as prices, economic news, financial events, and the relationship between stocks. Recent studies used the attention mechanism to extract relevant time-series data and improve prediction accuracy. Although the advantage of the attention mechanism has been demonstrated based on the various experimental results [9–13], a common drawback of these studies lies in the interpretation of the learned models.
This section attempts to solve this problem by presenting a method that: 1) exhibits the critical period of time-series data (i.e., concept drifts in the stock price data) and 2) interprets the learned model during the corresponding period using the heatmaps generated by SELECT. For this purpose, we applied SELECT to S&P500 and NKY225 price data. We downloaded data of both the indexes and prices of individual stocks from both indexes using the Refinitiv Data stream service (https://solutions.refinitiv.com/datastream-macroeconomic-analysis/). Because we could not access data of individual indexes in the S&P500 for the period before March 2000, this section shows the results based on the data from April 2000 to March 2020.
Note that the S&P500 is the world’s largest stock market index, and NKY225 is the index of the world’s third largest stock market. For 20 years since 2000, the S&P500 provided stable profits except during the financial crisis of 2007–2008 and COVID-19 recession (2020 onward). Therefore, the analysis of S&P500 is an analysis of the most extensive index and has academic significance from the perspective of the modeling index, including the recession. In addition, although NKY225 is the index of Japanese companies, it includes a period of economic stagnation called “Japan’s lost 20 years.” The analysis of the difference between the profitable S&P500 and unprofitable NKY225 is appropriate for economic analysis.
Here, we defined the MODEL to predict the price change rate from the previous month as follows:
where
Here, kNN is the k-nearest neighbors algorithm [14]. yt is the momentum of the index price in the month t from the previous month. mbt is the Up-Down ratio calculated from the number of stock price increases and decreases. Varying α omits the marginal price variations of each stock that constitute the index and adjusts mbt. To verify the utility of parameter α, we use .0 and 1.0 as the values of α in the experiments. When α is set to .0, mbt is calculated from all stock in the index. When α is set to 1.0, mbt is calculated from only stocks whose price had changed greater than the standard deviation. Although α should be adjusted to minimize the error, this study reports results for α = {0.0, 1.0} because α = 1.0 improved the error.
We set the inverse of correlation between yt and
4.1.2 Results
4.1.2.1 S&P500
As previous works used various stock prices to demonstrate their effectiveness, a comprehensive comparison is complex. Therefore, we compare the investment results of the proposed method with that of the index investment, which has been used as a standard method of investment.
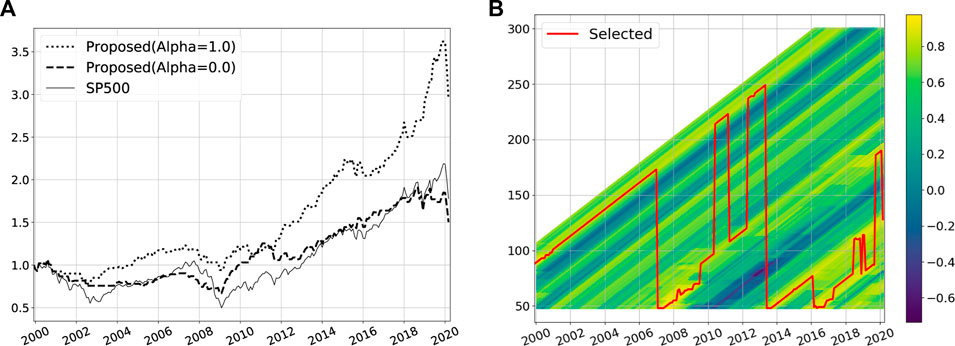
The Figure 2A shows the investment results of the S&P500 using the proposed method and the index investment. The Sharpe ratio of the proposed method with α = 1.0 is 5.07, which is higher than that of the index investment (1.33). Here, we use the following equations to calculate the Sharpe ratio from 2000 to 2020:
where
As shown in the Figure 2A, the proposed method can outperform the index investment. In addition, it can extract the time when the market structure varies. The Figure 2B is a heatmap whose x-axis, y-axis, and color correspond to date, t, length, l, and the correlation, respectively. The red line indicates the length, s selected by the algorithm as shown in Figure 1.
The figure shows the training period length that maximizes the correlation and increases in a step-by-step manner from 2000 to 2006. However, from the end of 2006, SELECT discards outdated data and only uses recent data. That is, the red line in Figure 2 shows the crucial periods for prediction. Excessively outdated data are not essential for prediction.
During the survey, several studies [10–13] have been observed to use ALSTM. Figure 2 explains why ALSTM outperforms LSTM. Asthe data includes important periods, i.e., concept drifts, as shown in Figure 2, ALSTM could outperform LSTM with the aid of an attention mechanism that can handle such concept drifts.
The heatmaps shown in Figure 3 enable further interpretation of the learned model. Figure 3 shows the model and data density of the S&P500. In the model part of the Figure 3, the x-axis, y-axis, and color correspond to the price variation in the current month yt and mbt, and prediction of price variation in the subsequent month yt+1. The blue heatmaps on the left side show only the points where the of the price variation increases, Moreover, the red heatmaps on the right s show the points where the price variation decreases.
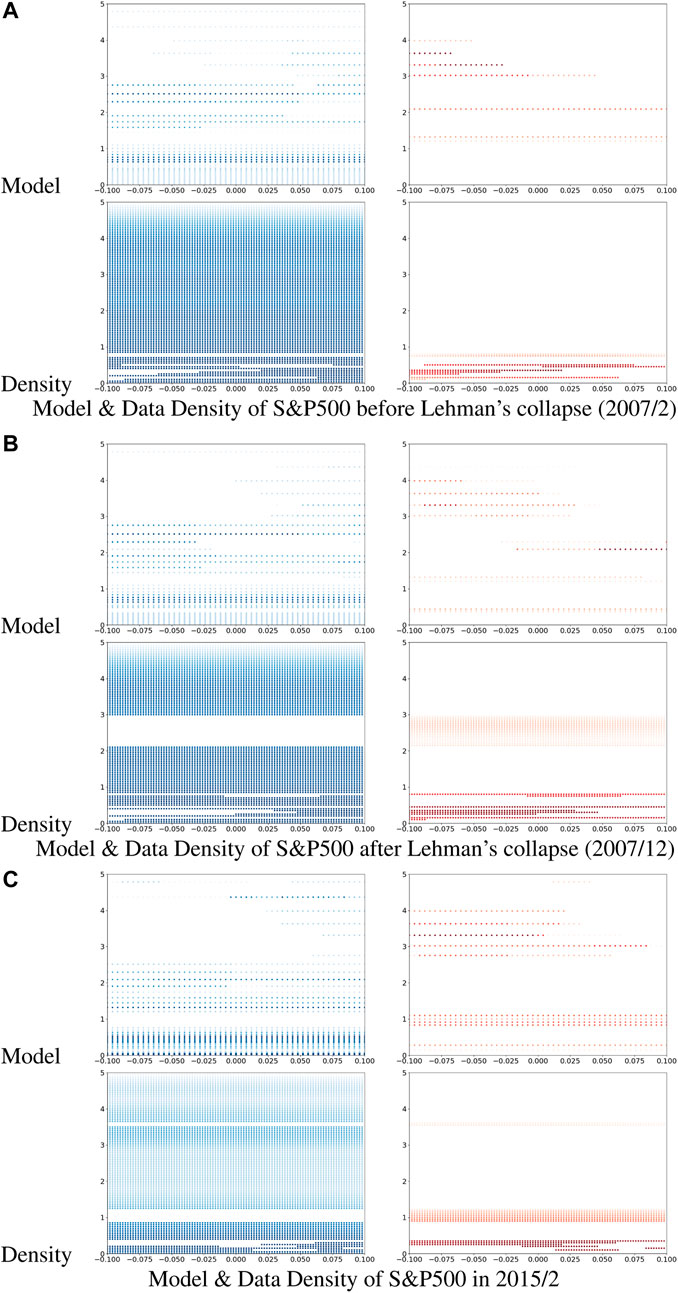
FIGURE 3. Model & Data Density of S&P500. (A) Model & Data Density of S&P500 before lehman’s collapse (2007/2). (B) Model & Data Density of S&P500 after lehman’s collapse (2007/12). (C) Model & Data Density of S&P500 in 2015/2.
The following are some of the noteworthy characteristics shown in these heatmaps:
• Niederhoffer et al. [15] analyzed the trend of future price fluctuations and reported that the direction of price fluctuations would reverse. However, such a trend is not evident in these heatmaps. Instead, each heatmap shows a marginally contradicting trend. The direction of price fluctuation is continuous, from, the red points on the left To the blue points on the right side of the heatmaps.
• Moreover, mbt appears to yield better predictions. That is, the price would increase if mbt < 1 and decrease if mbt > 1. Specifically, the index price would vary in the same direction as those of the individual stock prices that constitute the index.
• The model for predicting stock variation did not evolve during the financial crisis of 2007–2008. That is, the model in February 2007 (before the crisis; Figure 3A) and that in December 2007 (during the crisis; Figure 3B) are similar. However, the model in February 2015 (Figure 3C) is significantly different.
Although the models did not show a significant difference during the 2007–2008 crisis, the kernel density of the training data shows a difference in the economic status during the crisis (see Figures 3A, B). In each heatmap, the x-axis, y-axis, and color correspond to the price variation in the current month yt, mbt, and the kernel density of the training data, respectively. Here, we calculate the kernel density using a Gaussian kernel whose bandwidth is set at 1.0.
A significant difference is noticed between Figures 3A, B for 2 < mbt < 3. Although the models for February 2007 and December 2007 show minimal difference, the kernel densities of the corresponding periods are different. The data distribution indicates a different economic status during the financial crisis.
4.1.2.2 NKY225
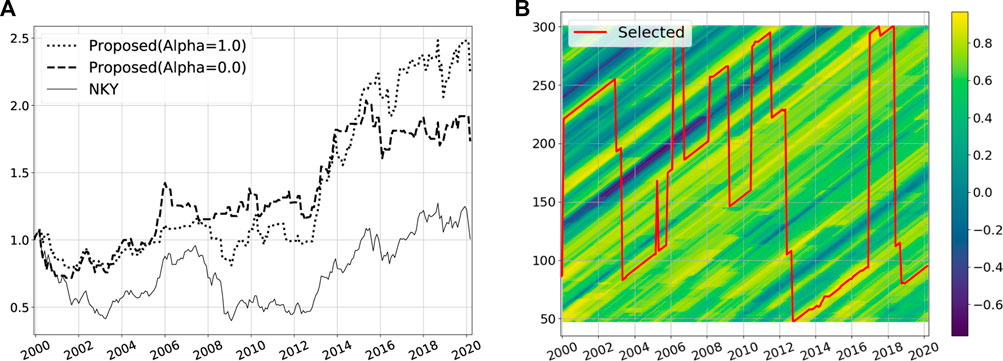
NKY225 is an unprofitable index compared with S&P500. The Sharpe ratio of index investment for S&P500 from 2000 to 2020 is 1.33, whereas that for NKY225 is .03. However, the proposed method with α = 1.0 can achieve a Sharpe ratio of 2.23. This difference in the Sharpe ratio is evident in the investment results shown in Figure 4.
Figures 4, 5 for NKY225 correspond to Figures 2, 3 for the S&P500. As shown in the figures, the model and data density related to NKY225 are biased toward the lower side (red area on the right) compared with the corresponding figures of the S&P500. This bias appears to explain the unprofitability of NKY225.
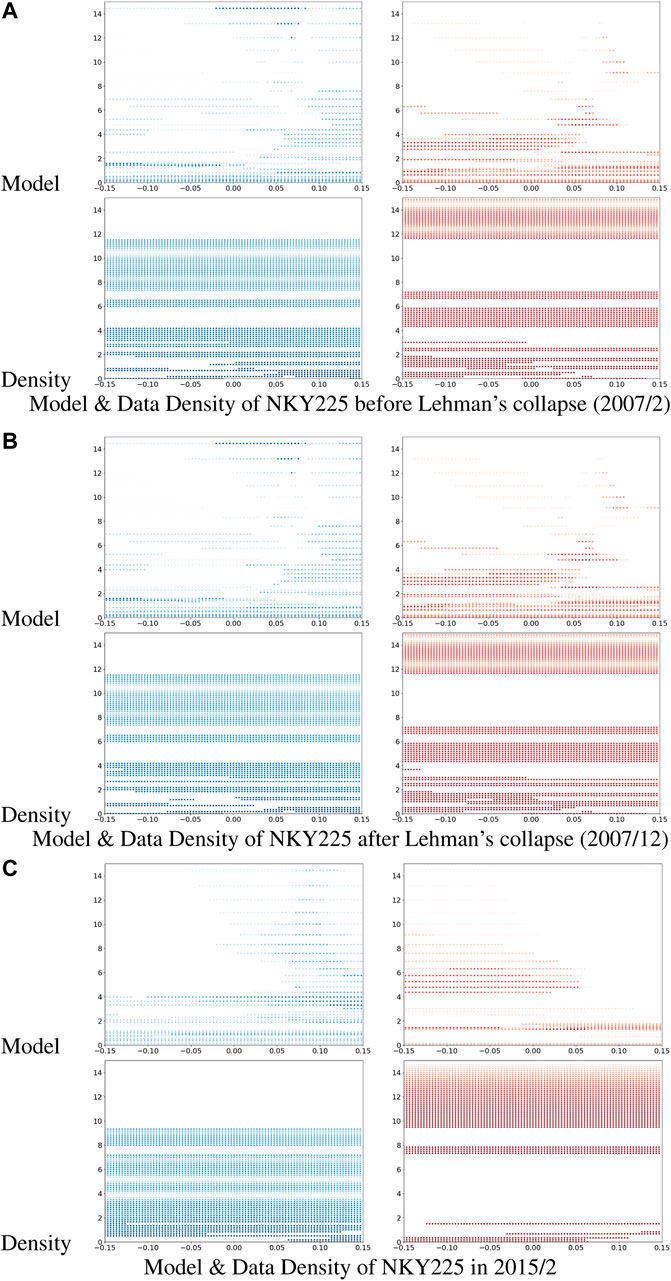
FIGURE 5. Model & Data Density of NKY225. (A) Model & Data Density of NKY225 before lehman’s collapse (2007/2). (B) (A) Model & Data Density of NKY225 after lehman’s collapse (2007/12). (C) Model & Data Density of NKY225 2015/2.
4.2 Spread of COVID-19
4.2.1 Vaccine and variant of COVID-19
This section analyzes concept drifts in the COVID-19 infection data of Japan. Figure 6 shows the weekly number of cases caused by different COVID-19 variants. The figure shows the emergence and spread of new COVID-19 variants every 4–5 months.

FIGURE 6. COVID-19 variants in Japan [16].
The emergence of new variants of COVID-19 and widespread use of vaccines have a significant impact on this data and make the prediction of COVID-19 infections challenging.
Standard regression methods, such as ridge regression and support vector regression cannot make accurate predictions.
The proposed model tries to offer accurate predictions by dealing with concept drifts in the data trend. Note that most drift detection methods require pre-tuned parameters to find drift points. Determining appropriate parameters for detecting concept drift points is challenging. Thus, we try to handle concept drifts in COVID-19 data trend by brute-force tuning of the training data; that is, we use SELECT to analyze the data.
A certain percentage of people with COVID-19 need hospitalization several days after the infection. Moreover, a certain percentage of those exhibit severe symptoms within few days of hospitalization. Furthermore, a certain percentage of critically ill patients die within the next few days. To model these situations, we set up the following ridge regression models:
The daily number of infections changed from zero to hundreds of thousands. Such a major change causes scaling problem for error metrics.
To overcome this problem, we used the mean absolute scaled error (MASE [17]) as the error metric, i.e., the ErrorMetric in Figure 1, for the COVID-19 data.
4.2.2 Results
We compared the prediction accuracy of SELECT with that of the model trained on the entire dataset. To be precise, we analyzed concept drifts in the daily infection data of COVID-19 in Japan from 05/11/2020 to 03/02/2022. We downloaded the dataset from [18].
Figure 7 shows the comparison results of the n2i-model (predict hospitalization because of new infections), r2s-model (predict severe cases from the hospitalized cases), and s2d-model (predict death cases from the reported severe cases). All figures indicate that SELECT improves prediction accuracy.
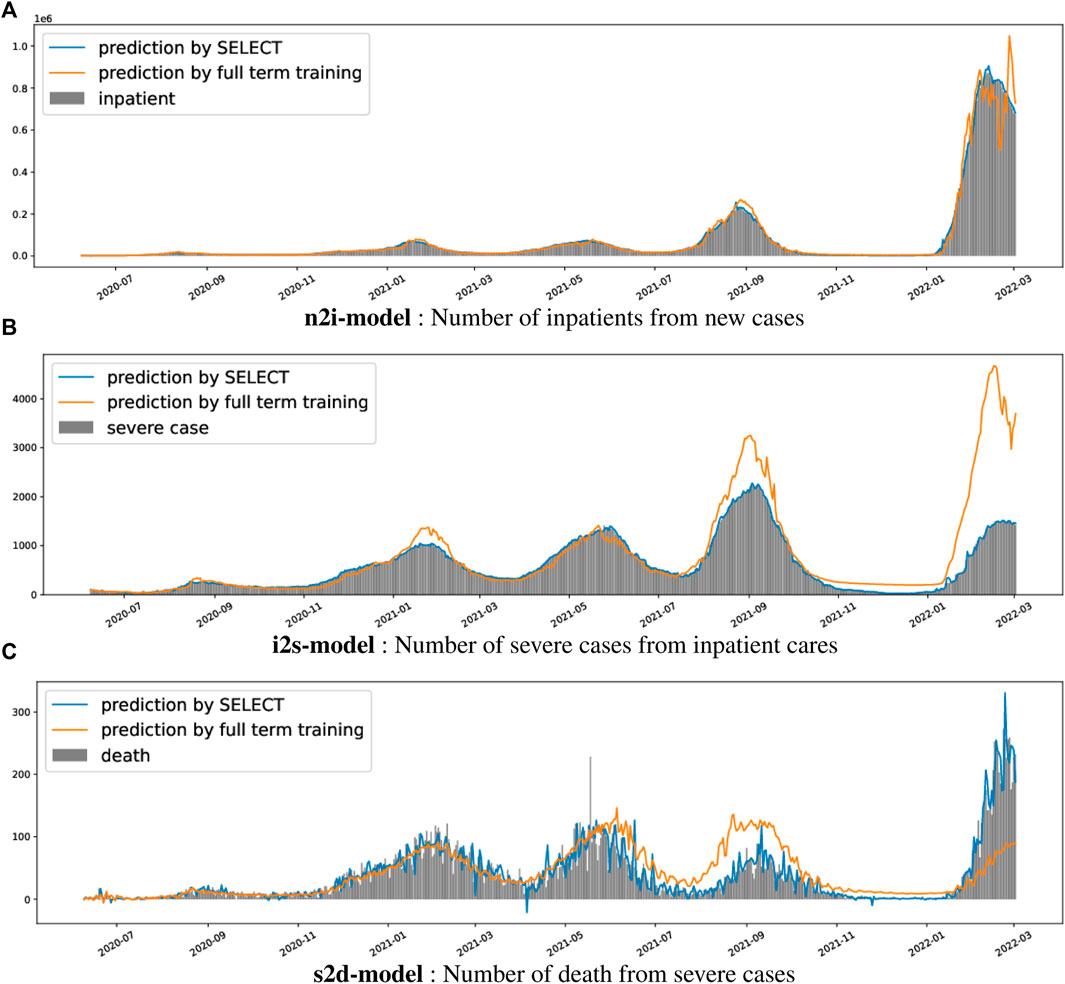
FIGURE 7. Predicted models of COVID-19. (A) n2i-model: Number of inpatients from new cases. (B) i2s-model: Number of severe cases from inpatient cares. (C) s2d-model: Number of death from severe cases.
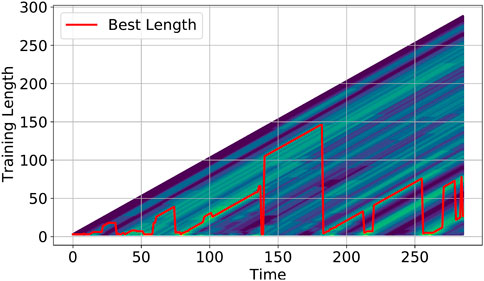
Figure 8 shows the heatmaps and lengths chosen by SELECT for each model. The colors indicate the log2 scale MASE. The x- and y-axes represent the date, t and corresponding training data length, respectively. The red line on the chart indicates the best training data length s chosen by SELECT.
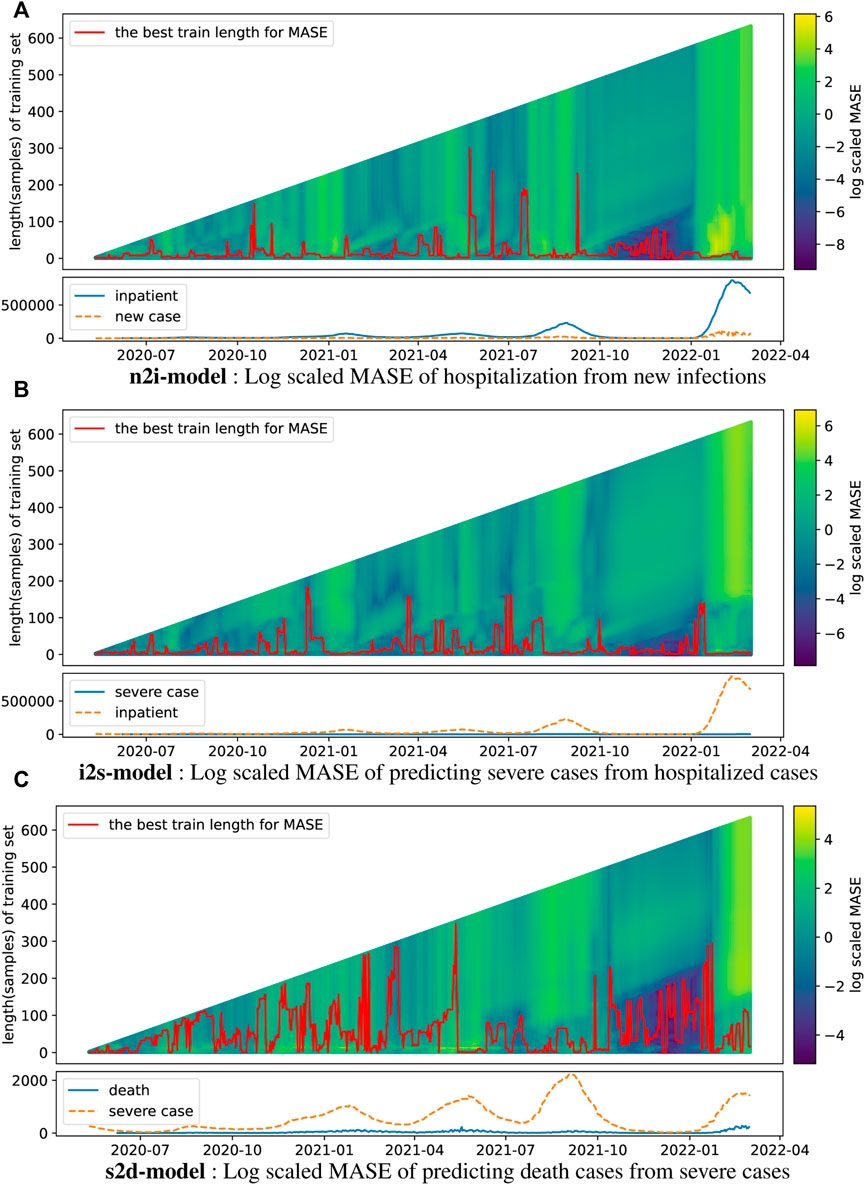
FIGURE 8. MASEs of COVID-19. (A) n2i-model: Log scaled MASE of hospitalization from new infections. (B) i2s-model: Log scaled MASE of predicting severe cases from hospitalized cases. (C) s2d-model: Log scaled MASE of predicting death cases from severe cases.
A notable characteristic of these heatmaps is the presence of periods of large (e.g., around August and December 2021) and small errors (around January 2022 and September 2021). We interpret these periods as follows:
• Around August or September 2021: In Japan, vaccines administration was rapid during July and August 2021. This significantly affects the model and increases the error.
• From December 2021 to 2022: The emergence of Omicron variant around December 2021, with higher transmissibility than earlier variants of the virus, made prediction error around December significant.
In both cases, prior data did not contribute to the accuracy of the n2i and i2s models, but SELECT could extract such periods based on its by-product, the heatmaps.
5 Comparison of SELECT with previous methods
5.1 Classification of synthetic data
To show the advantage of SELECT (i.e., the brute force tuning of training length) over previous methods, this section reports the experimental results of the classification problem on synthetic data.
We choose DDM [1], HDDM [6], and EDDM [2] as the representative methods that use the pre-specified threshold to detect concept drifts.
For the comparison of synthetic data, we generated 300 artificial data using the following procedure:
• The explanatory variable is a two-dimensional vector (x1, x2) composed of two scalar values x1 and x2. Class labels y (True and False) is attached to each 2D vector (x1, x2).
• For the two scalar values, x1 and x2, random numbers with a mean of approximately 0 and standard deviation of approximately 1 were generated using the python’s random function in Python language. We created 300 values for each x.
• The first 100 (period 1) class labels are marked as “True/False” if the condition “x1 > 0” satisfies (referred as model 1). The last 100 (period 3) class labels are marked as “True/False” if the condition “x2 > 0” satisfies (referred as model 2). The middle 100 (period 2) class labels are marked by gradually changing the ratio from the label generated by model 1 to the label generated by model 2.
To analyze the synthetic data, we used cart (decision tree; the implementation is scikit-learn [19]) as the leaner (i.e., the MODEL in Figure 1), and the simple error rate as the ErrorMetric. We create a model using the data of the best training length selected by SELECT.
With DDM, HDDM, and EDDM, classification is performed using the same learner (i.e., cart), using all the data to the point where DDMs detect drifts. For the implementation of DDMs (i.e., DDM, HDDM, and EDD), we used scikit-multiflow [20].
5.2 Results
Table 1 outlines the experimental results. Despite the change from simple model 1 to 2, DDM, HDDM, and EDDM could not detect the correct drift position. DDM found one intermediate position; HDDM found one position before the change from model 1 to model 2; and EDDM reported two positions in model 2.
These results were not better than initially expected. It is presumed that this is because the change in period 2 is gradual, and the change in classification error is also gradual (See Figure 9 for the transition of the classification error).
On the other hand, SELECT selects the training lengths corresponding to models 1 and 2 (Figure 10). Although the selected training length during the transition from model 1 to model 2 (i.e., period 2) is unstable, the results are better than those of the existing methods.
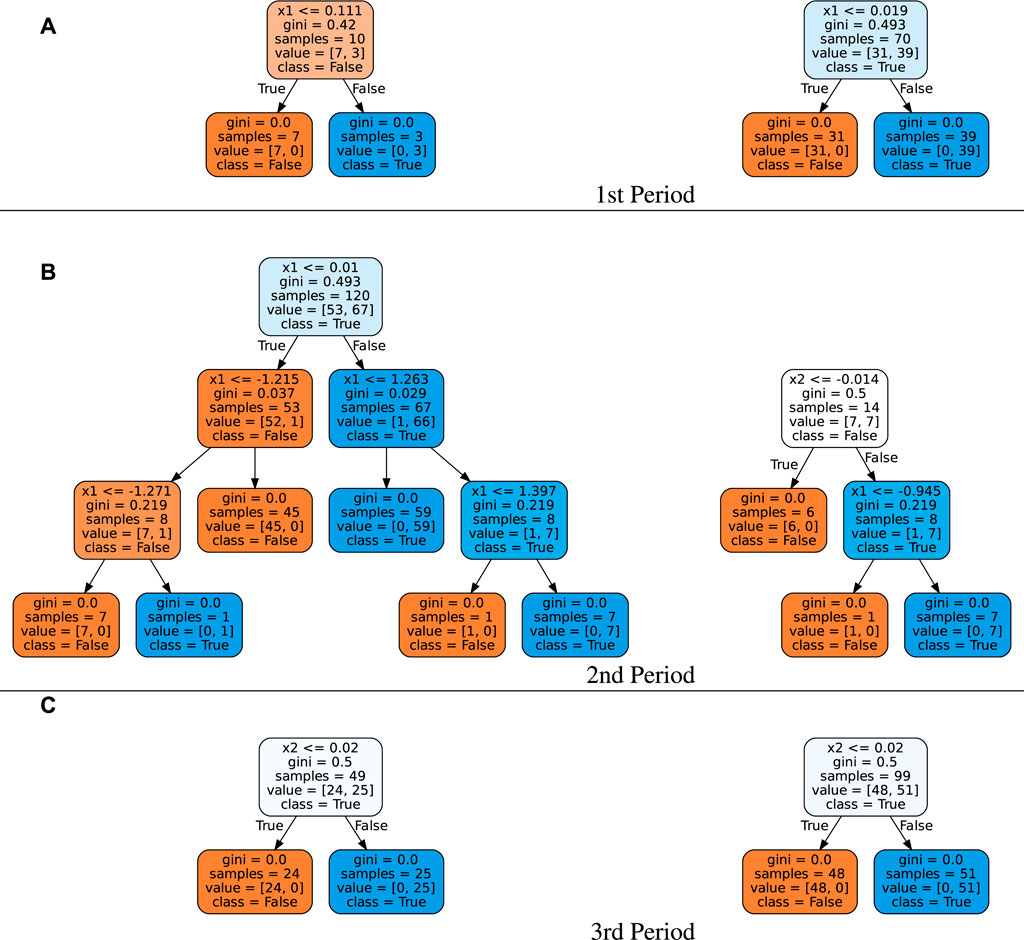
In addition, proper classification trees are learned in each period (See Figure 11 that shows two representative learned trees). In period 1, the learned rule classifies data using x1 (Figure 11 (a)), and the learned rule in period 3 classifies data using x2 (Figure 11 (c)).
On the other hand, interpreting the classification tree for period 2 is complex. The classification trees for period 2 have multiple condition nodes with two attributes, x1 and x2.
Furthermore, the improvement in the classification accuracy over the entire period for SELECT is better than that of the other methods (Table 1).
From the viewpoints of classification accuracy, extraction period, and extraction model, SELECT presents itself as a superior drift detection method than the existing methods (i.e., DDM, EDDM, and HDDM). In other words, these results show that the method using brute force tuning of training length performs better than the methods relying on a pre-defined threshold.
6 Conclusion
This paper proposes a brute-force approach named SELECT to analyze the concept drift of time-sequence data. SELECT employs brute force tuning of the training length to find concept drift. Not only can it improve the accuracy of prediction and classification analysis, but also it enables the analysis of time sequence data through heatmaps. We conducted experiments with two real-world datasets that revealed:
• the profit earned by SELECT outperforms the index investment, and the analysis using heatmaps created by SELECT reveals why ALSTM can outperform LSTM for stock price analysis;
• SELECT improves the prediction accuracy for the spread of COVID-19 and can extract significant drift points, such as widespread use of COVID-19 vaccines and the emergence of new variants.
We also show an example where SELECT outperforms the representative methods (DDM, HDDM, and EDDM) that use the pre-specified threshold to detect concept drifts.
Since SELECT requires a lot of computational resources to train the model at all training lengths, SELECT has a performance problem. However, this performance problem is left as a future research issue.
Data availability statement
The original contributions presented in the study are included in the article/supplementary material, further inquiries can be directed to the corresponding author.
Author contributions
KY contributed to conception and design of the study. TU and KY performed the statistical analysis. KY wrote the first draft of the manuscript. TU and KY wrote sections of the manuscript. All authors contributed to manuscript revision, read, and approved the submitted version.
Funding
This study was partly supported by JSPS KAKENHI (Grant Number 19H04165).
Conflict of interest
Author TU was employed by company Tsukuba AI Application Support Center Co.
The remaining author declares that the research was conducted in the absence of any commercial or financial relationships that could be construed as a potential conflict of interest.
The handling editor SK declared a shared affiliation with the authors at the time of the review.
Publisher’s note
All claims expressed in this article are solely those of the authors and do not necessarily represent those of their affiliated organizations, or those of the publisher, the editors and the reviewers. Any product that may be evaluated in this article, or claim that may be made by its manufacturer, is not guaranteed or endorsed by the publisher.
References
1. Gama J, Medas P, Castillo G, Rodrigues P. Learning with drift detection. In: Brazilian symposium on artificial intelligence. Springer (2004). p. 286.
2. Baena-Garcıa M, del Campo-Ávila J, Fidalgo R, Bifet A, Gavalda R, Morales-Bueno R. Early drift detection method. Fourth Int Workshop knowledge Discov Data streams (2006) 6:77.
3. Zenisek J, Holzinger F, Affenzeller M. Machine learning based concept drift detection for predictive maintenance. Comput Ind Eng (2019) 137:106031. doi:10.1016/j.cie.2019.106031
4. Yoshida K. Interpreting attention of stock price prediction. In: 2nd IEEE international workshop on dynamic data science & big data analytics in finance (2022). DDS-BDAF 2022).
5. Lu J, Liu A, Dong F, Gu F, Gama J, Zhang G. Learning under concept drift: A review. IEEE Trans Knowledge Data Eng (2018) 31:1–2363. doi:10.1109/tkde.2018.2876857
6. Frias-Blanco I, del Campo-Ávila J, Ramos-Jimenez G, Morales-Bueno R, Ortiz-Diaz A, Caballero-Mota Y. Online and non-parametric drift detection methods based on hoeffding’s bounds. IEEE Trans Knowledge Data Eng (2014) 27:810–23. doi:10.1109/tkde.2014.2345382
7. Uchida T, Yoshida K. Concept drift in Japanese Covid-19 infection data.” in 26th International Conference on Knowledge-Based and Intelligent Information & Engineering Systems; 2022 September 7–9, 2022; Verona, Italy & Virtual (Verona, Italy: Elsevier) (2022).
8. Basu S. Investment performance of common stocks in relation to their price-earnings ratios: A test of the efficient market hypothesis. J Finance (1977) 32:663–82. doi:10.1111/j.1540-6261.1977.tb01979.x
9. Qin Y, Song D, Chen H, Cheng W, Jiang G, Cottrell GW. A dual-stage attention-based recurrent neural network for time series prediction. Melbourne, Australia: IJCAI (2017).
10. Feng F, Chen H, He X, Ding J, Sun M, Chua T-S. Enhancing stock movement prediction with adversarial training. Macao, China: IJCAI (2019). p. 5843.
11. Yoo J, Soun Y, Park Y-c., Kang U (2021). Accurate multivariate stock movement prediction via data-axis transformer with multi-level contexts. In Proceedings of the 27th ACM SIGKDD Conference on Knowledge Discovery & Data Mining. 2037.
12. Lin H, Zhou D, Liu W, Bian J. Learning multiple stock trading patterns with temporal routing adaptor and optimal transport. Proc 27th ACM SIGKDD Conf Knowledge Discov Data Mining (2021) 1017–26.
13. Ding Q, Wu S, Sun H, Guo J, Guo J. Hierarchical multi-scale Gaussian transformer for stock movement prediction. IJCAI (2020) 4640. doi:10.24963/ijcai.2020/640
14. Altman NS. An introduction to kernel and nearest-neighbor nonparametric regression. The Am Statistician (1992) 46:175–85. doi:10.2307/2685209
15. Niederhoffer V, Osborne MFM. Market making and reversal on the stock exchange. J Am Stat Assoc (1966) 61:897–916. doi:10.1080/01621459.1966.10482183
16.Japan Ministry of Health, Labour and Welfare. Response to new coronavirus infections (2021). (in japanese) https://www.mhlw.go.jp/content/10900000/000875170.pdf (Accessed Mar 13, 2022).
17. Hyndman RJ, Koehler AB. Another look at measures of forecast accuracy. Int J Forecast (2006) 22:679–88. doi:10.1016/j.ijforecast.2006.03.001
18.Japan Ministry of Health, Labour and Welfare (2022). Visualizing the data: Information on COVID-19 infections. Available at: https://covid19.mhlw.go.jp/en/(accessed 13-Mar-2022).
19. Pedregosa F, Varoquaux G, Gramfort A, Michel V, Thirion B, Grisel O, et al. Scikit-learn: Machine learning in python. J machine Learn Res (2011) 12:2825.
Keywords: concept drift, drift detection, window strategy, stock price prediction, COVID-19
Citation: Uchida T and Yoshida K (2023) A brute force tuning of training length for concept drift. Front. Phys. 10:1016564. doi: 10.3389/fphy.2022.1016564
Received: 11 August 2022; Accepted: 23 December 2022;
Published: 16 January 2023.
Edited by:
Setsuya Kurahashi, University of Tsukuba, JapanReviewed by:
Hiroshi Uehara, Rissho University, JapanSergey Lupin, National Research University of Electronic Technology, Russia
Copyright © 2023 Uchida and Yoshida. This is an open-access article distributed under the terms of the Creative Commons Attribution License (CC BY). The use, distribution or reproduction in other forums is permitted, provided the original author(s) and the copyright owner(s) are credited and that the original publication in this journal is cited, in accordance with accepted academic practice. No use, distribution or reproduction is permitted which does not comply with these terms.
*Correspondence: Takumi Uchida, dGFrdW1pLnVjaGlkYS5yZXNlYXJjaEBnbWFpbC5jb20=
 Takumi Uchida
 Kenichi Yoshida3