- 1Faculty of Information Science and Technology, Osaka Institute of Technology, Osaka, Japan
- 2Faculty of Culture and Information Science, Doshisha University, Kyoto, Japan
The Jomon period of ancient Japan, characterized by hunting and gathering, lasted from 16,000 to 2,400 years cal BP. In this ∼13,000-year period, the geographical range of trade is known to have been extensive but may not have always been constant. We conducted obsidian social network analyses on a large dataset to explore the dynamics of trade networks and their tipping points during the Jomon period. This study clustered sites by geographical location and summarized obsidian artifacts in aggregate values by region to increase regional representativeness. This improved the readability and interpretability of the analysis results and decreased the distortion of results owing to a small sample of sites. The results showed that, for sites adjacent to one another, it is reasonable to group the total values by region and assess the regional representativeness of the findings. Framing the provenance and consumption areas as a bipartite graph and using network analyses among consumption areas revealed that the obsidian trade network expanded throughout the Kanto region in the middle Jomon period (5,500–4,500 years cal BP) but regionalized in the late Jomon period (4,500–3,200 years cal BP). These periods were extracted as tipping points in the Jomon trade network. The timing of these tipping points possibly occurred during a period of major climate change. Therefore, these tipping points of obsidian trade networks may have resulted from population decline and migration caused by shifting coastlines and living infrastructure owing to climate change.
1 Introduction
Shell and jade ornaments, as well as other objects, dating back to the Jomon period of ancient Japan (16,000–2,400 cal BP, a period of hunting and gathering), have been excavated in areas far from where they were produced. This suggests the existence of trade over an extensive geographical area [1]. However, the Jomon period was extremely long, lasting approximately 13,000 years, and cultural changes within this period have been recognized. We suspect that the Jomon trade range cyclically expanded and shrank over time. To explore the dynamics of trade networks and their tipping points during the Jomon period, we conducted social network analyses of obsidian artifacts. Obsidian is a type of volcanic glass that has been used to make sharp stone tools and has other uses, including the processing of food and wood [2]. In archaeology, similarities and differences in artifacts are frequently used as indicators of the frequency and intensity of contact and relationships between groups [3]. As obsidian provenance is restricted to a few areas, determining its origin is crucial for understanding trade networks and resource procurement [3].
Obsidian provenance analysis of the Kanto region in the eastern part of mainland Japan is considered one of the best in the world in terms of quality and quantity [4]. Suzuki [5, 6] examined the trends in obsidian provenance and timing. Warashina and Higashimura [7] collected and organized the results of obsidian and sanukite provenances. The number of obsidian provenance analyses has also increased since the late 1980s owing to the widespread use of X-ray fluorescence analyzers, with certain studies focusing on archaeological issues in the broad region of Kanto [8–11]. Sugihara and Kobayashi [12] and Tsutsumi [13] also chronologically examined resource development and supply in certain provenances from the Paleolithic to the middle Yayoi period (–2,000 years cal BP).
The Japanese Archaeological Association compiled a significant collection of previously published obsidian provenance analyses in the Kanto region in 2011 [14]. Tsumura and Tateishi [4] used these compiled data and statistical analysis methods to examine patterns of provenance and consumption areas in the Kanto region during the Jomon period. Their findings showed that the obsidian trade network may have changed over time. Their study used quantitative methods to analyze the relationship between obsidian provenance and consumption areas. However, there are many unknowns because changes in the dynamics of trade networks among the consumption areas have not yet been examined. Indeed, such large-scale data are difficult to visualize and interpret using traditional methods; only very recently social network analysis has become an established tool in archaeology.
Studies focusing on Mesoamerica have used social network analysis in relation to trade networks among obsidian consumption areas [15, 16]. For example, Golitko et al. [15] assumed that the end of the classic period witnessed the collapse of the inland land-based trade network and the development of the coastal maritime trade network. Additionally, Golitko and Feinman [16] demonstrated a propensity for the hierarchy and size of networks to decline over time, which suggests that Mesoamerican economies may not have been centralized. In addition to the exchange and trade outlined earlier, other obsidian social network studies have analyzed processes such as procurement methods [17], interaction spheres, and social affiliations [18, 19].
These studies used social network analysis of obsidian to represent obsidian provenances and archaeological sites from which obsidian was excavated as “nodes.” These “nodes” were given attribute information such as the geographic location and estimated age of the site, as well as the quantity and percentage of obsidian in each provenance. Links established based on the similarity of pairs of nodes (similarity in obsidian proportions) reflected the relationship between nodes. Social network analysis focuses on nodes and their relationships and views the system as a combination of both [20].
In the present study, we employed social network analysis to quantitatively assess whether and when trade expanded and contracted during the Jomon period. We then compared networks between production and consumption areas and among the consumption areas for each of the five subdivisions of the Jomon period and identified the tipping points of the trade networks during this time. The social network analysis conducted in this study used a larger dataset compared with that used in the analysis conducted in studies on other regions; it contains provenance data for approximately 21,000 obsidian pieces excavated from more than 270 archaeological sites. A regional clustering technique was employed to enhance the readability and interpretability of this large dataset and reduce distortion effects due to small sample sizes.
2 Materials and methods
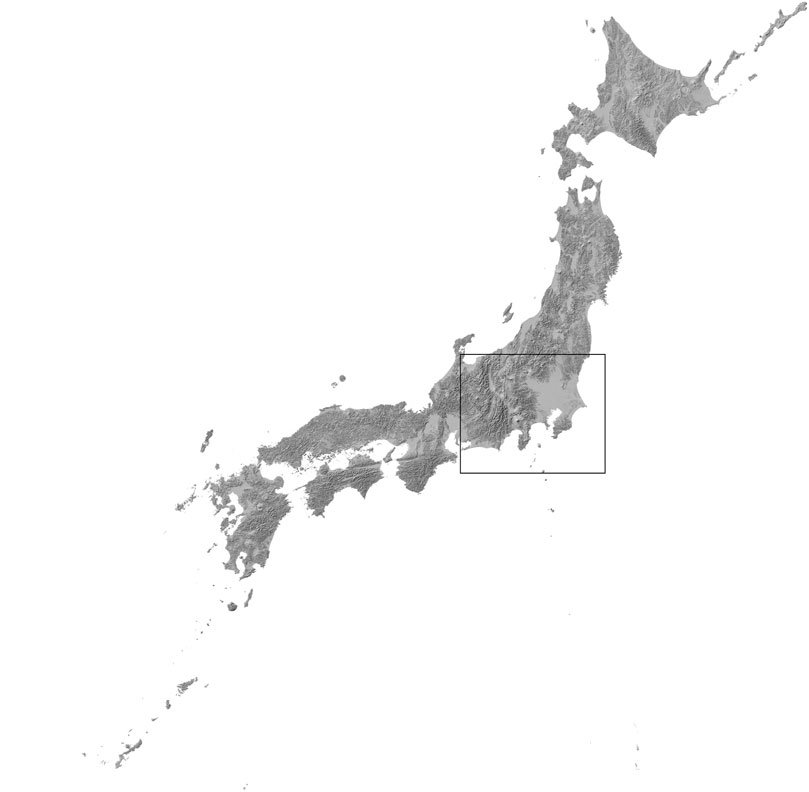
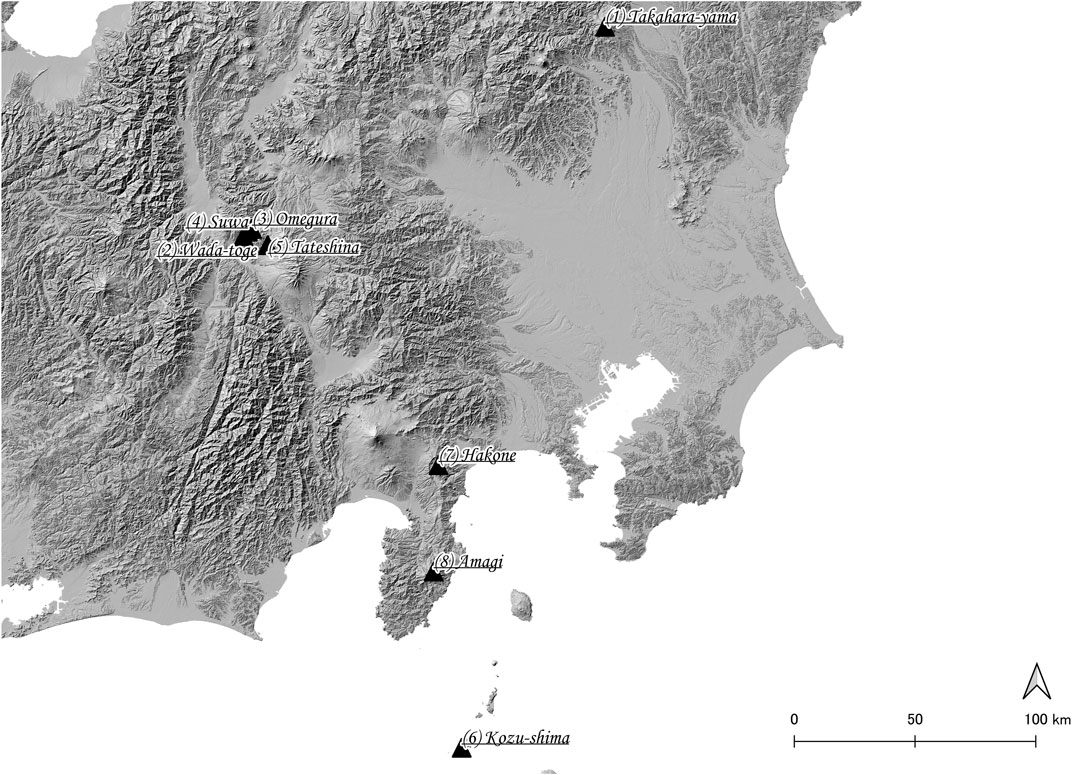
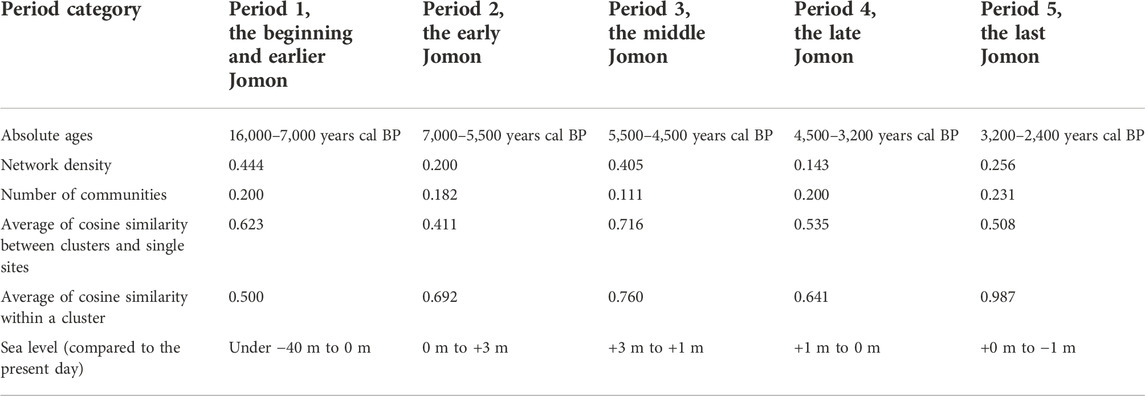
This study focuses on obsidian artifacts excavated from Jomon-period sites in the Kanto region. The Kanto area is located in the eastern part of the main island of Japan, facing Tokyo Bay or Sagami Bay on the south side and the Pacific Ocean on the southeast side, with the northern and northwestern sides facing mountainous regions (Figure 1). The obsidian artifacts brought into the southern Kanto region are known to have originated from these mountainous areas and islands located further south of Tokyo Bay as a result of the obsidian provenance analysis described earlier. The locations of these major provenance areas are shown in Figure 2. They include 1) Takahara-yama, 2) Wada-toge, 3) Omegura, 4) Suwa, 5) Tateshina, 6) Kozu-shima, 7) Hakone, and 8) Amagi. The obsidian artifacts were brought to the consumption areas from the islands via the maritime route [12] and from the mountainous areas on the northwestern side via a circuitous route to the north [21]. Notably, the Jomon period (16,000–2,400 years cal BP) is considered a hunter-gatherer society and not a highly complex state-level society, unlike in the case of Mesoamerica, as shown in related studies [16]. Therefore, these obsidian deliveries are not the result of a centralized logistics system but rather individual trade between provenance and consumption areas. Climatic features of the Jomon period include periods of major climatic and coastline changes. Immediately before the middle Jomon period (5,500–4,500 years cal BP), average temperatures were 2°C higher than today [22], and the so-called Jomon sea-level rise, which in the Kanto region was on average 3 m higher than today, eroded the coastline inland [23, 24]. In contrast, during the late Jomon period (4,500–3,200 years cal BP), average temperatures were lower, with sea level dropping to approximately the same level as today [23, 24].
For the social network analysis of obsidian artifacts, this study increased the regional representativeness by summarizing obsidian numbers by region, which enhanced the readability and interpretability of the analytic results when using a large dataset. This was based on the assumption that geographically adjacent archaeological sites interact and share information with each other and have similar obsidian provenance composition ratios [16]. Particularly, we clustered the geographic locations of archaeological sites using the density-based spatial clustering of applications with the noise (DBSCAN) approach [25]. Additionally, in the case of chemical analysis methods, such as obsidian provenance analysis, all the excavated artifacts are generally not considered owing to limitations in terms of the excavation period and budget. The dataset for this study covers archaeological sites where only a few artifacts were analyzed at one site or, in extreme cases, only a single artifact was analyzed [4]. A limited number of obsidian samples may skew the region composition ratio and distort the results [16]. However, by summarizing based on region, as described earlier, the sample size can be increased and, consequently, the distortion reduced.
Following clustering, we conducted social network analyses using the data for each regional unit, similar to what was done by Ladefoged et al. [20]. The analyses used the cosine similarity of the composition ratio of each obsidian provenance between clusters as the connection strength.
Note that when data are divided into detailed time frames, analysis and interpretation become challenging. Therefore, to address this issue, we grouped the data into time periods frequently used in Japanese archaeology for comparison. The Jomon period was specifically categorized into the following five categories: Period 1, starting from the beginning of the Jomon period to the earlier Jomon period (16,000–7,000 years cal BP); Period 2, consisting of the early Jomon period (7,000–5,500 years cal BP); Period 3, consisting of the middle of the Jomon period (5,500–4,500 years cal BP); Period 4, consisting of the late Jomon period (4,500–3,200 years cal BP); and Period 5, consisting of the last Jomon period (3,200–2,400 years cal BP). The absolute ages of each of these periods are in accordance with Kobayashi [26].
2.1 Dataset on obsidian assemblages
The dataset for this study is based on the results of provenance analyses of obsidian excavated from Jomon-period sites in the Kanto region, compiled by the Executive Committee of the 2011 Tochigi Congress of the Japanese Archaeological Association [14]. Although this dataset was compiled in 2011, it is enormous, and even with the presence of obsidian reported in the years that followed, its analysis results are still considered valuable. In this study, we narrowed down the provenance areas to the following eight main areas: 1) Takahara-yama, 2) Wada-toge, 3) Omegura, 4) Suwa, 5) Tateshina, 6) Kozu-shima, 7) Hakone, and 8) Amagi. For convenience, Wada-toge, Omegura, Suwa, and Tateshina are collectively referred to as the Shinshu group, which belongs to the mountainous area called “Central Highlands.” A few other provenances were excluded from the analysis because they are associated with only a few artifacts. Note that pottery style was used to estimate the obsidian’s attribution period. Based on these attributional periods, this study classified the artifacts into the five-period categories listed earlier. It was assumed that attribution was performed for each period category if the estimated attribution period fell within more than one of them.
Because of the afore-mentioned process, the number of samples used in this study was as follows: Period 1 had 1,444 artifacts from 52 archaeological sites; Period 2 had 3,479 artifacts from 62 sites; Period 3 had 13,340 artifacts from 149 sites; Period 4 had 3,263 artifacts from 59 sites; and Period 5 had 1,714 artifacts from 27 sites.
2.2 Clustering
As previously mentioned, we summarized the results as aggregated values by region to improve their readability and interpretability and reduce the distortion due to small samples. The DBSCAN method [25] was applied to group the geographic locations of the archaeological sites. Many other clustering methods do not consider noise and assign every site to a cluster; this can cause mutually inaccessible sites to be clustered together. On the contrary, the DBSCAN method determines a region as a cluster based on the number of points (density) (minPts) within a certain radius (ε value). The cluster expands as long as the density in the region exceeds a certain threshold, but if there are no nearby points within a certain radius, it is considered as noise. The ε value is determined by the problem to be solved (such as physical distance), and minPts is the optimum size of the smallest cluster. In this study, the ε value was set to 10 km, which is the commonly accepted activity range for the ancient Jomon people [27, 28]. MinPts was set to a minimum of three. The DBSCAN method was used for each of the five-period categories. Considering these clusters as one region, we summed the aggregate values for each obsidian provenance in each region and then calculated the composition ratio of obsidian provenance in each cluster. The composition ratio (R) is defined by the following equation:
where Ri,j denotes the composition ratio of provenance j in cluster (or single site) i; Ti denotes the total number of obsidian artifacts analyzed for provenance in i; and Ni,j denotes the number of obsidian artifacts of provenance j in i.
A few obsidian samples can skew the regional composition ratio and distort the results [16]. Therefore, clusters with less than 30 obsidian artifacts from sites within the cluster were excluded from the analysis in this study. Conversely, if a site did not form a cluster because of its geographic location but had more than 30 obsidian artifacts, the composition of obsidian provenance was calculated in the same manner as clusters and used as a single site in the analysis.
2.3 Social network analyses
The following analyses were conducted for each period category.
2.3.1 Bipartite graphs between provenance and consumption areas
A composition matrix between the provenance area and consumption areas was created based on the number of obsidian artifacts by provenance area for each cluster and single site to determine the relationship between obsidian provenance and consumption areas for each period category. This led to the creation of bipartite graphs with the provenance area and consumption area nodes. A bipartite graph allows connections between nodes in different node groups but not to nodes in the same node group. The links connecting these nodes indicate obsidian that originated from a specific provenance and then was found in a specific consumption area. The thickness of each link was determined by the composition ratio. The link is thicker if the ratio is high and thinner if the ratio is low. The denominator of the composition ratio is not the total number of obsidian artifacts in each period category but the total number of obsidian artifacts in each cluster and site.
2.3.2 Similarity
We calculated the cosine similarity following Ladefoged et al. [20] to measure the degree of similarity in the obsidian provenance composition between clusters, between each cluster and a single site, and between sites within clusters. We calculated the composition ratios of obsidian by provenance using the total number of obsidians in each cluster and single site and treated them as vectors. In other words, because there are eight provenances in this study, they are represented as eight-dimensional vectors. These eight-dimensional vectors were used to calculate the cosine similarity between clusters, between clusters and single sites, and between sites within clusters. The cosine similarity (Sim) is expressed using the following equation:
where SimA, B denotes the similarities between A and B (A and B may be clusters or single sites;
2.3.3 Network analysis among consumption areas
Undirected networks were created between clusters and between clusters and single sites based on the respective cosine similarity among them to determine the relationship between consumption areas for each period category. Each cluster or single site serves as a node, and links are created when the cosine similarity between nodes exceeds 0.9. Network densities were also calculated for these networks for each period category. Network density (D) is the ratio of existing links to all links that can be created in the network. It is expressed using the following equation:
where n denotes the number of nodes and m denotes the number of links in the network. The values range from 0 to 1. A value closer to 1 indicates a higher network density, with a lower limit of 0 representing a network with no relationships and an upper limit of 1 representing a network with all possible relationships.
Note that the density is identical to the average of the cosine similarity of the pairings connecting each node when there is no threshold for cosine similarity greater than 0.9.
We also detected communities from the network using the spin-glass model [29] using a similarity matrix with no threshold for cosine similarity greater than 0.9 because Fortunato [30] found that this model was more effective at determining the proper module compared with several community detection methods in terms of computation time and detection accuracy. The spin-glass model uses the simulated annealing method (which searches for the optimal solution by iteratively seeking solutions in a random neighborhood of the current solution) to maximize the modularity (a measure of edge density within communities in relation to the number of edges between communities) [31]. The number of communities detected was normalized by dividing it by the number of nodes. Many communities indicated that the trade network was subdivided into small modules.
3 Results and discussion
3.1 Clustering
The number of clusters and single sites in each period category and the total number and composition of obsidian by provenance in the clustering using the DBSCAN method are listed in the Supplementary Table. However, Clusters B3 and B6 of Period 1, Cluster E4 of Period 2, and Cluster T4 of Period 5 were excluded from the analysis because the total number of obsidian artifacts in each cluster was less than 30.
Table 1 shows the cosine similarity within each cluster and between sites not belonging to a cluster in each period category to verify whether clustering using the DBSCAN method ensures regional representation. The results demonstrate that the average within-cluster cosine similarity for each cluster in any period category was higher than that between sites that did not belong to a cluster. For example, in Period 1, the average cosine similarity between sites not belonging to a cluster (no cluster) is 0.280, which is lower than the values of B1, B2, B4, and B5. Based on these results, it is reasonable to summarize the aggregate values among nearby sites by region and analyze them in terms of regional representativeness.
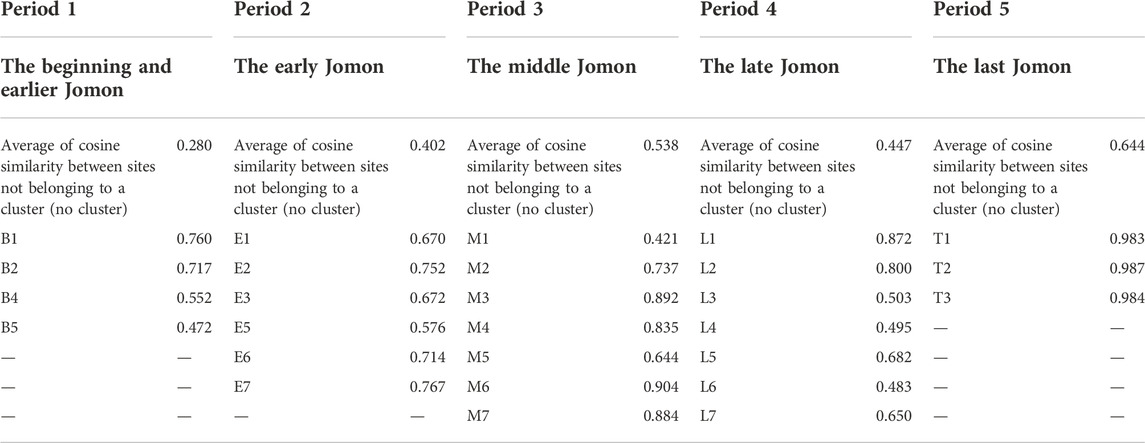
TABLE 1. Cosine similarity within each cluster and between sites not belonging to a cluster in each period category.
3.2 Bipartite graphs between provenance and consumption areas
Figures 3–7 show the outcome of the bipartite graphs between provenance and consumption areas for each period category in terms of the relationship between obsidian provenance and consumption areas. The coastlines shown on the maps for Period 1 (Figure 3), Period 2 (Figure 4), and Period 3 (Figure 5) are, for convenience’s sake, the coastlines of the warm period of the early Jomon period. However, those for Period 4 (Figure 6) and Period 5 (Figure 7) use the late Jomon period cold-weather coastline for the same reason. The former represents a sea advance, whereas the latter denotes a sea retreat.
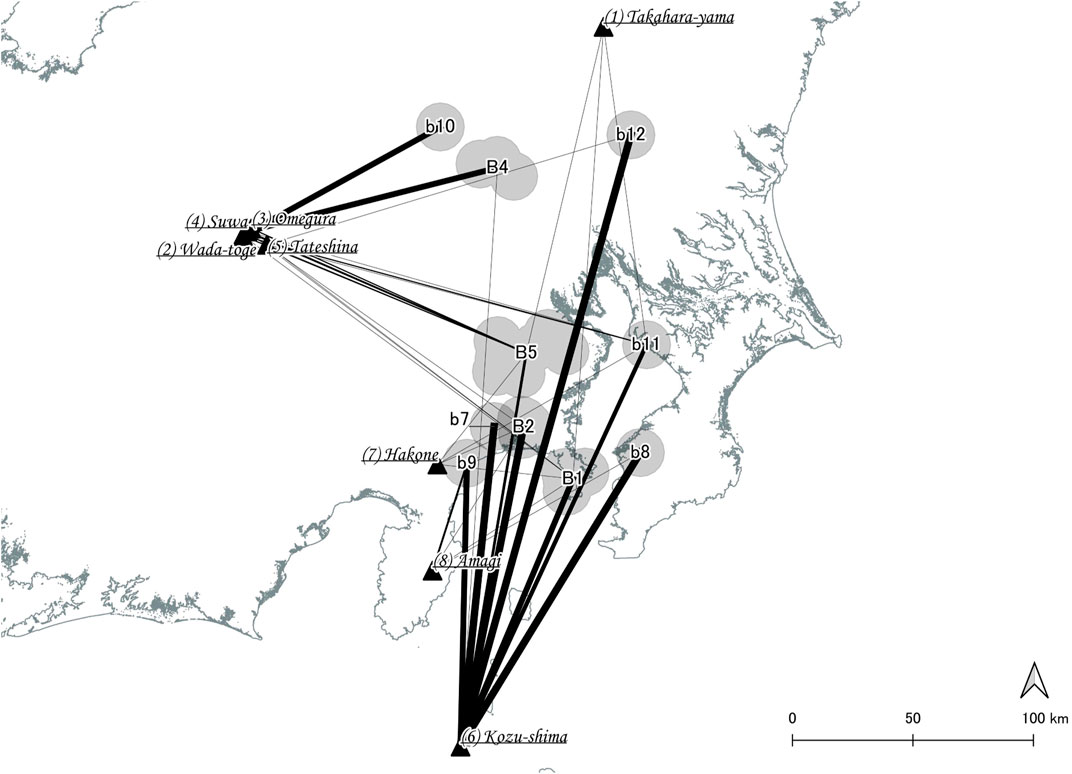
FIGURE 3. Bipartite graphs between provenance and consumption areas in Period 1, the beginning Jomon period, and the earlier Jomon period (16,000–7,000 years cal BP). Clusters are represented by uppercase characters and single sites by lowercase characters. The thickness of the links corresponds to the composition ratio of each production area in each cluster (B1, 2, 4, and 5) and each single site (b7–12).

FIGURE 4. Bipartite graphs between provenance and consumption areas in Period 2, the early Jomon period (7,000–5,500 years cal BP). Clusters are represented by uppercase characters and single sites by lowercase characters. The thickness of the links corresponds to the composition ratio of each production area in each cluster (E1–3, 5–7) and each single site (b8–12).

FIGURE 5. Bipartite graphs between provenance and consumption areas in Period 3, the middle Jomon period (5,500–4,500 years cal BP). Clusters are represented by uppercase characters and single sites by lowercase characters. The thickness of the links corresponds to the composition ratio of each production area in each cluster (M1–7) and each single site (b8–17).

FIGURE 6. Bipartite graphs between provenance and consumption areas in Period 4, the late Jomon period (4,500–3,200 years cal BP). Clusters are represented by uppercase characters and single sites by lowercase characters. The thickness of the links corresponds to the composition ratio of each production area in each cluster (L1–7) and each single site (l8–l15).
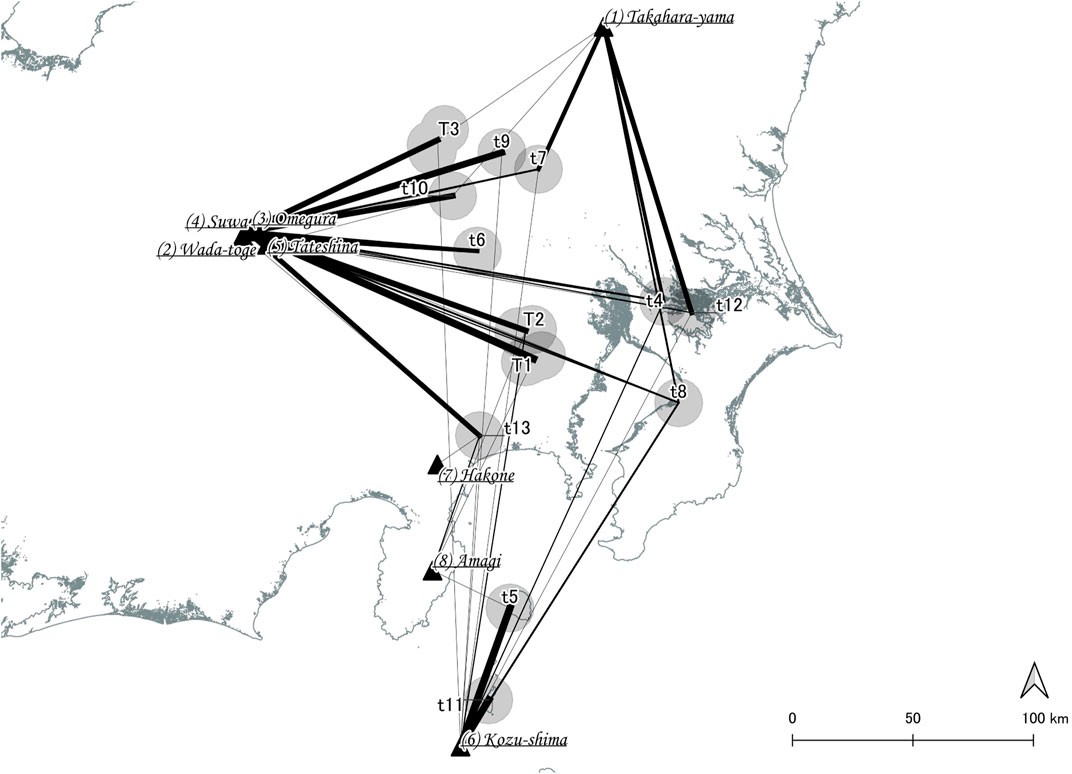
FIGURE 7. Bipartite graphs between provenance and consumption areas in Period 5, the last Jomon period (3,200–2,400 years cal BP). Clusters are represented by uppercase characters and single sites by lowercase characters. The thickness of the links corresponds to the composition ratio of each production area in each cluster (T1–3) and each single site (t4–t13).
These bipartite graphs show that up to Period 2, a significant portion of the obsidian in each cluster originated from the provenance area within a relatively short geographical distance from the cluster. However, in Period 3, obsidian of island provenance crossed the sea and was widely dispersed across the Kanto region, and it was also widely distributed in the Kanto region. Particularly, in Period 1 (Figure 3, Supplementary Table S1), Kozu-shima had a high frequency only in coastal clusters and single sites across the sea (except for b12). However, B4 and b10 in the inland region had a high frequency of obsidian from Wada-toge, Suwa, and Tateshina, which are relatively close to each other. Additionally, B5, located in the center, was not concentrated in one particular locality, and obsidian from various provenances was observed. In Period 2 (Figure 4, Supplementary Table S1), the trend seen in Period 1 became more pronounced, whereas Kozu-shima had a high frequency only in certain coastal clusters and single sites, and the Shinshu group of Wada-toge, Omegura, Suwa, and Tateshina had high frequency in E6, e9, and e12 in the inner bay. However, in Period 3 (Figure 5, Supplementary Table S1), Kozu-shima had a high frequency not only in coastal clusters and single sites but also in most clusters and single sites, except for M3 and m16. The Shinshu group was also found in most clusters and single sites, with a frequency similar to that of Kozu-shima. According to Tsutsumi [13], the demand for obsidian owing to the rapid population growth in the Central Highlands during the middle Jomon period stopped the distribution of the Shinshu group obsidian to other regions and caused obsidian from Kozu-shima to be the main provenance in other regions. However, a portion of obsidian from the Shinshu group was still spread throughout the southern Kanto region during the middle Jomon period.
After Period 4, the distribution of island-produced obsidian shrinks to a small number of coastal areas and islands that are closer in distance. Instead, obsidian of inland provenance with close geographic distance is found in each cluster or single site. Particularly, in Period 4 (Figure 6, Supplementary Table S1), the frequency of Kozu-shima decreased with geographic distance, whereas the Shinshu group of Wada-toge, Omegura, Suwa, and Tateshina, as well as Takahara-yama, had a high frequency in clusters or single sites at relatively close geographic distances. The trend observed in Period 4 became more pronounced in Period 5 (Figure 7, Supplementary Table S1). The Shinshu group and Takahara-yama became highly frequent in clusters and single sites with relatively close geographical distances.
In summary, the relationship between provenance and consumption areas can be divided into three stages.
Stage 1: until Period 2, obsidian in each cluster or single site, with some exceptions, had a high frequency in provenance areas of relatively close geographical distance.
Stage 2: in Period 3, distant island and inland provenances were widely distributed throughout the Kanto region.
Stage 3: after Period 4, the condition returned to that of Period 2. Obsidian in each cluster or single site had a high frequency in provenance areas of relatively close geographical distance.
Regarding the distance between the provenance and consumption areas, for example, Negash et al. [32] believed that “some kind of exchange” occurred because the artifacts were distributed hundreds of kilometers away from the provenance. The present study also showed that the consumption areas did not necessarily select the geographically shortest provenance area, and obsidian from Kozu-shima had a high frequency in inland areas more than 200 km from the consumption sites. The fact that obsidian from Kozu-shima was excavated far inland indicates that obsidian may have been obtained through trade rather than the direct collection at the source. Tateishi [21] also evaluated a travel cost model using a digital elevation model on a geographic information system (GIS). The results showed that Takahara-yama could be easily accessed from southern Kanto, whereas access to the Shinshu group is difficult. Furthermore, it was easier to access the Shinshu group via a circuitous route compared to the shortest route from southern Kanto. Considering the afore-mentioned, the expansion of the distribution of the Shinshu group to the southeast, which was difficult to access from the provenance areas, after Period 2, suggests that obsidian was obtained through trade rather than direct extraction.
Tsumura and Tateishi [4] examined patterns of obsidian provenance and consumption in the Kanto region and found that 1) coastal obsidian provenances had relatively narrower supply zones than inland provenances, such as the Shinshu group and Takahara-yama throughout the period, 2) the Shinshu group had greater temporal variation than Takahara-yama, and 3) the distribution trends of obsidian in each region showed major demarcation periods during the middle Jomon and late Jomon periods.
The results of this study seem to differ in part from these findings: in particular, in contrast to finding 1, the obsidian of Kozu-shima, a coastal island, was found to be widely distributed in this study. This discrepancy may be attributed to the fact that their study considered and interpreted a very small sample in the dataset. On the contrary, the present study evaluated a higher proportion of provenance composition ratio to provide a wider interpretation. However, the present results support findings 2 and 3 with the bipartite graphs plotted on maps providing further detail. Thus, the results of this study show that the distribution of the obsidian of the Shinshu group, together with that of Kozu-shima, expanded widely in the Kanto region in the middle Jomon period but shrank in the following period.
The next section reports the results of the network analysis among the obsidian consumption areas from the perspective of trade among them.
3.3 Network analysis among consumption areas
From the perspective of consumption areas, the networks among consumption areas for each period category are plotted on the maps in Figures 8–12, and their network densities are shown inTable 2. The coastlines in these maps are the same as those in Figures 3–7.
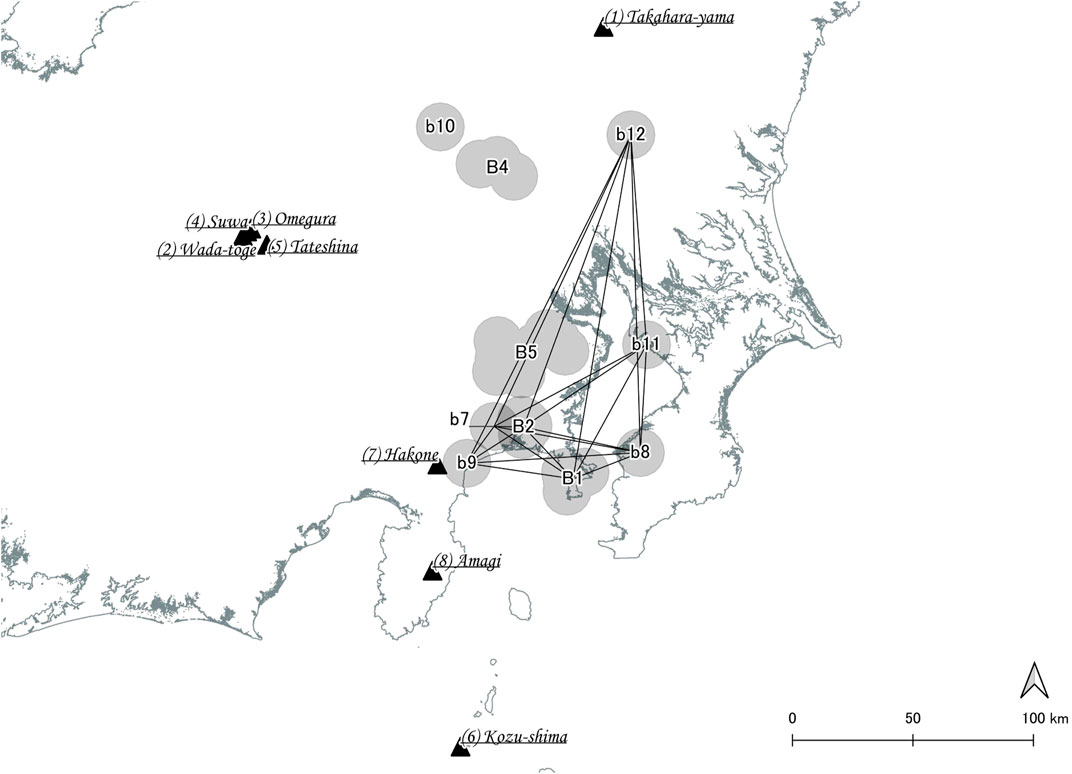
FIGURE 8. Network among consumption areas in Period 1, the beginning Jomon period and the earlier Jomon period (16,000–7,000 years cal BP). Clusters are represented by uppercase characters and single sites by lowercase characters. Pairs with a cosine similarity of more than 0.9 in the composition ratio of each provenance area are linked.
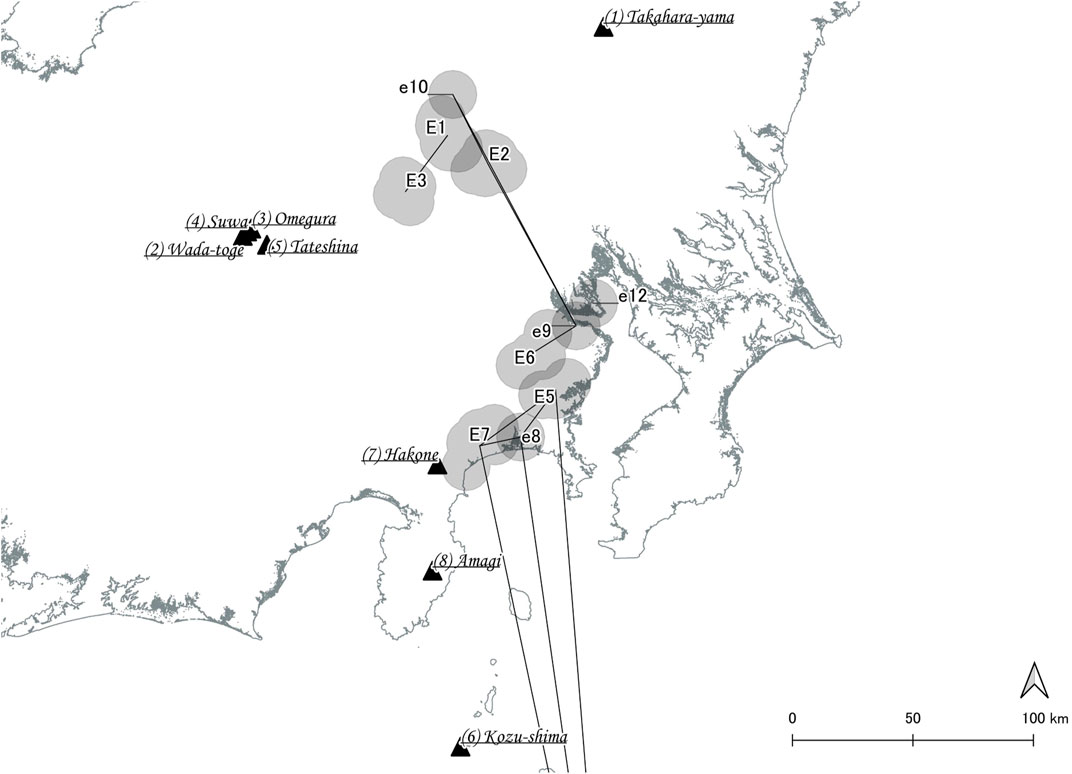
FIGURE 9. Network among consumption areas in Period 2, the early Jomon period (7,000–5,500 years cal BP). Clusters are represented by uppercase characters and single sites by lowercase characters. Pairs with a cosine similarity of more than 0.9 in the composition ratio of each provenance area are linked.
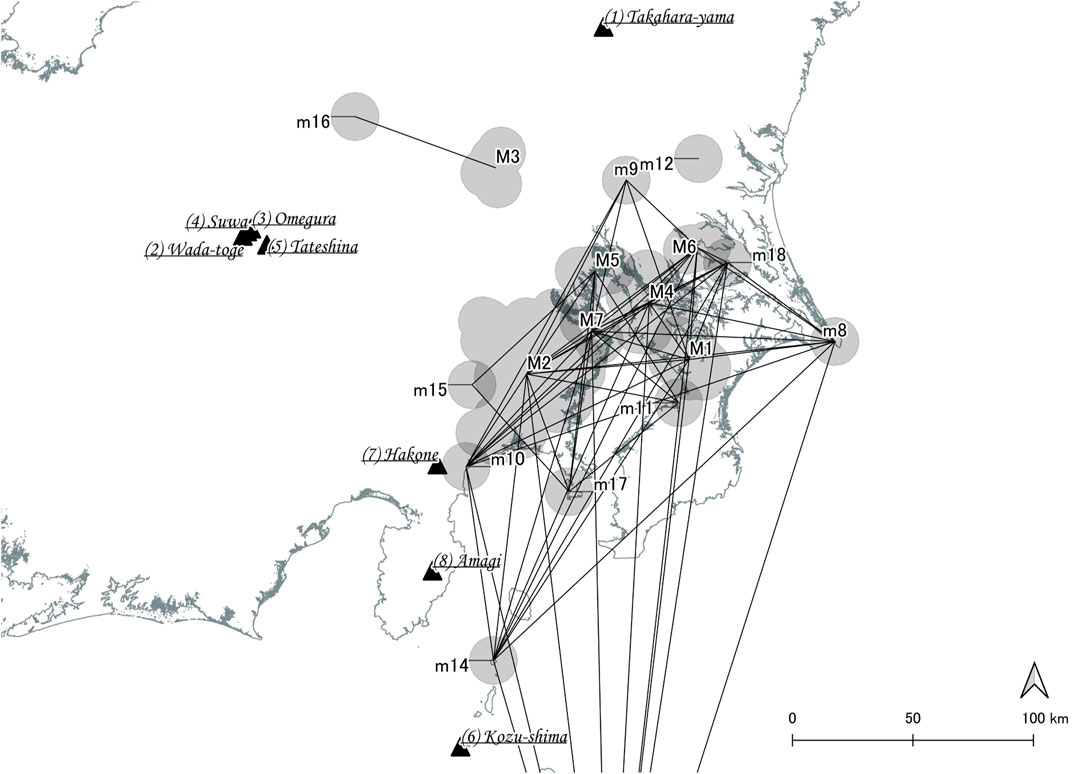
FIGURE 10. Network among consumption areas in Period 3, the middle Jomon period (5,500–4,500 years cal BP). Clusters are represented by uppercase characters and single sites by lowercase characters. Pairs with a cosine similarity of more than 0.9 in the composition ratio of each provenance area are linked.
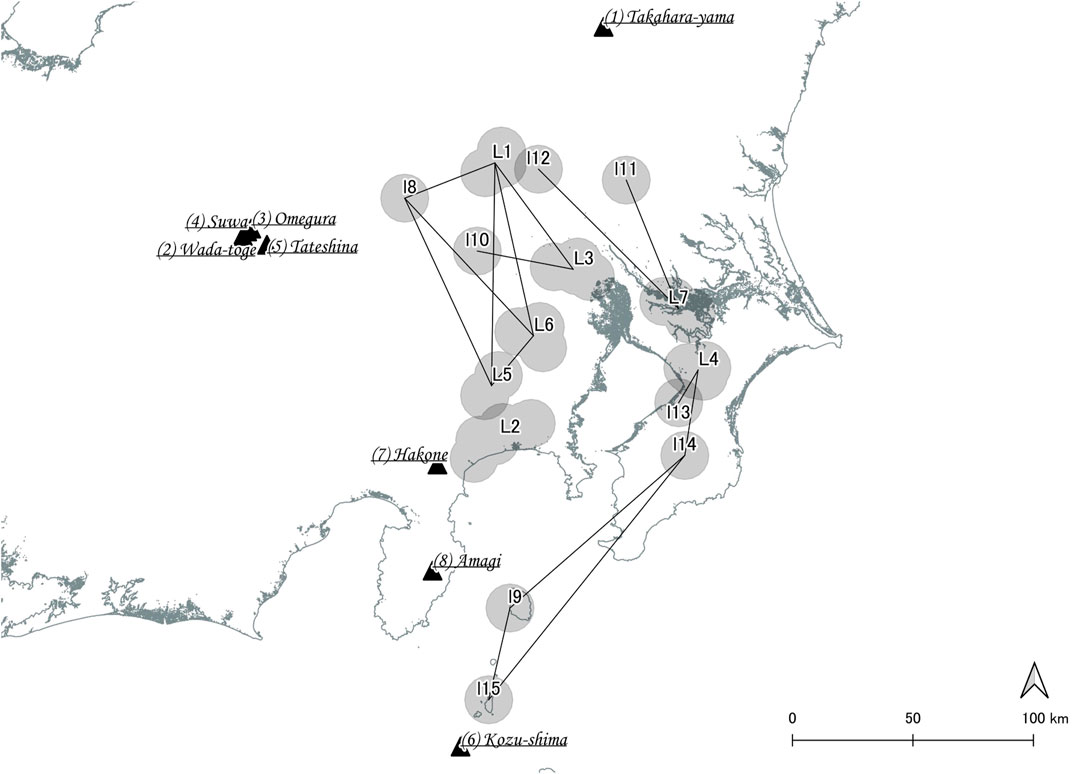
FIGURE 11. Network among consumption areas in Period 4, the late Jomon period (4,500–3,200 years cal BP). Clusters are represented by uppercase characters and single sites by lowercase characters. Pairs with a cosine similarity of more than 0.9 in the composition ratio of each provenance area are linked.
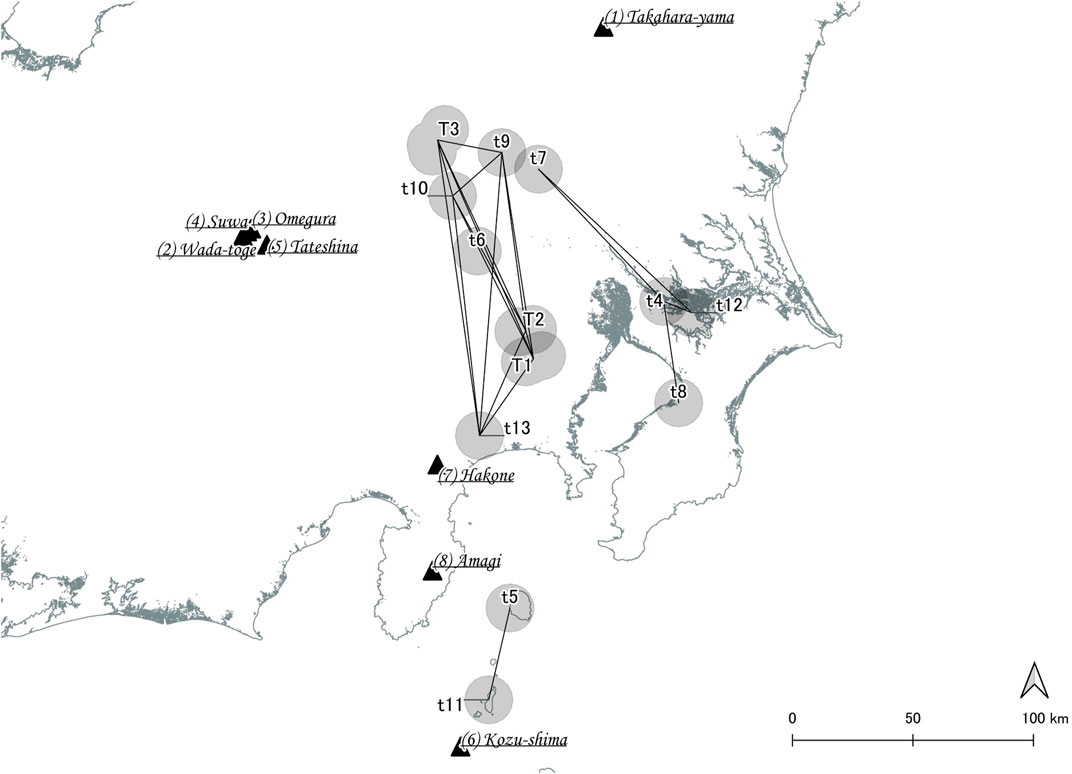
FIGURE 12. Network among consumption areas in Period 5, the last Jomon period (3,200–2,400 years cal BP). Clusters are represented by uppercase characters and single sites by lowercase characters. Pairs with a cosine similarity of more than 0.9 in the composition ratio of each provenance area are linked.
Contrary to Periods 1 and 2, when the networks among consumption areas were limited to certain regions (Figure 8) or fragmented (Figure 9), the network among consumption areas in Period 3 extended over the entire region (Figure 10). The networks among consumption areas in Periods 4 and 5 (Figures 11, 12, respectively) were fragmented. Particularly, in Period 1 (Figure 8), there was only one partial network consisting of B1, B2, and some other sites, whereas B4 and B5 were excluded from the partial network. This was the network in which Kozu-shima had a high frequency. In Period 2 (Figure 9), there was a partial network consisting of E5, E7, and island single sites (not shown); a partial network consisting of E1 and E3; and a partial network consisting of E2, E6, and certain other single sites. These were networks in which Kozu-shima and the Shinshu group of Wada-toge, Omegura, Suwa, and Tateshina had high frequency. However, in Period 3 (Figure 10), a large network included most clusters and single sites, such as M1, M2, and M4–M7. This network is a mixture of Kozu-shima and the Shinshu group. However, in Period 4 (Figure 11), there were certain partial networks, such as a partial network consisting of L1, L3, L5, and L6; a partial network consisting of L4 and some single sites; and a partial network consisting of L7 and some single sites. In Period 5 (Figure 12), in addition to a partial network that included T1, T2, and T3, two partial networks included certain single sites. These were the networks with high frequencies of Kozu-shima, the Shinshu group, and Takahara-yama.
Compared with these network densities (Table 2), the density of Period 3 (0.405) was higher than those of Period 2 (0.200), Period 4 (0.143), and Period 5 (0.256). Particularly, Period 3 had a value more than twice that of Period 4. The network density, when not cut off by the 0.9 cosine similarity threshold, corresponds to the average cosine similarity among clusters and single sites. These values are higher in Period 3 (0.716) than in Period 1 (0.623), Period 2 (0.411), Period 4 (0.535), and Period 5 (0.508), as shown in Table 2. This trend was also observed between clusters and single sites in Table 2. The cosine similarity value within a cluster of Period 3 (0.760) was higher than those of Period 1 (0.500), Period 2 (0.692), and Period 4 (0.641).
The number of communities was lower in Period 3 (0.111) than in Period 1 (0.200), Period 2 (0.182), Period 4 (0.200), and Period 5 (0.231), as shown in Table 2. The small value indicates that the trade network expanded throughout the region and was concentrated into one network. Thus, Period 3 indicates that the trade network was expanding.
The results of these network analyses of consumption areas, when combined with those from the bipartite graph of provenance and consumption areas in the previous section, suggest the following three stages:
Stage 1: Until Period 2, Kozu-shima and the Shinshu group of Wada-toge, Omegura, Suwa, and Tateshina were directly collected or exchanged within a narrow regional network of consumption areas within a relatively close geographical distance.
Stage 2: In Period 3, a wide-area trade network was developed, with the distribution of Kozu-shima and the Shinshu group overlapping in most regions.
Stage 3: After Period 4, Kozu-shima, the Shinshu group, and Takahara-yama returned to a state of direct collection or exchange in a small regional network among consumption areas within a relatively close geographical distance.
3.4 Tipping points of the obsidian trade network
The afore-mentioned results confirm the possibility of the existence of tipping points with respect to trade networks among consumption areas, where trade networks became extensive in the middle Jomon period (5,500–4,500 years cal BP) and regionalized in the late Jomon period (4,500–3,200 years cal BP). Immediately before the middle Jomon period, the average temperature and sea level were 2°C and 3 m, respectively, higher than those of today because of the so-called Jomon sea advance [22–24], which made marine resources more readily available. However, in the late Jomon period, when trade networks regionalized, the temperatures began to cool, sea levels dropped to the same levels as today [23, 24], and marine resources became more difficult to obtain. According to Sugihara and Kobayashi [12], the expansion of the distribution of obsidian from Kozu-shima in the middle Jomon period and the subsequent contraction of Kozu-shima in the late Jomon and the last Jomon periods (3,200–2,400 years cal BP) are related to the formation and contraction of the sea bay caused by sea advance and sea retreat, respectively. From the perspective of paleo-population, Yano [33], focusing mainly on western Japan, stated that population movements were repeated until the first half of the Jomon period owing to the low total population; however, in the latter half of the Jomon period, the population density in each region was averaged out to form a wide-area network that made population movement unnecessary. In the Kanto region, the population increased in the middle Jomon period and then decreased in the late Jomon period [34]. Therefore, population growth, decline, and migration owing to changes in the coastline and living infrastructure caused by climate change may have represented the tipping points of the trade network.
4 Conclusion and future work
The trade networks in the Jomon period were not always constant. In this study, their dynamics and tipping points were explored via the social network analyses of a large-scale obsidian-artifact provenance dataset.
Consequently, the following conclusions were drawn:
1) For analyzing the large provenance dataset, the DBSCAN method was used to improve the readability and interpretability of the results and reduce any distortion among them owing to the small sample sizes used in this study. This study clustered the sites by geographic location and summarized them in aggregate values by region to increase the representativeness of the regions. It was found that it is reasonable to summarize the aggregate values by region for sites close to each other and to analyze them in terms of regional representativeness.
2) The results of the bipartite graph of provenance and consumption areas and the network analysis among consumption areas indicated that the obsidian trade network was extensive throughout the Kanto region in the middle Jomon period. However, it may have later regionalized in the late Jomon period. These were extracted as tipping points of the ancient Japanese Jomon hunter-gatherer trade network.
3) The timing of these tipping points potentially occurred during a period of significant climate change, suggesting that the tipping points have been represented by population growth, decline, and migration owing to changes in the coastline and living infrastructure caused by climate change.
When considering the ε value as a DBSCAN parameter and the geographical distance between provenance and consumption areas, a straight-line distance was assumed in this study for convenience. However, when considering access to the provenance area and other sites of the residents, the shortest distance or route should differ depending on the geographical features, such as elevation difference, slope, and sea. In the future, we believe that by using ancient digital elevation data in a GIS, it will be possible to extract more precise regional clusters and calculate the shortest travel costs between provenance and consumption areas using hiking functions [20,35]. In addition to the obsidian, a social network analysis of other artifacts can be conducted (such as pottery) based on their similarities and differences, as reported by Mills et al. [36] for the southwestern United States in the late prehispanic period or a social network analysis of the obsidian can be performed along with a social network analysis of pottery. Based on the results of this study, we hope to have described the dynamics of trade networks and their tipping points in the hunter-gatherer period from a more multifaceted perspective.
Data availability statement
The original contributions presented in the study are included in the article/Supplementary Material, Further inquiries can be directed to the corresponding author.
Author contributions
FS: conceptualization, data curation, formal analysis, funding acquisition, investigation, methodology, project administration, resources, software, supervision, validation, visualization, writing—original draft, and writing—review and editing. HT: data curation and funding acquisition.
Funding
This work was supported by JSPS KAKENHI (Grant nos. 21K21323, 22K18156, and 22H00021), Japan. These funding sources were not involved in preparing the manuscript or in the collection, analysis, and interpretation of data.
Acknowledgments
We would like to thank Prof. H. Hara (Kyoto University) for the useful discussions.
Conflict of interest
The authors declare that the research was conducted in the absence of any commercial or financial relationships that could be construed as a potential conflict of interest.
Publisher’s note
All claims expressed in this article are solely those of the authors and do not necessarily represent those of their affiliated organizations or those of the publisher, the editors, and the reviewers. Any product that may be evaluated in this article, or claim that may be made by its manufacturer, is not guaranteed or endorsed by the publisher.
Supplementary material
The Supplementary Material for this article can be found online at: https://www.frontiersin.org/articles/10.3389/fphy.2022.1015870/full#supplementary-material
References
2. Ono A. Obsidian in the natural resource environment: A methodological perspective. Nat Resource Environ Humans (2011) 1:1–8. (In Japanese with English abstract).
3. Freund KP. An assessment of the current applications and future directions of obsidian sourcing studies in archaeological research. Archaeometry (2013) 55:779–93. doi:10.1111/j.1475-4754.2012.00708.x
4. Tsumura H, Tateishi T. Transition of the network of the obsidian distribution in Kanto region, the Jomon period. Zoo-archaeology (2013) 30:377–93. (In Japanese with English abstract).
5. Suzuki M. Chronology of prehistoric human activity in Kanoto, Japan. Part I, 4. Section V: Journal of the Faculty of Science, University of Tokyo (1973). p. 241–318.
6. Suzuki M. Chronology of prehistoric human activity in Kanoto, Japan. Part Ⅱ, 4. Section V: Journal of the Faculty of Science, University of Tokyo (1974). p. 395–469.
7. Warashina T, Higashimura T. Sekki-genzai no sanchi-bunseki. In: Kokogaku to KanrenkagakuKamaki yoshimasa sensei koki-kinen-ronshu-kankokai (1988). p. 447–91. (In Japanese).
8. Kanayama Y. Jomon jidaizenki ni okeru kokuyoseki-koeki no shutsugen. Hosei-kokogaku (1994) 17:61–5. (In Japanese).
9. Kojo Y. Jomon chuki niokeru Shinshu-san kokuyoseki no Minami Kanto heno hannyuro. J Archaeological Soc Nippon (1996) 81:340–50. (In Japanese).
12. Sugihara S, Kobayasgi S Scientific analysis of an obsidian source and its distribution, with special reference to obsidian quarried in the Kozu Island, off the pacific coast of Japan. Memoirs of the Institute of Humanities, Meiji University (2008) 62:97–229. (In Japanese with English abstract).
13. Tsutsumi T. Shinshukokuyosekigensanchi no shigenkaihatsu to kyokyu o megutte. Shimanekenkodaibunka Cent kenkyuronshu (2018) 19:153–68. (In Japanese).
14. Nihon-kokogaku-kyokai 2011 nendo tochigi-taikai-jikkoiinkai . Sekki-jidai niokeru sekizai-riyo no chiiki-so. In: 2011 nendo tochigi-taikai-kenkyuhappyo-shiryoshu (2011). p. 7–306. (In Japanese).
15. Golitko M, Meierhoff J, Feinman GM, Williams PR. Complexities of collapse: The evidence of maya obsidian as revealed by social network graphical analysis. Antiquity (2012) 86:507–23. doi:10.1017/S0003598X00062906
16. Golitko M, Feinman GM. Procurement and distribution of pre-hispanic mesoamerican obsidian 900 BC-ad 1520: A social network analysis. J Archaeol Method Theor (2015) 22:206–47. doi:10.1007/s10816-014-9211-1
17. Pearce E, Moutsiou T. Using obsidian transfer distances to explore social network maintenance in late Pleistocene hunter-gatherers. J Anthropological Archaeology (2014) 36:12–20. doi:10.1016/j.jaa.2014.07.002
18. Freund KP, Batist Z. Sardinian obsidian circulation and early maritime navigation in the neolithic as shown through social network analysis. J Island Coast Archaeol (2014) 9:364–80. doi:10.1080/15564894.2014.881937
19. Ibanez JJ, Ortega D, Campos D, Khalidi L, Mendez V. Testing complex networks of interaction at the onset of the near eastern neolithic using modelling of obsidian exchange. J R Soc Interface (2015) 12:20150210. doi:10.1098/rsif.2015.0210
20. Ladefoged TN, Gemmell C, McCoy M, Jorgensen A, Glover H, Stevenson C, et al. Social network analysis of obsidian artefacts and Maori interaction in northern Aotearoa New Zealand. PLoS one (2019) 14:e0212941. doi:10.1371/journal.pone.0212941
21. Tateishi T. Study on material and information exchange in the Jomon period -Analysis of Jomon pottery and obsidians lithics using scientific techniques-. [dissertation/Ph. D. thesis]. Sakura (Chiba): The Graduate University for Advanced Studies SOKENDAI (2010). (In Japanese with English Abstract).
23. Kosugi M. Coastline and adjacent environments of the former Tokyo bay in the holocene. Geogr Rev Jpn Ser A Chirigaku Hyoron (1989) 62:359–74. doi:10.4157/grj1984a.62.5_359
25. Ester M, Kriegel H, Sander J, Xu X. “A density-based algorithm for discovering clusters in large spatial databases with noise” in Proceedings of the Second International Conference on Knowledge Discovery and Data Mining, KDD'96, Portland, Oregon (1996).
27. Akazawa T. Maritime adaptation of prehistoric hunter-gatherers and their transition to agriculture in Japan. Senri Ethnological Stud (1982) 9:213–58.
28. Koizumi M. Chugoku Shikoku chiho niokeru Jomon kaizuka no tayosei ni kansuru kisoteki-kosatsu. The bulletin of the Faculty of Law and Letters: Humanities (2016), 40: p. 75–118. (In Japanese).
29. Reichardt J, Bornholdt S. Statistical mechanics of community detection. Phys Rev E (2006) 74:016110. doi:10.1103/PhysRevE.74.016110
30. Fortunato S. Community detection in graphs. Phys Rep (2010) 486:75–174. doi:10.1016/j.physrep.2009.11.002
31. Newman MEJ, Girvan M. Finding and evaluating community structure in networks. Phys Rev E (2004) 69:026113. doi:10.1103/PhysRevE.69.026113
32. Negash A, Brown F, Nash B. Varieties and sources of artefactual obsidian in the middle stone age of the middle awash, Ethiopia. Archaeometry (2011) 53:661–73. doi:10.1111/j.1475-4754.2010.00579.x
33. Yano K. Some studies on the Jomon population. Ritsumeikan Pan-Pacific Civilization Stud (2014) 1:11–22. (In Japanese with English abstract).
34. Imamura K. Jomon-jidai no jukyo-shi-su to jinko no hendo. In: Fujimoto T, editor. Ju no koukogaku. Doseisha (1997). p. 45–60. (In Japanese).
35. Tobler W. Three Presentations on Geographical Analysis and Modeling. National Center for Geographic Information and Analysis Technical Report 93-1. Santa Barbara, CA: University of California, Santa Barbara (1993).
Keywords: ancient Japanese, Jomon period, trade network, social network analysis, obsidian artifacts
Citation: Sakahira F and Tsumura H (2023) Tipping points of ancient Japanese Jomon trade networks from social network analyses of obsidian artifacts. Front. Phys. 10:1015870. doi: 10.3389/fphy.2022.1015870
Received: 10 August 2022; Accepted: 15 November 2022;
Published: 05 January 2023.
Edited by:
Setsuya Kurahashi, University of Tsukuba, JapanReviewed by:
Robert Tykot, University of South Florida, United StatesKeiko Mori, Bunkyo University, Japan
Copyright © 2023 Sakahira and Tsumura. This is an open-access article distributed under the terms of the Creative Commons Attribution License (CC BY). The use, distribution or reproduction in other forums is permitted, provided the original author(s) and the copyright owner(s) are credited and that the original publication in this journal is cited, in accordance with accepted academic practice. No use, distribution or reproduction is permitted which does not comply with these terms.
*Correspondence: Fumihiro Sakahira, ZnVtaWhpcm8uc2FrYWhpcmFAb2l0LmFjLmpw
 Fumihiro Sakahira
 Hiroomi Tsumura2