 Hui Liu
 Lei Feng
95% of researchers rate our articles as excellent or good
Learn more about the work of our research integrity team to safeguard the quality of each article we publish.
Find out more
ORIGINAL RESEARCH article
Front. Phys. , 23 September 2022
Sec. Social Physics
Volume 10 - 2022 | https://doi.org/10.3389/fphy.2022.1015103
This article is part of the Research Topic Network Mining and Propagation Dynamics Analysis View all 17 articles
China has become the world’s largest market for the production and sales of new energy vehicles. In the Internet era, online review data is becoming more and more important, and it is a great challenge for new energy vehicle manufacturers and consumers to quickly obtain and find out the effective information in the review data. In view of the above understanding, this study uses the Bert-wwm-ext model structure, data mining, and deep learning to study the new energy vehicle selection, and also analyzes the positioning of domestic and foreign new energy vehicle brands and their brand development from the perspective of complex networks. The research results found that: 1) Consumers pay more and more attention to the quality of new energy vehicles. 2) The comparative analysis of BEV and PHEV reveals that consumers’ evaluation of both types of vehicles is roughly comparable, but the difference in satisfaction with the endurance of both types of vehicles is very obvious. 3) Most of the brands of new energy vehicles are concentrated in the price range of RMB80,000 to RMB350,000, and within this range, consumers’ evaluation is positively correlated with the price of the vehicle. Among the new energy vehicle brands over RMB350,000, consumer evaluation does not rise with the price of the vehicle. 4) The head effect of Chinese brands is significant, Foreign brands have formed strong brands with high brand premiums.
With the deepening of the global energy crisis, the depletion of oil resources and the aggravation of air pollution, urban smog, and rising global temperatures, governments around the world are planning to adopt new energy vehicles to establish new transportation systems and provide corresponding support policies [1], in a way to combat global warming and achieve carbon neutrality [2].
The attention of scholars all over the world on the research topic of electric vehicles continues to increase. The research on the choice of new energy vehicles mainly includes: financial subsidies, tax relief, free parking and priority driving and other new energy vehicle incentive policies on the choice of new energy vehicles [3–6], the influence of technical factors such as cruising range, charging equipment, top speed, acceleration performance, and quietness on the selection of new energy vehicles [7–10], the influence of economic factors such as car purchase cost and electricity price on the choice of new energy vehicles [11–13], the influence of consumer personal characteristics such as gender, age, education level, income and occupation on the choice of new energy vehicles [14–15].
The new energy vehicle industry is characterized by a complex network [16]. Most of the previous studies were conducted through questionnaires [17, 18]. The small sample method of the questionnaire survey cannot better reflect the public and generality; in addition, in the process of filling out the questionnaire, some questions may not express real feelings, and cannot better reflect the objectivity and accuracy of the data; Finally, in the Internet age, consumers’ consumption habits and behaviors have changed, and the method of questionnaires cannot reflect the attitudes of consumers at that time.
Cars are relatively high-value products, and consumers generally tend to spend longer and search for more information to make multiple comparisons before making a final purchase decision [19]. In the Internet era, consumers are more and more inclined to obtain information on products or services through online reviews, and information search before purchasing is considered an inevitable event for consumers’ purchasing behavior [20]. Information about a product or brand increases product awareness and convinces people to try these things [21]. Research shows that nearly 50% of consumers spend more than 10 h searching for information when choosing a car that matches their needs [22]. Word of mouth can improve brand perception, promote the diffusion of new products, and increase sales, thereby increasing corporate profits and market competitiveness [23]. With the development of the Internet, word-of-mouth has evolved towards online word-of-mouth to a large extent.
China has become the world’s largest new energy vehicle production and sales market. Self-owned brands are rising rapidly, and the number of new energy vehicle companies is growing. In the Internet era, the channels for consumers to obtain information are more and more diversified, and the information they obtain is relatively more and more abundant. Consumers’ attitudes or word of mouth are becoming more and more important to manufacturers. Facing the diversified and personalized needs of consumers, how can China’s new energy vehicles win in the fiercely competitive industry? How can the production of new energy vehicle companies better match the needs of consumers? From the perspective of demand, it is of great theoretical and practical significance to study the choice of new energy vehicles.
In summary, based on the complex neural network, this paper conducts data mining and deep learning on the 77,000 word-of-mouth texts of Autohome, the largest professional automobile communication platform in China, and studies the development of new energy vehicles in China from the demand side. The main contributions of the research are: establishing a consumer new energy vehicle choice model, and applying the BERT model to the research on new energy vehicles for the first time, analyzing the changes in consumers’ choice of new energy vehicles from the perspective of time series; secondly, by analyzing the initial data Conduct training to study the impact of new energy vehicle brand influence on the choice of new energy vehicles and analyze the differences in the development of Chinese and foreign new energy vehicle brands through consumers’ purchasing decisions, so as to provide opportunities for new energy vehicle brands to break through and the development direction of the new energy vehicle industry. The path of reference.
In terms of the development trend of new energy vehicles, China’s new energy vehicle market has entered a rapid development phase since 2014, with intense competition among enterprises and the concentration of the industry beginning to increase. In 2014, China launched a total of 16 new energy vehicle policies, including exemption from purchase tax, clarifying the proportion of new energy vehicles in new public vehicles, and breaking local protectionism. These policies have promoted the development of the new energy vehicle industry.
From the supply side, during the year, new car makers such as LeTV, NIO and Xiaopeng started to enter the market, making China’s new energy vehicle market show explosive growth. From the demand side, the national sales of new energy vehicles exceeded 70,000 units in 2014, more than three times the previous year. From the perspective of data availability, the rapid growth in the number of consumers purchasing new energy vehicles will lead to a rapid growth in the number of consumer reviews of new energy vehicles, which provides the data basis for big data analysis of consumer reviews.
Overall, 2014 was the first year of commercialization of new energy vehicles in China. Therefore, it is reasonable to conduct word cloud analysis of new energy vehicle data after 2014, which can see the changing trend of consumers’ reasons for purchasing new energy vehicles.
The data in this article comes from the word-of-mouth reviews of Autohome, which were obtained through web crawler. Autohome is the largest auto website in China and one of the earliest established auto websites. The data of consumer reviews in the website are the most abundant among all auto websites and also span the longest period of time. Therefore, Autohome’s data has the most research value. The word-of-mouth data of Autohome is standardized. The website will provide 11 fields for consumers to make an overall evaluation of the car: most satisfied, least satisfied, space, power, control, endurance, comfort, exterior, interior, cost performance, and reasons for choosing this car. In addition, there are also indicators such as review time, the number of views per review, and the price of the car, which are standardized data for easy analysis and research.
The data crawled is all the new energy vehicle word-of-mouth data in Autohome before 12 June 2022, with 77,712 data initially collected.
After getting the raw data, we need to pre-process the data. In the raw data, there are two kinds of problems: one problem is that there are duplicates in the data, and a de-duplication operation should be performed on this part of the data; the other problem is that there are vacant fields in the data, which is not conducive to subsequent analysis, and this part of the data needs to be deleted. After these two steps, 73,322 data remain.
After removing some bad quality data, some fields in the data still need to be processed.
Since the year needs to be used for subsequent time series analysis, the year of the review needs to be extracted from the review time as a new field.
In addition, the price of the car also needs to be further processed. In the new energy car data, the data of price has three forms. The first one is that there is only a single price for that type of car. For example, the price of Tesla Model 3 is RMB279,900; the second is the price of the range. For example, the price of BYD Qin is in the price range of RMB129,900 to RMB174,800; the third type is no offer, this part of the data has no price information. This type of data is relatively small, with only 1,137 data belonging to this type. In order to facilitate the analysis of car prices, it is necessary to standardize the prices. For the first type of data, keep its original price; for the second type of data, take the average of the interval price as the price of the car; for the third type of data, leave it for now. In the price analysis, just remove this part of the data. After the above processing, we get the new field “Average Price”.
The word cloud can display the keywords in the text in a visual form. Through the word cloud analysis, it is possible to visualize the indicators that consumers are concerned about in new energy vehicles. The most important step in creating a word cloud is word separation. Only after the text has been split into words can the word frequency be counted. Jieba is a third-party library for python, which is often used for splitting words. The process of using jieba library to split words is as follows:
1) Load the default statistical dictionary
A statistical dictionary file “dict.txt” is available in the jieba library. In this dictionary file, each line contains a word and shows the frequency and lexical nature of the word.
2) Building a prefix dictionary
The prefix dictionary extracts every prefix of every word that appears in the statistical dictionary and counts the word frequency. If a prefix word does not appear in the statistical dictionary, the word frequency is counted as zero.
3) Generate directed acyclic graphs
The input text is scanned based on the prefix dictionary to generate a directed acyclic graph. For example, if the sentence "张三的新能源汽车" is entered, the directed acyclic graph is:
This is a directed acyclic graph represented in dictionary format. Each word in the input sentence is represented by a value in its corresponding position, forming the “key” of the dictionary. The “value” corresponding to each “key” is the position of the last word that can be formed into a word. For example, 0: [0] means “张” can only be combined into “张”, 3 [3, 5]: means “新” can be combined into “新” or “新能源”. Therefore, the directed acyclic graph obtained from the sentence “张三的新能源汽车” has six paths.
4) Find the maximum probability path
Since there are multiple paths, it is necessary to find an optimal path from them. The jieba library uses a dynamic programming approach to find the maximum probability path on the directed acyclic graph to be the final path. By predicting the probability of each candidate path, the path with the highest probability is selected as the final path. The specific formula is as follows.
Where “i” represents the different paths, “j” is the word splitting scheme for path “i”, and the probability “p” for each word is the word frequency divided by the total word frequency in the statistical dictionary.
Taking “新能源” and “新/能源” as examples, we need to compare the probabilities of
The value of
5) Handling Out-of-vocabulary
Out-of-vocabulary is the words that do not appear in the dictionary but should be split out. Although the statistical dictionary of jieba library contains hundreds of thousands of words, there are still many words that are not included in it, especially some names of people and places. If the word splitting is based on the dictionary only, many words will be missed. For example, in the sentence “张三的新能源汽车”, “张三” as a person’s name should be split into one word, but since the word “张三” is not in the dictionary, so “张三” is split into two words.
For such Out-of-vocabulary, the jieba library provides the option to use a Hidden Markov Model for prediction and the Viterbi algorithm to solve it [24].
The Hidden Markov Model predicts not the entire sentence at the beginning of the input, but a string of consecutive individual word parts that are reassembled after the end of the previous word splitting step. For example, the sentence “张三的新能源汽车” has been split into “张/三/的/新能源/汽车” in the previous step. Then, the successive parts of “张/三/的” that have been split into single words are put together and fed into the Hidden Markov Model for prediction.
A hidden Markov model is a probabilistic model of a time series that describes the process of generating a random sequence of unobservable states from a hidden Markov chain, and then generating an observation from each state to produce a random sequence of observations. The sequence of states randomly generated by the hidden Markov chain is called a sequence of states; each state generates an observation, and the resulting random sequence of observations is called a sequence of observations, and each position of the sequence can be regarded as a moment.
The Hidden Markov Model is determined by the initial probability distribution, the state transfer probability distribution and the observation probability distribution. It contains the following five elements.
1. The set of state values
2. The set of observations
3. Transfer probability matrix
4. Observation probability matrix
5. The initial state probability vector
Usually, the Hidden Markov Model can be expressed as
1. Probability calculation problem.
Given a model λ and an observation sequence O, calculate the probability P(O|λ) of the occurrence of the observation sequence O.
2. Learning problem.
Knowing the observation sequence O, estimate the parameters of the model λ such that the probability of the observation sequence P(O|λ) is maximized.
3. The prediction problem.
Knowing the model λ and the observation sequence O, find the state sequence I that maximizes the conditional probability P(I|O) for the given observation sequence. i.e., given the observation sequence, find the most probable corresponding state sequence.
Among them, word splitting is mainly concerned with the prediction problem.
In the jieba library, the transfer probability matrix A, the observation probability matrix B and the initial state probability vector π of the Hidden Markov Model are parameters that have been trained and can be used directly. The set of state values Q is set to {B, E, M, S}, i.e., it contains four states, which denote the beginning, end, middle and independent characters of the word, respectively. The observation sequence is a Chinese sentence. For example, the sentence “张三的新能源汽车” is the observation sequence, and the state sequence predicted by Hidden Markov Model is “BESBMEBE”, then the result of word separation is “张三/的/新能源/汽车”.
In fact, the prediction problem can be expressed as follows: for the string
By definition, the recurrence formula can be written as:
Define the “t-1”th node of the path with the highest probability among all individual paths with state “I” at moment t as:
By initializing
By the above five steps, the original text can be split into words. However, splitting into words in this way also creates problems. New energy vehicles have their own dictionary of nouns, and some of them will be separated if they are split according to the common word splitting logic. For example, the word “充电桩” will be split into “充电” and “桩”. To solve this problem, it is necessary to create a dictionary of new energy vehicle terminology. This will ensure that the term is not be split.
In addition, there are some words that are not needed for the word cloud generation, such as tone words. These words can be filtered out by setting them as stop words. By this setting, we can get a more suitable word cloud.
There are three main methods that can be used for text sentiment analysis. Sentiment analysis based on sentiment dictionary, sentiment analysis based on machine learning and sentiment analysis based on deep learning. From the current development, among these three methods, the deep learning-based sentiment analysis method works best and has the highest accuracy rate.
Deep learning for sentiment analysis is now a state-of-the-art approach. Deep learning is actually a subset of machine learning, which is an application of multilayer neural networks. The basic structure of a neural network is an input layer, a hidden layer, and an output layer. Each neuron in the input layer can be used as a feature of an object, the hidden layer can have one or more layers, which transforms the input into something that can be used in the output layer, and the output layer transforms the result of the hidden layer into the desired result.
Among the deep learning methods, there are also many models that can be chosen, such as TextCNN, LSTM, BiGRU, etc. However, after the emergence of pre-trained language models, their effect of sentiment analysis is significantly better, so they become the most cutting-edge methods in the field of sentiment classification now. The latest pre-trained models include ELMo, Bert, XL-NET, ALBERT, etc.
In 2019, HIT and IFLYTEK jointly released the Chinese Bert-wwm-ext pre-training model. This model is based on an improvement of Bert. The Bert-wwm-ext pre-trained language model is able to leverage the language prior knowledge learned during unsupervised pre-training and transfer it to downstream natural language processing tasks during fine-tuning. This model was chosen since it is one of the most effective models nowadays.
1) Bert-wwm-ext model structure
The Bert-wwm pre-trained language model consists of an Embedding layer and a Transformer layer, as shown in Figure 1.
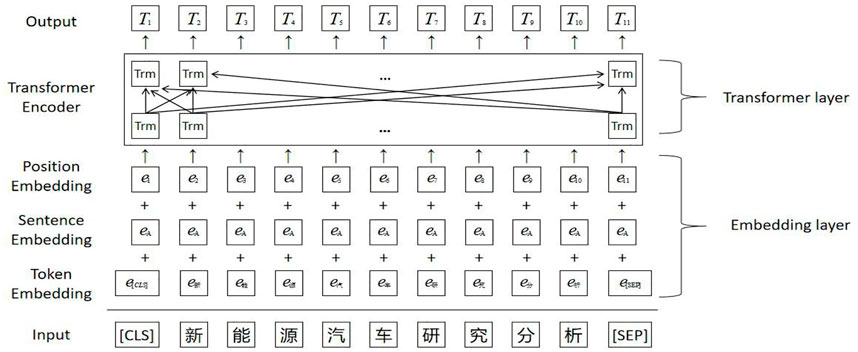
FIGURE 1. Bert-wwm-ext model.
The beginning of each sentence is [CLS], and [SEP] is the segmentation mark, which is placed at the end of each paragraph. The input sentence of the model is defined as
In the Embedding layer, the input vector “e” is obtained by summing the Token Embedding vector, the Sentence Embedding vector and the Position Embedding vector. The Token embedding vector is a static encoding of the word, and the Sentence Embedding vector represents the sentence to which the word belongs. The Position Embedding vector represents the location information of the word [25].
In this model, the Transformer layer is its main framework, which consists of multiple Transformer Encoders [26]. Among them, the structure of a single encoder is shown in Figure 2.
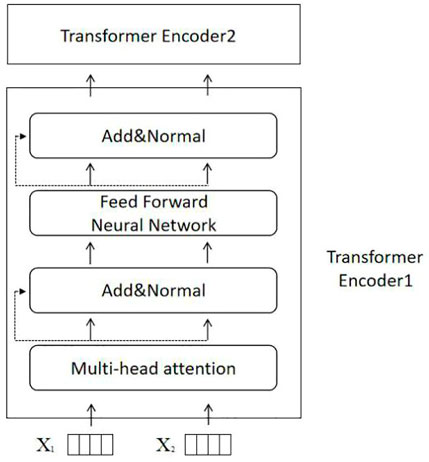
FIGURE 2. Transformer encoder.
The structure of the Transformer Encoder has four layers: the first layer is a multi-head self-attention mechanism, the second and fourth layers are residual connection and normalization, and the third layer is a position-wise fully connected feed-forward network.
1. Multi-Head Attention layer
The main idea of multi-head attention is to adjust the weight of a word by calculating the association between words, reflecting the interrelationship between the word and all words in this sentence and the importance of each word. After the input sequence X enters the first layer, three matrices Q, K, V will be obtained by linear transformation, which is calculated as:
Where
Where
2. Residual connection and normalization layer
There are two main operations done in this layer. The first operation is the residual connection, which adds up the input X of the previous layer and the output
The second operation is Layer Normalization, which normalizes the hidden layers in the neural network to a standard normal distribution. The formula is:
Where
3. Position-wise fully connected feed-forward network layer
At this layer, two linear transformations are done to the matrix and then activated with the activation function. Usually, the activation function uses the ReLU function.
where the ReLU function is given by
2) Bert-wwm-ext pre-trained model task
The Bert-wwm-ext pre-training process consists of two unsupervised tasks: the masked language model (MLM) task and the next sentence prediction (NSP) task.
The masked language model can improve the generalization ability of the model to sentences and feature representation ability. In the original Bert model, the masked language model randomly masks 15% of the words in the input sequence, and the masked words have an 80% probability of being replaced with the symbol [MASK], a 10% probability of being replaced with any other word, and a 10% probability of remaining the original word. This allows the model to guess what the masked word is from the context, thus capturing the deeper meaning of the text. The details are shown in Figure 3.
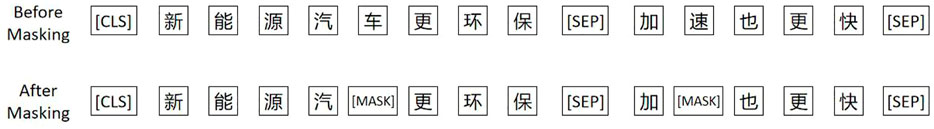
FIGURE 3. Masked language model of Bert.
In the Bert-wwm-ext model, this approach is improved. If a partial subword of a complete word is masked, other parts of the same word are also masked [27]. as shown in Figure 4.
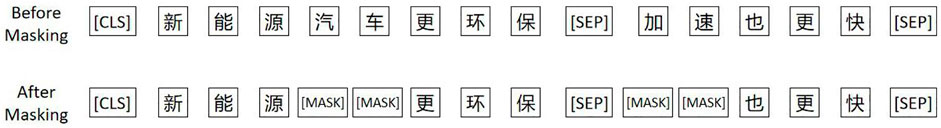
FIGURE 4. Masked language model of BERT-wmm-ext.
The next sentence prediction task is to predict whether a sentence is the next sentence of another sentence. The next sentence prediction task allows the model to capture the relationship between sentences and sentences. Specifically, the model will randomly select sentence A from the corpus, then obtain its next sentence B, and then replace sentence B with sentence C in the corpus that is unrelated to A with 50% probability. During training, the final input corresponding to the special token [CLS] will be used as a representation of the two sentences to determine whether the two sentences are related. The details are shown in the following Figure 5.
3). Bert-wwm-ext model for classification task training
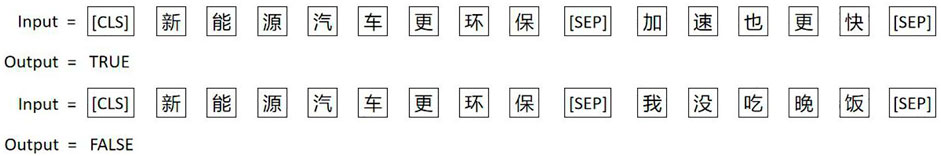
FIGURE 5. Next sentence prediction task.
The pre-trained model can be used in downstream natural language processing tasks. By fine-tuning the Bert-wwm-ext model, it can be made applicable to a variety of different natural language processing tasks.
In this paper, the model is updated with relevant parameters by retraining on a specific word-of-mouth review dataset, which allows the model to obtain better text classification results. Compared with the traditional method, the application of fine-tuning can reduce the hardware cost and time cost to a great extent because the pre-training does not have to be turned on again.
a. Data cleaning and labeling
In the word-of-mouth reviews crawled in this paper, there are 11 fields of consumer evaluations. Among them, the “most satisfied point” and “least satisfied point” fields can be interpreted as labeled data. The “most satisfied point” indicates a positive emotional tendency and is represented by “1”, with a total of 73,322 data. The “least satisfied point” indicates the negative affective tendency and is represented by “0”, with 73,322 data. Thus, a total of 146,644 data were obtained to fine-tune the model.
b. Standardization of sentence length
Due to the different lengths of the word-of-mouth review texts, the sentence lengths were standardized to make all reviews of the same length before inputting them into the model. The average length of the “most satisfied point” and “least satisfied point” comments is 108 and the maximum length is 2,677. Because of the computation time and computer performance, the text fields cannot be unified into 2,677 length units. After experiments, the final choice is to unify the text length to 256 words. This field length covers 93% of the text data. If the text comment exceeds 256 words, the subsequent text is truncated; if the text comment is less than 256 words, the length is made up to 256.
c. Dividing the training set and test set
The ratio of training set and test set belongs to one of the hyperparameters of the model, and the division ratio chosen in this paper is 8:2, with 80% of the data as the training set of the model and 20% of the data as the test set of the model. This is a commonly used partition ratio in deep learning.
d. Optimizer settings
The goal of deep learning is to fit the output by continuously changing the network parameters so that the parameters can perform various nonlinear transformations on the input data, which is essentially a process of finding the optimal solution to a function. One of the algorithms for updating the parameters is called an optimizer, which can be trained to optimize the parameters to minimize the loss function. The loss function is a function used to calculate the degree of deviation between the true and predicted values in the test set. The smaller the loss function is, the better the model effect is.
The optimizer chosen for this model is Adam. The Adam algorithm is one of the most popular optimizers in the field of deep learning at present. Its mathematical formula is as follows.
Initially,
e. Classification training using [CLS]
Due to the existence of attention mechanism, the information of each token is gathered into [CLS] when the model operates, so the role of [CLS] in the Bert-wwm-ext model is not only to mark the beginning of a sentence, but also to store the basic information of a sequence. Therefore, after doing linear transform and softmax transform on the output vector of the last layer of [CLS], it can be compared with the labels of text data for classification training.
f. Model Evaluation
The commonly used evaluation metrics in classification tasks are: accuracy, precision, recall, F1-Measure, etc. The accuracy metric is chosen for this evaluation. The accuracy is the most intuitive evaluation metric, which is evaluated by the ratio of correctly classified data to the total data volume. The calculation method is:
Among them, TP denotes the number of samples that are actually positive and predicted to be positive; TN denotes the number of samples that are actually negative and predicted to be negative; FN denotes the number of samples that are actually positive and predicted to be negative; and FP denotes the number of samples that are actually negative and predicted to be positive.
By verifying the model effect on the test set, the final text classification accuracy obtained in this paper is 98.93%. Compared with traditional machine learning algorithms and deep learning algorithms such as LSTM, the effect of Bert-wwm-ext model is undoubtedly much better.
g. Sentiment classification for other fields
The trained model can predict the sentiment of eight dimensions of word-of-mouth reviews: space, power, control, endurance, comfort, exterior, interior, and cost performance. The text labels with positive sentiment are saved as 1 and those with negative sentiment are saved as 0. The final text data with sentiment labels can be obtained for subsequent data analysis.
In this paper, we plot the word cloud of the “Reasons for choosing this car” field by year to show the factors that consumers value in purchasing new energy vehicles. Since the word cloud for each year contains the word “new energy” and is the largest word in the word cloud, the word “new energy” is placed in the stop words table to highlight other information. In addition, since brand analysis is not done here, the brands of cars are also filtered out. For example, brands such as “BYD”, “NIO” and “Tesla” were put into the stop words table. Based on the collected data, a word cloud was drawn for the 9 years from 2014 to 2022. The words in the word cloud are translated into English to obtain Figure 6.
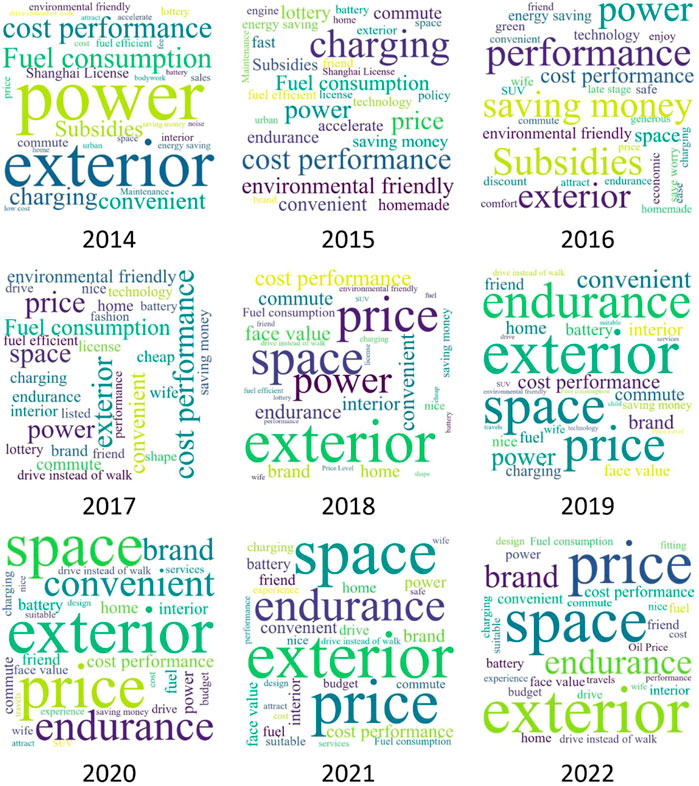
FIGURE 6. “ Reasons for choosing this car” Word Cloud.
The sales of new energy vehicles in China have been in an upward phase. In 2017 and before, the sales of new energy vehicles in China were within 1 million units, and from 2018 onwards, the sales of new energy vehicles in China exceeded 1 million volumes. If we divide by sales volume, 2017 and the years before it can be called the early years of new energy vehicle development. And starting from 2018, new energy vehicles are gradually accepted by the majority of consumers and become one of the main options for purchasing cars. So, we can use 2017 and 2018 as the dividing point to see the changes that have occurred in the word cloud.
According to what the word cloud shows, there is a big difference between the concerns of early consumers and those of recent years for new energy vehicles.
In the early years, consumers were more concerned about “power”, “cost performance”, “saving money” and “subsidies”.
“Power” is the biggest difference between new energy vehicles and fuel cars. Compared with traditional fuel cars, new energy vehicles have a faster start and better power. Early consumers can easily feel this difference in driving. However, with the gradual popularity of new energy vehicles, consumers’ concern for power has significantly decreased. In the 9 years from 2014 to 2022, the frequency of the word “power” was ranked first, third, fourth, fifth, fourth, sixth, eighth, eighth and eighth. This indicates that consumers have gradually become accustomed to the power of new energy vehicles.
The three indicators of “cost performance”, “saving money” and “subsidies” can be viewed together. In the 9 years from 2014 to 2022, the ranking of cost performance in the word frequency is third, second, sixth, first, fifth, seventh, seventh, fifth, and sixth. The ranking of saving money in the word frequency is 23rd, 13th, third, 18th, 15th, 18th, 27th, 36th and 38th. Although there are some fluctuations, it can be seen that the importance of these two fields has been decreasing over time. For subsidies, the frequency ranking in the 5 years from 2014 to 2018 is seventh, 12th, second, 31st, and 44th in order. After 2019, the word subsidies no longer enter the top 50 words in terms of frequency. These three indicators show that early new energy vehicles are greatly influenced by policies, and consumers are more likely to be influenced by policies and choose new energy vehicles with strong subsidies.
In addition to these indicators, early consumers were more concerned about the indicator of “environmental friendly”. In the 7 years from 2014 to 2020, the frequency of environmental friendly was ranked ninth, fifth, eighth, eighth, 16th, 21st, and 39th in order. In 2021 and 2022, the word does not enter the top 50 words in terms of frequency. This shows that early consumers of new energy vehicles pay more attention to green consumption, and the concept of environmental protection is one of the reasons for them to buy new energy vehicles. In recent years, consumers’ concern for environmental protection has begun to decline, which indicates that the quality of new energy vehicles has improved, making those consumers who are not concerned about environmental protection willing to choose new energy vehicles for quality reasons.
In the period from 2018 to 2022, the indicators that consumers are most concerned about new energy vehicles are “exterior”, “space”, “endurance”, “price” and “brand”.
In the 4 years from 2014 to 2017, exterior ranked second, 19th, fifth, and third in word frequency. After 2018, the word exterior ranked first in word frequency for all of them. In the 9 years from 2014 to 2022, space ranked 16th, 25th, seventh, fourth, third, second, third, second, second, and second in word frequency. This means that for “exterior” and “space”, consumers were also more concerned about these two indicators in the early stage. But in recent years, the concern has increased significantly, which shows that consumers have paid more attention to the quality of new energy vehicles in recent years.
In 2014, endurance was not in the top 50 in word frequency, and from 2018 to 2022, endurance ranked 10th, 20th, 10th, seventh, third, fourth, fourth, and fourth in word frequency. “Endurance” is the core indicator of new energy vehicles, and the word cloud shows that consumers hardly choose new energy vehicles because of “endurance” in the early years, but now “endurance” is one of the reasons consumers choose new energy vehicles. This shows that the endurance of new energy vehicles was poor in the early days, but now the endurance of new energy vehicles is gradually recognized by consumers.
“Price” is an important reason for consumers to purchase goods. In fact, both before 2017 and after 2018, consumers were concerned about price. However, consumers have become significantly more concerned about price in recent years. From 2018 to 2022, price ranked 10th, fourth, 27th, second, second, fourth, second, third and third in word frequency. As a comparison, earlier consumers were more concerned about the indicators associated with car subsidies rather than the price of the car itself. This change indicates that as the amount of subsidies has declined in recent years, consumers have become more concerned about price itself.
“Brand” is one of the most important reasons for consumers to choose new energy vehicles in recent years. In 2014, brand was not in the top 50 in word frequency, and from 2015 to 2022, brand ranked 26th,31st, 13th, 11th, eighth, sixth,sixth, and fifth in word frequency. It takes time for brands to form. At the early stage of the development of new energy vehicles, strong brands have not yet been formed, and it is difficult for consumers to choose a suitable new energy vehicle by brand. Therefore, the frequency of consumers mentioning brands in their comments on why they choose new energy vehicles in the early stage is very low. After several years of development, some famous brands have gradually appeared in the new energy vehicle market, and consumers are paying more and more attention to the brands. In recent years, the frequency of brand has been in the top ten of the reasons why consumers choose new energy vehicles, and the trend has been increasing. This shows that consumers are now more willing to choose new energy vehicles by the merits of the brand than before.
Using the text data with labels obtained from the model, the sentiment tendency can be calculated for the eight dimensions of word-of-mouth reviews by year. For each dimension, the ratio of its positive sentiment review volume to the total review volume for each year is calculated to obtain the overall sentiment evaluation score of the consumer for that dimension for that year, which is between 0 and 1. The results of the calculation are presented in Table 1.
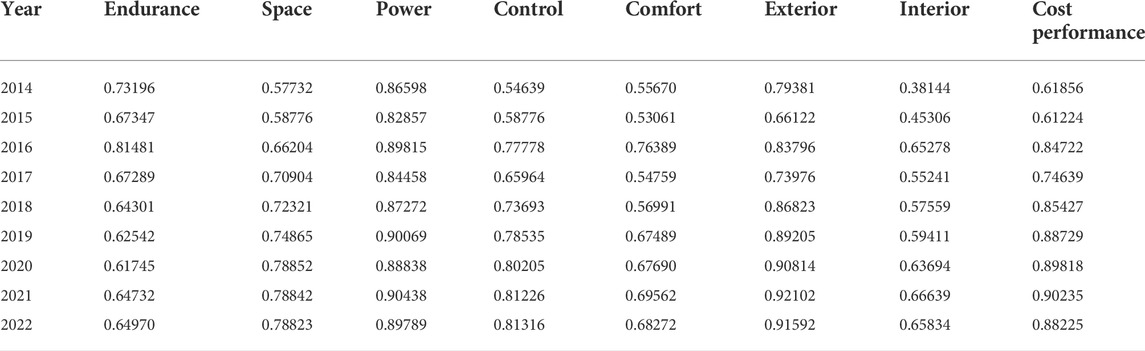
TABLE 1. Emotional scores in eight dimensions.
Based on the results obtained from the calculations, it is possible to map the evolution of emotions in eight dimensions.
As can be seen in Figure 7, most of the indicators have a large variation until 2017; after 2017, the trend of the curve is flatter. This reason is mainly due to the size of the data volume. The data volumes for the 9 years from 2014 to 2022 are 97, 245, 216, 1,660, 4,227, 7,985, 11,235, 27,640, and 20,017, respectively. The small data volumes for the earlier years result in indicators that are more susceptible to individual consumer influence. To better observe the trend, the data from 2014 to 2017 can be combined. As shown in Figure 8.
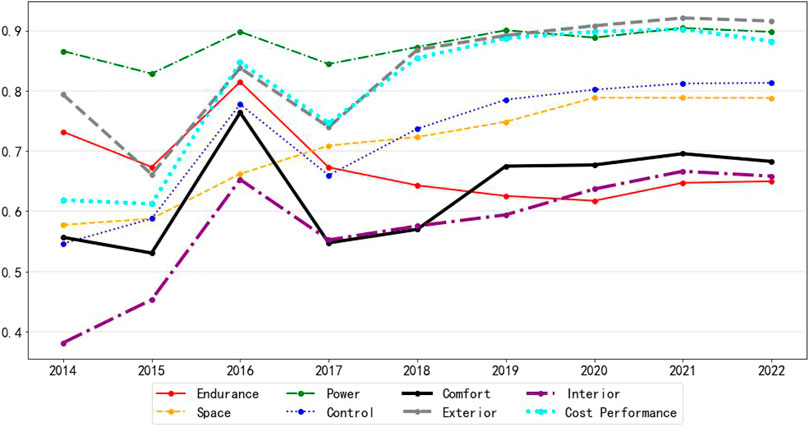
FIGURE 7. 2014–2022 emotional trend chart.
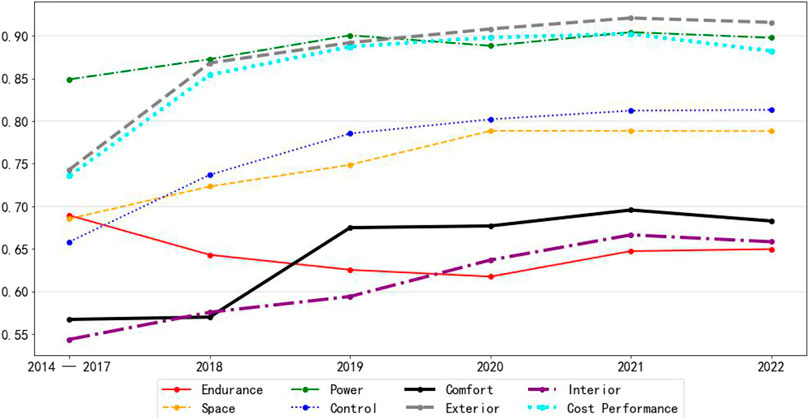
FIGURE 8. 2014–2022 emotional trend chart 2
As can be seen, after combining the data from 2014 to 2017, the curve is smoother than before. From the graph, for the five indicators of power, exterior, cost performance, control and space, the overall evaluation of consumers shows an upward trend, and from 2019 onward, consumers’ emotional scores for these five indicators are basically above 0.75. Among them, the exterior, power and cost performance are about 0.9.
For the two indicators of comfort and interior, consumers’ sentiment scores also show an upward trend. However, until 2022, the scores of these two indicators are still low, not reaching 0.7. This indicates that in the future, these two dimensions have more room for improvement.
For the score of the indicator of endurance, it is in a decreasing trend until 2020, and in 2021 and 2022, although there is a slight increase, the overall trend is still decreasing. Moreover, this indicator is the lowest rated among all indicators.
However, according to what the word cloud shows, the endurance of new energy vehicles has been gradually recognized by consumers in recent years. This contradiction indicates that the endurance indicator is highly polarized in consumers’ evaluation. Some consumers believe that the endurance of new energy vehicles has met their needs, while others believe that the endurance of new energy vehicles still needs to be improved.
For new energy vehicles, the current mainstream models are divided into three types: Battery Electric Vehicle (BEV), Plug-in Hybrid Electric Vehicle (PHEV), and Range Extended Electric Vehicle (REEV). The development of BEV can effectively relieve the pressure of energy and environment. The development of PHEV and REEV is an important path for the transition from traditional fuel vehicles to BEV. At present, PHEV and REEV are in a booming stage of development in China, and PHEV and REEV have various advantages such as high energy-saving potential, moderate cost, high market acceptance, and environmental friendliness. Therefore, for a period of time, both PHEV and REEV will continue to play an irreplaceable and important role in the transition to vehicle electrification. By clustering the data, we obtained 39,395 items of BEV, 8,447 items of PHEV, 24,829 items of BEV/PHEV, 485 for REEV and 163 for others. Among them, BEV/PHEV means that there are both BEV and PHEV of this type of vehicle. Since the amount of data for REEV is too small, we do not analyze them. The main analysis is on BEV and PHEV. Figure 9 and Figure 10 show the sentiment of BEV and PHEV, respectively.
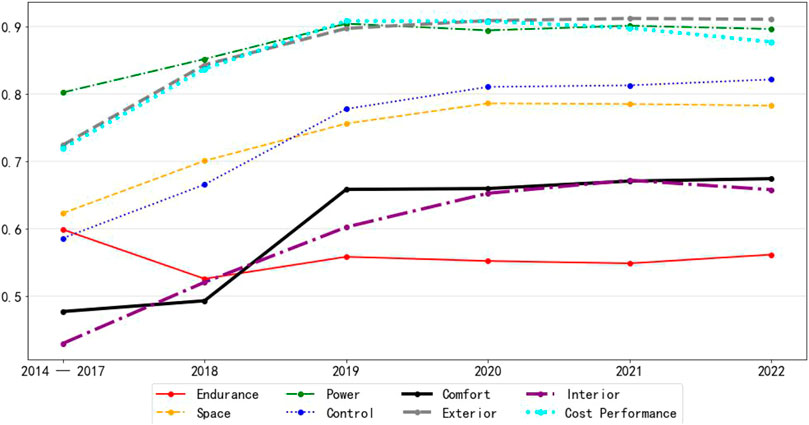
FIGURE 9. 2014–2022 emotional trend of BEV
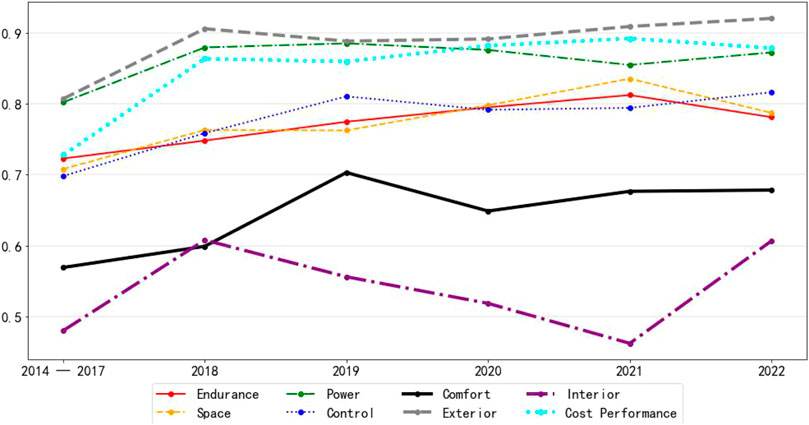
FIGURE 10. 2014–2022 emotional trend of PHEVs.
As you can see from the graph, most of the indicators of the two charts have basically the same emotional trend. Only the two indicators of interior and endurance have a big difference.
For the indicator of interior, the sentiment score of BEV shows a gradual upward trend, while PHEV has a significant downward trend from 2018 onward, and only turns upward in 2022. However, from an overall perspective, both BEV and PHEV do not have high scores for this indicator of interior. It shows that the interior is the overall problem of new energy vehicles.
For the indicator of endurance, the sentiment score for BEV basically stays the same after slipping from near 0.6 in the early years to around 0.55. Moreover, from 2019 onward, this indicator has the lowest score of all indicators. As a comparison, the endurance score for PHEV has a gradual upward trend, reaching near 0.8 in recent years. From here, we can see that PHEV do not actually have an endurance problem. Endurance is only an issue for BEV.
To see the difference more clearly, the scores of the eight indicators for BEV and PHEV can be drawn in a radar chart. As you can see in Figure 11, endurance is the biggest difference between BEV and PHEV. Consumers still have greater dissatisfaction with the endurance of BEV.
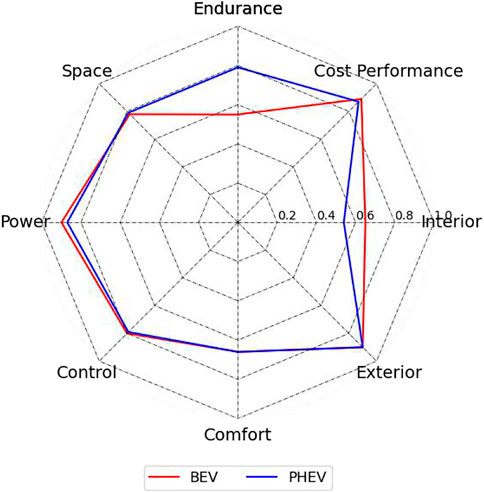
FIGURE 11. A comparative radar chart of BEV and PHEV
With the development of the new energy vehicle industry in recent years and the advancement of battery technology and infrastructure such as charging piles, new energy vehicles have seen a major improvement in both battery range and ease of charging. In the data obtained in this paper, the battery range field of the model is included. In this field, 1.6% of the data take the value of null, and 98.4% of the data can be extracted to the battery range of the car. Extracting the data of BEV whose battery range is not null and clustering them by year to find the average, we can obtain Table 2.

TABLE 2. The battery range of BEV in 2014–2022.
From Table 2, we can see that the average battery range of BEV is increasing from 2014 to 2022, and the range in 2022 is already 3.3 times higher than that in 2014. However, consumers’ battery range ratings for pure electric vehicles have not risen, but have declined compared to earlier ratings, indicating that consumers’ requirements for battery range are also rising.
According to China’s subsidy policy and the development trend of new energy vehicles, BEV is the main development direction of new energy vehicles in the future. Therefore, improving the range of BEV is the most important aspect of developing new energy vehicles.
In order to study the consumer evaluation of different brands of new energy vehicles, the data needs to be further processed.
In the raw data, the price of the car in each data was obtained by data pre-processing. Since the prices of different brands of new energy vehicles vary greatly, the price corresponding to a certain brand of car needs to be obtained in some way. The approach taken in this paper is to average the prices of all cars of a brand appearing in the data, and the value obtained represents the price corresponding to that car brand. In addition, the sentiment scores of the eight dimensions of each brand of car are obtained by averaging all the data of the brand. Finally, the average sentiment score of consumers for each brand of new energy vehicles is obtained by averaging the scores of the brands on the eight dimensions.
New energy vehicle brands with an evaluation volume of more than 100 can be selected, and eight scatter plots are drawn with the average price of the brand as the horizontal coordinate, the sentiment scores of the eight dimensions as the vertical coordinate, and the data volume of each brand as the sample point size.
As seen in Figure 12, for the four indicators of power, exterior, cost performance and control, there is no significant difference between brands at different prices. For the two indicators of endurance and comfort, the increase in price did not bring an increase in consumer evaluation, but rather a decline. For the two indicators of interior and comfort, they can be divided into two parts with a price of 400,000. Each of these two parts has an emotional rating that rises as the price rises. However, there is no gap between the ratings of these two parts. These indicate that consumers who buy premium new energy vehicles are more critical of the cars’ evaluations.
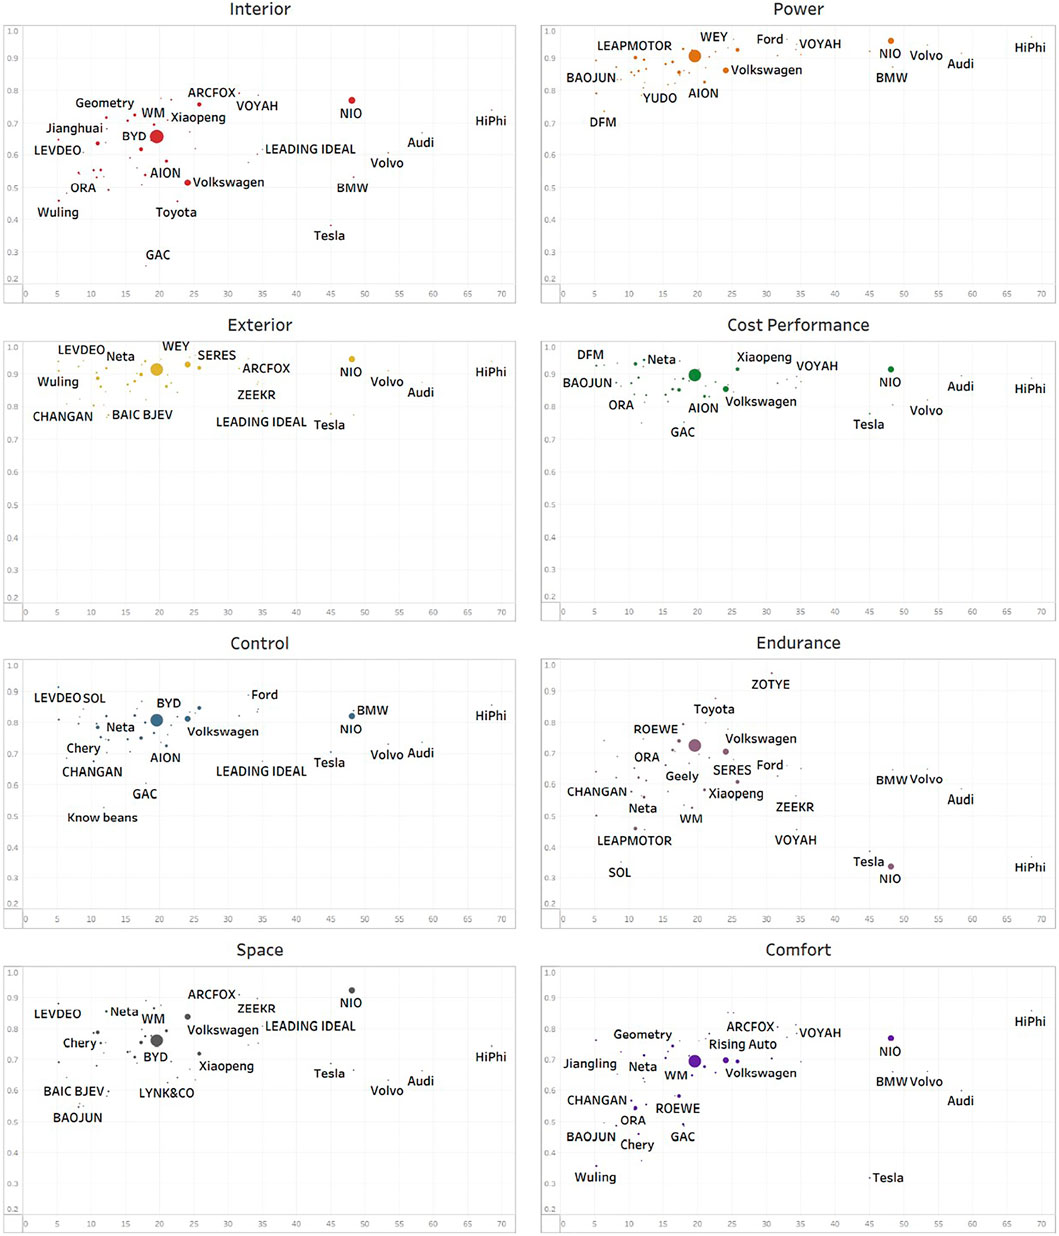
FIGURE 12. The eight-dimensional emotional distribution map of different brands of cars.
In order to further understand consumers’ comprehensive evaluation of different new energy vehicle brands, we can take the car brands with more than 100 word-of-mouth reviews, take the average price of the brand as the horizontal coordinate, the average of consumers’ eight emotional scores of each brand as the vertical coordinate, and the data volume of each brand as the sample point size to draw a scatter plot.
According to what is shown in Figure 13, it can be found that most of the new energy vehicle brands are located in the price range of RMB80,000 to RMB350,000. In this range, as the price rises, the average sentiment score of consumers shows a more obvious upward trend. This indicates that as the price rises, the quality of new energy vehicles also rises and is more likely to be recognized by consumers.
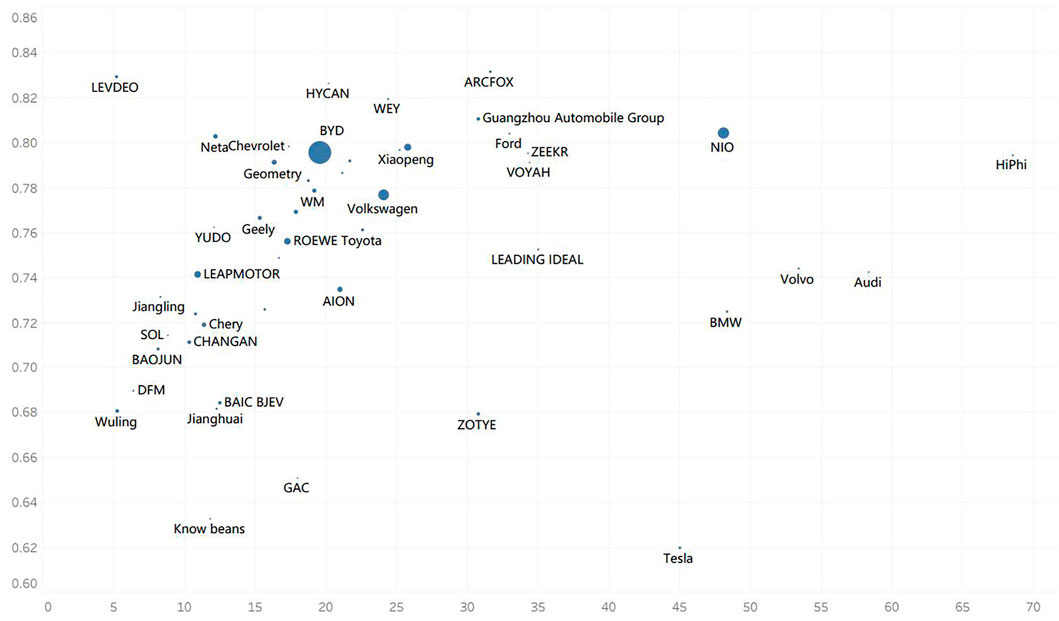
FIGURE 13. Distribution map of the average sentiment score of different brands of cars.
However, among new energy vehicle brands with prices over RMB350,000, they do not show the same trend. This shows that compared to ordinary new energy cars, there is no significant rise in quality for high-priced new energy cars.
BYD is the mainstream brand in the new energy vehicle market. Other new energy vehicle brands have a precipitous gap in the amount of word-of-mouth review data compared to BYD. BYD is in the mainstream price range of new energy vehicles and has a relatively high overall rating, making it the most recognized brand in the market. NIO is the premium brand of new energy vehicles in China and has the highest consumer rating score among all new energy vehicle brands priced over RMB350,000, which shows that our premium new energy vehicle brand has been recognized by consumers. Chinese brands BYD and NIO already have the characteristics of strong brands in the new energy vehicle market, but the head effect of Chinese brands is significant.
In terms of brand, Tesla, the world’s most well-known brand of new energy vehicles, has the lowest sentiment score. This indicates that Tesla has formed a strong brand with a high brand premium. In addition, compared to Chinese brands, foreign brands, such as Tesla, BMW, and Audi, they already have a very high reputation and reputation, and they have strong brand premium capabilities.
This study investigates new energy vehicle selection through complex neural network models, data mining, and deep learning, and also analyzes the positioning of domestic and foreign new energy vehicle brands and their brand development from the perspective of complex networks. Through theoretical analysis and empirical research, this paper obtains the following main conclusions.
1) Through word cloud analysis, we can find that the reasons why consumers choose to buy new energy vehicles are gradually changing. Consumers in the early stage are more willing to choose new energy vehicles because of the advantages of cost performance and subsidy benefits; Consumers in the later stage pay more attention to the exterior, space and other indicators of new energy vehicles. This shows that consumers are paying more and more attention to the quality of new energy vehicles.
2) From the analysis of emotional evolution, it is found that consumers’ evaluation of the power of new energy vehicles has always been high, which is determined by the characteristics of new energy vehicles. Consumers’ evaluation of the six indicators of exterior, space, control, cost performance, comfort and interior of new energy vehicles is increasing, which indicates that the quality of new energy vehicles is gradually recognized by consumers. Among these indicators, the overall evaluation of comfort and interior is relatively low, which indicates that there is still much room for improvement in these two indicators.
3) Through word cloud analysis, it is found that consumers are more willing to choose new energy vehicles in recent years due to their endurance. However, the sentiment evolution analysis reveals that consumers’ evaluation of the endurance of new energy vehicles is on a downward trend, and the evaluation is low. This phenomenon shows that consumers’ evaluation of the endurance of new energy vehicles is polarized. A part of consumers gradually recognizes the endurance of new energy vehicles, while another part of consumers is not satisfied with the endurance of new energy vehicles.
4) The comparative analysis of BEV and PHEV reveals that consumers’ ratings of both types of vehicles are roughly comparable, but the gap in satisfaction with the endurance of both types of vehicles is pronounced. Consumers rated the range of PHEV higher, and rated the range of BEV very low.
5) The word cloud analysis shows that consumers are more concerned about the brand of new energy vehicles in recent years. The brand analysis reveals that most brands of new energy vehicles are concentrated in the price range of RMB80,000 to RMB350,000, and within this range, consumer ratings are positively correlated with the price of the car. In the brands of new energy vehicles over RMB350,000, consumer ratings do not increase with the price of the vehicle.
6) The brand analysis reveals that domestic manufacturer BYD’s new energy vehicles are moderately priced and have high overall consumer satisfaction, making it the most mainstream new energy vehicle brand in the market. In the field of high-end new energy vehicles over RMB350,000, the domestic manufacturer Azera has the highest rating and is the mainstream choice for consumers to buy high-end new energy vehicles. Foreign brands have formed strong brands with high brand premiums.
Compared with previous studies, this study has some innovations, such as the use of Bert-wwm-ext model structure, which is more accurate compared with traditional machine learning algorithms and deep learning algorithms such as LSTM. In addition, this paper discusses the development status of BEV and PHEV from the perspective of consumers, as well as the development status of new energy vehicle brands at home and abroad, to provide a referable path for the development direction of new energy vehicles.
Of course, there are some shortcomings in this study, such as this study is based on the data of the largest professional automotive communication platform in China, and the data classification is according to the existing classification of the platform, so the mined data may not reflect the relevant variables comprehensively. In addition, this study focuses on the selection of new energy vehicles under complex networks, but does not compare fuel vehicles and new energy vehicles [28–30].
The data used to support the findings of this study are available from the corresponding authors upon request.
All authors listed have made a substantial, direct, and intellectual contribution to the work and approved it for publication.
The authors acknowledge the financial support from the National Social Science Fund of China (no. 19BH156), and Innovation Project of The University of Chinese Academy of Social Sciences.
The authors declare that the research was conducted in the absence of any commercial or financial relationships that could be construed as a potential conflict of interest.
All claims expressed in this article are solely those of the authors and do not necessarily represent those of their affiliated organizations, or those of the publisher, the editors and the reviewers. Any product that may be evaluated in this article, or claim that may be made by its manufacturer, is not guaranteed or endorsed by the publisher.
1. Mock P, Yang Z. Driving electrification: A global comparison of fiscal incentive policy for electric vehicles. Exp. Physiol. (2013) 98(98): 1244–1246. doi:10.1113/expphysiol.2012.068940
2. Hill G, Heidrich O, Creutzig F, Blythe P. The role of electric vehicles in near-term mitigation pathways and achieving the UK’s carbon budget. Appl Energ (2019) 251:113111. doi:10.1016/j.apenergy.2019.04.107
3. Li G, Luo R, Zhang H. The impact of promotion policies on the demand for new energy vehicles: Evidence from city and model level sales data. J Shanghai Univ Int Business Econ (2019) 26(02):49–58+68. doi:10.16060/j.cnki.issn2095-8072.2019.02.005
4. Diamond D. The impact of government incentives for hybrid-electric vehicles: Evidence from US states. Energy Policy (2008) 37(3):972–83. doi:10.1016/j.enpol.2008.09.094
5. Liu Y, Kokko A. Who does what in China’s new energy vehicle industry? Energy Policy (2013) 57:21–9. doi:10.1016/j.enpol.2012.05.046
6. Green EH, Skerlos SJ, Winebrake JJ. Increasing electric vehicle policy efficiency and effectiveness by reducing mainstream market bias. Energy Policy (2014) 65:562–6. doi:10.1016/j.enpol.2013.10.024
7. Jensen AF, Cherchi E, Mabit SL. On the stability of preferences and attitudes before and after experiencing an electric vehicle. Transportation Res D: Transport Environ (2013) 25:24–32. doi:10.1016/j.trd.2013.07.006
8. Xu G, Xu F. Study on the factors influencing the purchase decision of new energy vehicles. China Popul Resour Environ (2010) 20(11):91–5. doi:10.3969/j.issn.1002-2104.2010.11.016
9. Lieven T, Mühlmeier S, Henkel S, Waller JF. Who will buy electric cars? An empirical study in Germany. Transportation Res Part D: Transport Environ (2011) 16(3):236–43. doi:10.1016/j.trd.2010.12.001
10. Hoen A, Koetse MJ. A choice experiment on alternative fuel vehicle preferences of private car owners in The Netherlands. Transportation Res A: Pol Pract (2014) 61:199–215. doi:10.1016/j.tra.2014.01.008
11. Dumortier J, Siddiki S, Carley S, Cisney J, Krause RM, Lane BW, et al. Effects of providing total cost of ownership information on consumers’ intent to purchase a hybrid or plug-in electric vehicle. Transportation Res Part A: Pol Pract (2015) 72:71–86. doi:10.1016/j.tra.2014.12.005
12. Sovacool BK, Abrahamse W, Zhang L, Ren J. Pleasure or profit? Surveying the purchasing intentions of potential electric vehicle adopters in China. Transportation Res Part A: Pol Pract (2019) 124:69–81. doi:10.1016/j.tra.2019.03.002
13. Palmer K, Tate JE, Wadud Z, Nellthorp J. Total cost of ownership and market share for hybrid and electric vehicles in the UK, US and Japan. Appl Energ (2018) 209:108–19. doi:10.1016/j.apenergy.2017.10.089
14. Hidrue MK, Parsons GR, Kempton W, Gardner MP. Willingness to pay for electric vehicles and their attributes. Resource Energ Econ (2011) 33(3):686–705. doi:10.1016/j.reseneeco.2011.02.002
15. Prakash N, Kapoor R, Kapoor A, Malik Y. Gender Preferences for alternative energy transport with focus on electric vehicle. J Soc Sci (2014) 10(3):114–22. doi:10.3844/jssp.2014.114.122
16. Fan R, Dong L, Guo YW, Sun J. Study on the optimal supervision strategy of government low-carbon subsidy and the corresponding efficiency and stability in the small-world network context. J Clean Prod (2017) 168:536–50. doi:10.1016/j.jclepro.2017.09.044
17. Liao F, Molin E, Timmermans H, van Wee B. Consumer preferences for business models in electric vehicle adoption. Transport Policy (2019) 73:12–24. doi:10.1016/j.tranpol.2018.10.006
18. Maheshwari P, Seth N, Gupta AK. An empirical approach to consumer buying behavior in Indian automobile sector. Ind Commercial Train (2016) 48(3):156–62. doi:10.1108/ict-09-2015-0061
19. Mitchell VW, Prince G. Retailing to experienced and inexperienced consumers: A perceived risk approach. West Yorkshire, UK: International Journal of Retail & Distribution Management (1993). doi:10.1108/09590559310042323
20. Akalamkam K, Mitra JK. Consumer pre-purchase search in online shopping: Role of offline and online information sources. Business Perspect Res (2018) 6(1):42–60. doi:10.1177/2278533717730448
21. Van den , Bulte CVD, Wuyts S. Leveraging customer networks in the network challenge: strategy, profit, and risk in an interlinked world. PR Kleindorfer, and Y Wind, Editors. Upper Saddle River, NJ: Pearson Education (2009). p. 243–58.
22. Wachter P, Widmer T, Klein A. Predicting automotive sales using pre-purchase online search datac. Proceeding of the 2019 Federated Conference on Computer Science and Information Systems (FedCSIS). Leipzig, Germany. Sept. 2019. IEEE (2019) 1–4. doi:10.15439/2019F239
23. Liu Y. Word of mouth for movies: Its dynamics and impact on box office revenue. J Marketing (2006) 70(3):74–89. doi:10.1509/jmkg.70.3.74
25. Devlin J, Chang MW, Lee K, Toutanova KB. Pre-training of deep bidirectional transformers for language understanding. In: Naacl (2018). p. 4171–86. doi:10.48550/arXiv.1810.04805
26. Vaswani A, Shazeer N, Parmar N, Uszkoreit J, Jones L, Gomez AN, et al. Attention is all you need. In: Advances in neural information processing systems (2017). p. 5998–6008. doi:10.48550/arXiv.1706.03762
27. Cui Y, Che W, Liu T, Qin B, Yang Z, Wang S, Hu G. Pre-training with whole word masking for Chinese bert (2019). arXiv preprint. doi:10.48550/arXiv.1906.08101
28. Xiong F, Wang X, Pan S, Yang H, Wang H, Zhang C. Social recommendation with evolutionary opinion dynamics. IEEE Trans Syst Man Cybern Syst (2020) 50(10):1–13. doi:10.1109/TSMC.2018.2854000
29. Xiong F, Liu Y, Cheng J. Modeling and predicting opinion formation with trust propagation in online social networks. Commun Nonlinear Sci Numer Simulation (2017) 44:513–24. doi:10.1016/j.cnsns.2016.09.015
Keywords: complex networks, new energy vehicles, data mining, deep learning, natural language processing
Citation: Liu H and Feng L (2022) The study of new energy vehicle choice in China from the perspective of complex neural network. Front. Phys. 10:1015103. doi: 10.3389/fphy.2022.1015103
Received: 09 August 2022; Accepted: 09 September 2022;
Published: 23 September 2022.
Edited by:
Fei Xiong, Beijing Jiaotong University, ChinaReviewed by:
Zhuyin Sui, Yantai University, ChinaCopyright © 2022 Liu and Feng. This is an open-access article distributed under the terms of the Creative Commons Attribution License (CC BY). The use, distribution or reproduction in other forums is permitted, provided the original author(s) and the copyright owner(s) are credited and that the original publication in this journal is cited, in accordance with accepted academic practice. No use, distribution or reproduction is permitted which does not comply with these terms.
*Correspondence: Lei Feng, NTIyMTMxNTY4QHFxLmNvbQ==; Hui Liu, MzA1MTQ1ODU1QHFxLmNvbQ==
Disclaimer: All claims expressed in this article are solely those of the authors and do not necessarily represent those of their affiliated organizations, or those of the publisher, the editors and the reviewers. Any product that may be evaluated in this article or claim that may be made by its manufacturer is not guaranteed or endorsed by the publisher.
Research integrity at Frontiers
Learn more about the work of our research integrity team to safeguard the quality of each article we publish.