 Bo Zhang
 Yushan Zheng1
- 1CNPC, Research Institute of Safety and Environment Technology, Beijing, China
- 2Research Institute of Petroleum Exploration and Development, PetroChina, Beijing, China
- 3Research Institute of Oil & Gas Engineering, Tarim Oilfield Company, PetroChina, Korla, China
- 4CNPC Engineering Technology R&D Company Limited, Beijing, China
- 5Bazhou Branch Company of Xibu Drilling Engineering Company Limited, CNPC, Korla, China
The trapped annular pressure (TAP) caused by thermal expansion is one of the serious challenges for the safe production of a deep gas well. Therefore, this article proposes a model to calculate the temperature profile of the deep gas well based on the heat transfer process and the gas properties. With the help of the temperature model, the TAP in the tubing–casing annulus is analyzed according to the annular fluid distribution and the volume consistence law. The results indicate that the temperature inside the tubing string decreases faster under higher bottom hole pressure. When the tubing–casing annulus is totally filled with the annular protection liquid, the TAP continues increasing with the production rate. Considering the high production rate, the TAP is inevitable and high enough to damage the integrity of the deep gas well. The nitrogen gas mitigates the TAP by reducing the annular liquid volume and providing the extra space to accommodate the thermal-expanded annular liquid. A good mitigation performance can be achieved no matter how large the production rate is. The mitigation performance can be divided into the fast-decreasing stage, the efficient control stage, and the stable stage. These three stages occur as the nitrogen gas column length increases. The compression of the nitrogen gas volume plays a major role in the fast decrease stage while the reduction of the annular liquid plays a major role in the stable stage. For the best cost-effectiveness, the nitrogen gas column is recommended in the efficient control stage and should not exceed 15%.
1 Introduction
Deep natural gas plays an important role in the worldwide energy supply [1] for its high productivity and rich reserves. However, it is also characterized by extreme high temperature and pressure. Taking the Well Luntan-1 in the Tarim Basin as instance, the bottom hole pressure reaches 132 MPa and the bottom hole temperature reaches 178°C while its depth is 8,882 m. Due to the extreme high pressure, the tubing–casing annulus is usually filled with the protection liquid in order to balance the pressure difference [2], so as to avoid the tubing string burst. As a result, the TAP increase after the deep gas well is put into production even if the well integrity is perfect [3], because the annular protection liquid would be heated by the production gas from the high-temperature reservoir [4].
Although the TAP can be eliminated by releasing the thermal-expanded liquid, the cement or the tubing may also be damaged during the pressure rise and releasing process [5, 6], which would lead to the wellbore leakage [7]. Even worse, the tubing or the casing string may deform under the high TAP, just like the casing string in the Well Pompano A-31 [8] and the tubing string in the steam injection well in Canada [9]. Therefore, it is important to avoid the high TAP by taking some suitable control measures. Since the TAP is caucused by the wellbore temperature change, it is the foundation for the TAP control optimization to calculate the wellbore temperature. The available research studies have proved that engineering backgrounds have significant impacts on the calculation of the wellbore temperature [10]. For example, A.R.Hasan and Kabir [11] proposed a dimensionless formation temperature to describe the heat transfer between the wellbore and the formation. Wang et al. [12] calculated the wellbore temperature under the lost circulation. Wang et al. [13] built a model to calculate the deep-water well temperature during the cement operation based on the hydration reaction.
With regard to the deep gas well, the pressure and the temperature are so high that the gas properties would certainly be influenced, which would in turn have an impact on the wellbore temperature. Therefore, the temperature calculation of the deep gas well must consider the coupling relationship between the gas properties, temperature, and pressure. Otherwise, the TAP control may fail the expected goal.
Aiming to get the most optimizing control of the TAP, the various measures have been studied, including the thermal insulation [14], the release of the thermal-expanded liquid, and the increase of annular fluid compressibility [15]. Considering the cost and the operational difficulties, nitrogen gas is regarded as one of the most suitable measures to mitigate the TAP, because it is easy to obtain and not so expensive. More importantly, its control performance has been verified by both theory and experiment. Some classical and recent studies are as follows. Vargo et al. [16] analyzed the control law of the TAP by experiments. A water-based fluid and an oil-based fluid are selected to compare the mitigation performances by injecting the nitrogen gas. The results showed the different changing laws while both had good performances. Sun et al. [17] built a model to calculate the TAP when both gas and liquid exist in the casing annulus of the deep-water well. He showed that the injection volume of the nitrogen gas is one of the key parameters for the successful control. Up until now, nitrogen gas has been applied to control the TAP in the deepwater wells [17] and gas storage wells [18]. However, few researchers study the nitrogen gas applied in the deep gas well to mitigate the TAP in the tubing–casing annulus.
Therefore, this article aims to calculate the temperature profile of the deep gas well. Then, a method is provided to analyze the mitigation performance of the TAP by injection nitrogen gas. To improve the accuracy, the calculation considers the coupling relationship among the temperature, the pressure, and the gas properties. Not only that, the gas compression and the heat transfer are also taken into account to analyze the mitigation performance of the TAP, thus helping to achieve a reliable control performance and prevent well integrity failure, which can provide some support for the long-term safe production of the deep gas well.
2 Methods
2.1 The temperature profile in the tubing string of a deep gas well
2.1.1 Heat transfer of tubing string
The tubing string is the pathway for the high-temperature natural gas flowing from the deep reservoir to the ground. Therefore, the heat transfers from the tubing string to the formation during the production process due to the temperature difference between the natural gas and the nearby formation. To describe the aforementioned process by a mathematical model, the tubing string is divided into many micro units with the length of dz. The aforementioned process conforms to the energy conservation law and the momentum conservation law in a single micro unit, as expressed by Eq. 1:
where p is the pressure, Pa; z is the length of the production string, m; ρf is the density of the natural gas inside the micro unit, kg/m3; g is the gravity acceleration speed, m/s2; θ is the well inclination, °; f is the friction factor between the natural gas and the tubing wall, dimensionless; vf is the flow velocity of the natural gas inside the micro unit, m/s; dtn is the tubing inner diameter, m; Cf is the specific gas capacity of the natural gas inside the micro unit, J/(kgK); Tf is the temperature of the natural gas inside the micro unit, K; wf is the gas mass flow rate, kg/s; Q is the heat flow rate along the wellbore radial direction, J/s.
The friction factor is determined by the flow conditions [19] and fluid rheological properties [20]. It is a key to calculate the pressure drop [21] and can be expressed by Eq. 2 [11]:
where Ra is the roughness of the tubing wall, m; Re is the Reynolds number, dimensionless; and μ is the gas viscosity, Pa s.
The heat flow rate along the wellbore radial direction is expressed by Eq. 3:
where Th is the temperature of the wellbore outer boundary, K; Rto is the heat resistance from the tubing to the wellbore outer boundary, mK/W.
The heat continues transferring to the formation after the heat transfers from the tubing to the wellbore outer boundary, which is an unsteady heat transfer in a cylindrical coordinate system, as expressed by Eq. 4:
where r is the distance from the wellbore center to the formation, m; Te is the formation temperature, K; αe is the formation thermal diffusion coefficient, m2/s; and t is the time, s.
As a differential equation, Eq. 4 can be turned into an equation about the formation temperature by the Laplace transformation with the specific boundary conditions, but the temperature is still difficult to calculate either by the analytic method or the numerical integration. Therefore, the dimensionless formation temperature is introduced to simplify the engineering calculation, which is fitting by the data of the analytic result and has been widely applied in petroleum engineering [22], as expressed by Eq. 5:
where λe is the formation of thermal conductivity, W/(m·°C); TD is the dimensionless formation temperature, dimensionless.
The dimensionless temperature can be calculated by Eq. 6:
where tD is the dimensionless time, dimensionless; rw is the well radius, m。
2.1.2 Impact of temperature and pressure on gas properties
The gas PVT law indicates that both temperature and pressure have an impact on the gas density, as expressed by Eq. 7:
The gas compression factor is also related to temperature and pressure, which can be expressed by Eq. 8 [23]:
where ppr is the pseudo-reduced pressure, dimensionless; Tpr is the pseudo-reduced temperature, dimensionless; γg is the relative density of the production gas, dimensionless.
Following this, the gas-flow velocity can be obtained according to the mass conservation law, as expressed by Eq. 9:
The gas viscosity can be calculated by using the Satlan formula [24], as expressed by Eq. 10
where μ0 is the gas viscosity, Pa s; T0 is the temperature, K; and B is a constant, dimensionless.
2.1.3 Solution method and flow chart
Because of the coupling relationship stated in the aforementioned section, it is hard to get the temperature inside the tubing string directly. To solve this problem, the temperature and the pressure inside the single micro unit can be seen as stable when the length of the micro unit is short enough compared with the depth of the deep gas well. And then, the pressure can be expressed by Eq. 11:
where i is the number of the micro unit, dimensionless; △z is the length of the micro unit, dimensionless; and Tes is the initial formation temperature, K.
Likewise, the temperature of the gas inside the tubing string can be obtained in the same way, as expressed by Eq. 12:
Where, A is a calculation parameter.
Both Eq. 11 and Eq. 12 should be calculated from the well-bottom to the well-head. The initial conditions are expressed by Eq. 13:
where Tfb is the wellbottom temperature, K; pfb is the bottom hole pressure, Pa.
The solving process has five steps. The first step is to start the calculation. The second step is to calculate the temperature and the pressure of the ith micro unit by using the gas properties in the i-1st micro unit. The third step is to recalculate the gas properties by using the temperature and the pressure in the ith micro unit. The forth step is to recalculate the temperature and the pressure in the ith micro unit by using the gas properties obtained in the second step. Following the aforementioned steps, the temperature and the pressure errors are compared. If the errors are acceptable, the calculation is continued to the i+1st micro unit. Otherwise, the calculation is back to the second step until the error is acceptable. The errors are determined by the values obtained from the second step and the forth step, as expressed by Eq. 14:
where E1 is the error of the temperature, dimensionless; E2 is the error of the pressure, dimensionless; Tf2 is the temperature obtained from the second step, K; Tf4 is the temperature obtained from the fourth step, K; pf2 is the temperature obtained from the second step, Pa; pf4 is the temperature obtained from the fourth step, Pa; and EA is the acceptable error, dimensionless.
2.2 The TAP caused by the thermal expansion
2.2.1 Calculation of the TAP
The wellbore temperature would redistribute due to the heat transfer during the production process. As a result, the temperature of the annular liquid increases and the TAP increases due to the thermal expansion of the annular fluid. The volume consistence law can explain the basic mechanism of the TAP [25, 26]. The trapped annulus has very limited volume to accommodate all of the thermal-expanded annular liquid, so the pressure increases to compress the annular liquid in order to keep the volumes of the trapped annulus and the annular liquid equal. As analyzed previously, the TAP is a function about the annular temperature, the annulus volume, and the annular liquid [27], as expressed by Eq. 15:
According to the definitions of the annular liquid isobaric expansion coefficient and the isothermal compressibility, Eq. 15 can be turned into Eq. 16:
where Δpa is the TAP, MPa; α is the annular liquid isobaric expansion coefficient, K−1; kT is the isothermal compressibility, MPa−1;ΔTa is the increase of annular temperature, K; ΔVa is the volume change of the trapped annulus, m3; Vf is the volume of the annular liquid, m3; Va is the volume of the trapped annulus, m3; and ΔVf is the volume of the liquid flowing in or out the annulus, m3.
It can be known that the temperature change of the annular liquid is indispensable to get the TAP. The temperature of the annular liquid can be calculated based on the wellbore radial heat conservation law and the radial heat-resistance distribution, as expressed by Eq. 17:
where Tai is the temperature of the ith annulus, K; Rzro is the thermal resistance of the ith annulus to the wellbore outer boundary, mK/W.
The annular liquid has exchanged the heat adequately with the formation before production, so its initial temperature can be regarded as the formation temperature. As a result, the temperature change of the annular liquid can be calculated by Eq. 18:
The average temperature change of the annular liquid can be obtained by Eq. 19:
where NI is the number of the annulus segment, dimensionless.
2.2.2 Mitigation of the TAP
Different from the sustained annular pressure (TAP) caused by wellbore leakage, the TAP would not rebuild after taking some effective measures, so the server risk caused by the high TAP can be avoided. As stated in the introduction, the nitrogen gas has the great potential to mitigate the TAP. Moreover, nitrogen gas is more feasible to be injected into the deep gas well compared with the deepwater well with the subsea wellhead [28]. After injection, the nitrogen gas gathers as a column above the annular liquid column. To get a clear understanding of the injection volume, the relative length is defined to describe the injection volume of the nitrogen gas. The injection volume can be calculated by multiplying the length to the area of the trapped annulus, as expressed by Eq. 20:
Where, LND is the relative length, %; LN is the length of the nitrogen gas column, m; and LA is the length of the tubing-casing annulus, m.
The nitrogen gas works in two aspects to mitigate the TAP. First is to decrease the volume of the annular liquid. The volume of the annular liquid is equal to the trapped annulus volume when the annulus is fully filled with the annular liquid, as expressed by Eq. 21. The injection of the nitrogen gas changes this situation by sharing the part volume of the trapped annulus, as expressed by Eq. 22. Accordingly, the expansion of the annular liquid is not large as before.
Secondly, the nitrogen gas is easy to compress by the high pressure, so some extra space is available to accommodate the thermal-expanded annular liquid, which is called the volume compensation effect [26], as expressed by Eqs. 23, 24. As a result, the pressure need not necessary be so high to compress the annular liquid.
where, Aa is the area of the annulus cross section, m2; ps is the initial pressure imposed on the nitrogen gas, MPa; Ts is the initial temperature of the nitrogen gas, K; and Tc is the temperature of the nitrogen gas, K.
3 Results
A deep gas well with a depth of 6,850 m is selected as the case well. Its casing program is shown in Table 1 and the cement is back to the wellhead. The packer is in the depth of 6,680 m. The wellbottom temperature is 173.07°C and the production rate is set as 40 × 104 m3/d. The other parameters are shown in Table 1.
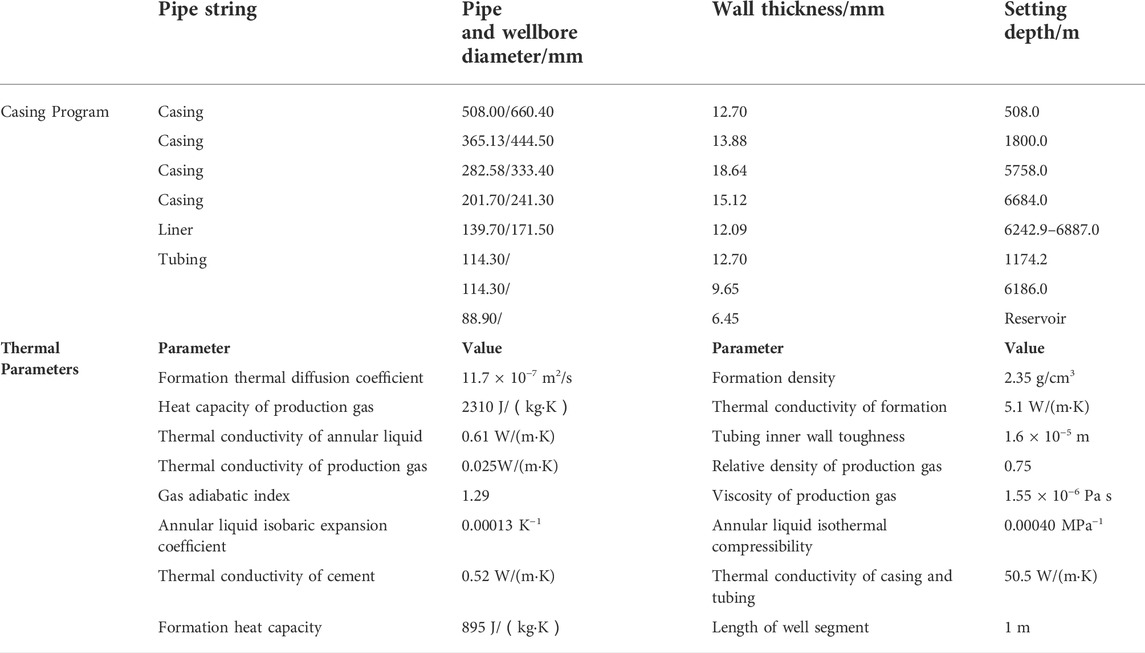
TABLE 1. Calculation parameters of the case well.
3.1 Results of the temperature profile
Figure 1 is the temperature inside the tubing string under different values of the bottom hole pressure. It can be seen that the temperature decreases from the wellbottom to the wellhead because of the heat transfer in the well’s radial direction. Through the comparison of the temperature curves, it can be found that the temperature decreases faster under higher bottom hole pressure. For example, the wellhead temperature is 92.58°C when the bottom hole pressure is 119 MPa, while the wellhead temperature becomes 100.50°C when the bottom hole pressureis 60 MPa. This indicates that the coupling relationship dose exist between the temperature and the pressure. According to the volume consistence law, the temperature change and the trapped annular liquid are two essential conditions for the TAP. The temperature profiles shown in Figure 2 are all higher than the original formation temperature profile. With the existence of the annular protection liquid, the deep gas well obviously satisfies the basic conditions to generate the TAP.
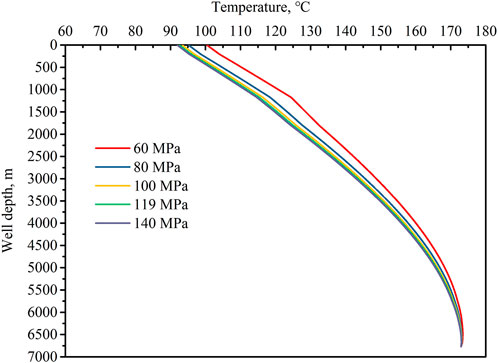
FIGURE 1. The temperature profiles of the production string under different pressures.
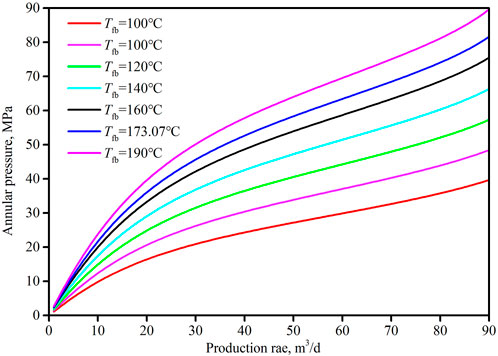
FIGURE 2. The changing law of the TAP as the production rate under different wellbottom temperatures.
3.2 Analysis of the TAP
Figure 2 is the TAP-changing law with the production rate when the tubing–casing annulus is totally filled with the annular protection liquid. The TAP increases as the production rate increases, because larger production rate can bring more heat to the annular liquid. The curves also show that the annular pressure increases faster under higher wellbottom temperature. Considering the high temperature and high production rate of the deep gas well, the high TAP is inevitable when the tubing–casing annulus is totally filled with the annular protection liquid. In Figure 3, the TAP can be as high as 81.61 MPa when the wellbottom temperature is 173.09°C and will increase to 89.66 MPa when the wellbottom temperature is 190°C. Such high annular pressures would certainly damage the well’s safety barriers, like the casing, the tubing, the cement, the packers, and the wellhead [29, 30]. As a result, wellbore leakage may happen and finally bring about the SAP [31]. This would make the management of the deep gas well more complex and more difficult, even the abandonment of the expensive gas well.
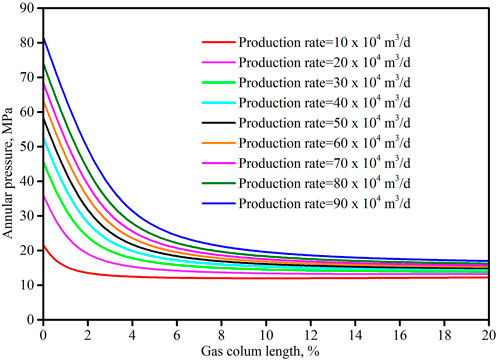
FIGURE 3. The changing law of annular pressure with the nitrogen gas column length under different production rates.
3.3 Mitigation performance
The mitigation performance of nitrogen gas can be obtained by substituting Eq. 20 and Eq. 22 into Eq. 15. The results are shown in Figure 3. It can be seen that the TAP decreases as the nitrogen gas column length increases, but the decreasing speed becomes more and more slow. Taking the curve under 90 × 104 m3/d as an example, the TAP is reduced from 81.61 MPa to 27.10 MPa when the nitrogen gas column length increases from zero to 5 %, while the decrease of the TAP is only 0.77 MPa (from 17.75 MPa to 16.98 MPa) when the nitrogen gas column length increases from 15 % to 20 %. This trend is consistent with the experimental results of Zhou et al. [32] and Wang et al. [33]. Their experiments indicated that the TAP decreases sharply when the nitrogen gas column length is within 5 % and seems stable when the nitrogen gas column length is close to 20 %. This shows that the nitrogen gas can achieve a good mitigation performance under different production rates of the deep gas well, but the nitrogen gas column length should be further analyzed.
According to the shape of the curves in Figure 3, the mitigation performance can be divided into the fast-decreasing stage, the efficient control stage, and the stable stage. In the fast-decreasing stage, the compression of the nitrogen gas volume plays a major role, but the TAP is still high and exceeds the mitigation goal. In the efficient stage, the compression of the nitrogen gas still plays the major role while the reduction of the annular liquid also starts working. The TAP is in a reasonable range in this stage although the decreasing speed is slower. In the stable stage, the TAP even seems unchanged when the nitrogen gas column length is long enough. In this stage, the reduction of the annular liquid plays a major role.
One thing to be noted that there is no universal division criteria for the three stages because the criteria may be different under different conditions. Commonly speaking and according to Figure 3, the nitrogen gas length is less than 3 % in the fast-decreasing stage and the nitrogen gas length is over 10 % in the stable stage. To get the most efficient mitigation performance, it is better to keep the mitigation performance in the efficient stage. The nitrogen gas column should not be over 15 %, or the mitigation performance can be improved very little.
4 Conclusion
1) A mode is established to calculate the temperature profile of the deep gas well by considering the coupling relationship among the temperature, pressure, and gas properties. The case well shows that the temperature decreases faster under higher bottom hole pressure, so the impact of the pressure on the temperature should not be ignored in the deep gas well. Comparing the temperature profiles and the original formation temperature profile, the deep gas well satisfies the basic conditions to generate the TAP.
2) The temperature change and the trapped annular liquid are two essential conditions for the TAP. When the tubing–casing annulus is totally filled with the annular protection liquid, the TAP increases as the production rate increases and increases faster under a higher wellbottom temperature. Considering the high production rate of the deep gas well, the TAP is inevitable and high enough to damage the integrity of the well’s safety barriers without the suitable control measures, which can lead to the SAP in the deep gas well and make the situation more complex.
3) The nitrogen gas mitigates the TAP by reducing the annular liquid volume and providing the extra space to accommodate the thermal-expanded annular liquid. Based on the mitigation mechanism, a model is built to analyze the mitigation performance. The results show that the nitrogen gas can achieve a good mitigation performance under different production rates.
4) The mitigation performance can be divided into the fast-decreasing stage, the efficient control stage, and the stable stage. The compression of the nitrogen gas volume plays a major role in the fast-decreasing stage while the reduction of the annular liquid plays a major role in the stable stage. There are no universal division criteria for the three stages because of the different conditions. To get the most efficient mitigation performance, it is better to keep the mitigation performance in the efficient stage, and the nitrogen gas column should not be over 15 %.
Data availability statement
The original contributions presented in the study are included in the article/supplementary material; further inquiries can be directed to the corresponding authors.
Author contributions
BZ: Formal analysis, Writing-original draft preparation, Writing-review and editing, Funding acquisition; YZ: Formal analysis, Writing-original draft preparation; JZ: Methodology, Conceptualization; NL: Methodology, Conceptualization, Project administration, Supervision; LC: Data analysis; QW: Drawing figures, Funding acquisition; LL: Formal analysis.
Funding
This research is supported by CNPC Forward-looking Basic Strategic Technology Research Projects (2021DJ6504, 2021DJ6502, 2021DJ6501 and 2021DJ4902). The funder was not involved in the study design, collection, analysis, interpretation of data, the writing of this article, or the decision to submit it for publication.
Conflict of interest
Authors BZ, YZ, and JD were employed by Research Institute of Safety and Environment Technology, CNPC. Author NL was employed by Research Institute of Petroleum Exploration and Development, PetroChina. Author LC was employed by Research Institute of Oil & Gas Engineering, Tarim Oilfield Company Petrochina. Author LL was employed by Bazhou Branch Company of Xibu Drilling Engineering Company Limited, CNPC. Author QW was employed by CNPC Engineering Technology R&D Company Limited, Beijing, China.
Publisher’s note
All claims expressed in this article are solely those of the authors and do not necessarily represent those of their affiliated organizations, or those of the publisher, the editors, and the reviewers. Any product that may be evaluated in this article, or claim that may be made by its manufacturer, is not guaranteed or endorsed by the publisher.
References
1. Ge L, Cui H, Li Y, Sui X. Optimization and performance evaluation of foam discharge agent for deep aquatic condensate gas well. Front Phys (2022) 350. doi:10.3389/fphy.2022.887036
2. Maiti S, Gupta H, Vyas A, Kulkarni SD. Evaluating precision of annular pressure buildup (APB) estimation using machine-learning tools. SPE Drill Compl (2022) 37(01):93–103. doi:10.2118/196179-pa
3. Ai S, Cheng L, Huang S, Liu H, Zhang J, Fu L. A critical production model for deep HT/HP gas wells. J Nat Gas Sci Eng (2015) 22:132–40. doi:10.1016/j.jngse.2014.11.025
4. Zhang B, Xu Z, Lu N, Liu H, Liu J, Hu Z, et al. Characteristics of sustained annular pressure and fluid distribution in high pressure and high temperature gas wells considering multiple leakage of tubing string. J Pet Sci Eng (2021) 196:108083. doi:10.1016/j.petrol.2020.108083
5. Teodoriu C, Kosinowski C, Amani M, Schubert J, Shadravan A. Wellbore integrity and cement failure at HPHT conditions. Int J Eng (2013) 2(2):2305–8269.
6. Shadravan A, Schubert J, Amani M, Teodoriu C. Using fatigue-failure envelope for cement-sheath-integrity evaluation. SPE Drill Compl (2014) 30(01):68–75. doi:10.2118/168321-pa
7. Zhang B, Guan Z, Lu N, Hasan AR, Xu S, Zhang Z, et al. Control and analysis of sustained casing pressure caused by cement sealed integrity failure. OTC 28500. In: Offshore Technology Conference Asia held in Kuala Lumpur. Malaysia: Offshore Technology Conference (2018).
8. Pattillo PD, Cocales BW, Morey SC. Analysis of an annular pressure buildup failure during drill ahead. SPE Drill Compl (2006) 21(04):242–7. doi:10.2118/89775-pa
9. Brown J, Kenny N, Slagmulder Y. Unique cement design to mitigate trapped annular pressure TAP between two casing strings in steam injection wells. In: SPE Heavy Oil Conference and Exhibition. Kuwait: Society of Petroleum Engineers (2016). doi:10.2118/184102-MS
10. Fu W, Chen B, Zhang K, Liu J, Sun X, Huang B, et al. Rheological behavior of hydrate slurry with xanthan gum and carboxmethylcellulose under high shear rate conditions. Energy Fuels (2022) 36(6):3169–83. doi:10.1021/acs.energyfuels.1c04359
11. Hasan AR, Kabir CS. Wellbore heat-transfer modeling and applications. J Pet Sci Eng (2012) 86:127–36. doi:10.1016/j.petrol.2012.03.021
12. Wang J, Li J, Liu G, Song X. Development of a wellbore heat transfer model considering circulation loss. Arab J Geosci (2020) 13(2):85–12. doi:10.1007/s12517-020-5055-z
13. Wang X, Sun B, Liu S, Li Z, Liu Z, Wang Z, et al. A coupled model of temperature and pressure based on hydration kinetics during well cementing in deep water. Pet Exploration Dev (2020) 47(4):867–76. doi:10.1016/s1876-3804(20)60102-1
14. Pattillo PD, Bellarby JE, Ross GR, Gosch SW, McLaren GD. Thermal and mechanical considerations for design of insulated tubing. SPE Drill Compl (2004) 19(03):181–8. doi:10.2118/79870-pa
15. Zhang B, Guan Z, Lu N, Hasan AR, Wang Q, Xu B. Trapped annular pressure caused by thermal expansion in oil and gas wells: A review of prediction approaches, risk assessment and mitigation strategies. J Pet Sci Eng (2019) 172:70–82. doi:10.1016/j.petrol.2018.09.041
16. Vargo RF, Payne M, Faul R, LeBlanc J, Griffith JE. Practical and successful prevention of annular pressure buildup on the Marlin project. SPE Drill Compl (2003) 18(03):228–34. doi:10.2118/85113-pa
17. Sun T, Xinquan Z, Shujie L, Yanfeng C, Renjun X. Annular pressure buildup calculation when annulus contains gas. Chem Technol Fuels Oils (2018) 54(4):484–92. doi:10.1007/s10553-018-0950-7
18. Jiang M, Tan C, Li J, Cheng X, Li J. Comparisons between protection fluid and nitrogen column in tube-casing annulus of gas storage wells. Acta Petrolei Sinica (2017) 38(10):1210–6. doi:10.7623/syxb201710012
19. Fu W, Wang Z, Chen L, Sun B. Experimental investigation of methane hydrate formation in the carboxmethylcellulose (CMC) aqueous solution. SPE J (2020) 25(03):1042–56. doi:10.2118/199367-pa
20. Fu W, Wang Z, Zhang J, Cao Y, Sun B. Investigation of rheological properties of methane hydrate slurry with carboxmethylcellulose. J Pet Sci Eng (2020) 184:106504. doi:10.1016/j.petrol.2019.106504
21. Fu W, Yu J, Xu Y, Wang C, Huang B, Sun B. A pressure drop prediction model for hydrate slurry based on energy dissipation under laminar flow condition. SPE J (2022) 27:2257–67. doi:10.2118/209586-PA
22. Ferreira MV, Hafemann TE, Barbosa JR, da Silva AK, Hasan R. A numerical study on the thermal behavior of wellbores. SPE Prod Operations (2017) 32(04):564–74. doi:10.2118/180297-pa
23. Wang Y. Research of gas liquid mixture flow characteristics through choke and its application. Master Thesis. Xi’an: Xi’an Petroleum Unversity (2013).
24. Zhang B, Lu N, Guo Y, Wang Q, Cai M, Lou E. Modeling and analysis of sustained annular pressure and gas accumulation caused by tubing integrity failure in the production process of deep natural gas wells. J Energ Resour Tech (2022) 144(6):063005. doi:10.1115/1.4051944
25. Liu J, Fan H, Peng Q, Deng S, Kang B, Ren W. Research on the prediction model of annular pressure buildup in subsea wells. J Nat Gas Sci Eng (2015) 27:1677–83. doi:10.1016/j.jngse.2015.10.028
26. Zhang B, Xu Z, Guan Z, Li C, Liu H, Xie J, et al. Evaluation and analysis of nitrogen gas injected into deepwater wells to mitigate annular pressure caused by thermal expansion. J Pet Sci Eng (2019) 180:231–9. doi:10.1016/j.petrol.2019.05.040
27. Oudeman P, Bacarreza LJ. Field trial results of annular pressure behavior in a high-pressure/high-temperature well. SPE Drill Compl (1995) 10(2):84–8. doi:10.2118/26738-pa
28. Da Veiga AP, Martins IO, Barcelos JG, Ferreira MVD, Alves EB, da Silva AK, et al. Predicting thermal expansion pressure buildup in a deepwater oil well with an annulus partially filled with nitrogen. J Pet Sci Eng (2022) 208:109275. doi:10.1016/j.petrol.2021.109275
29. De Souza CO, de Sousa JRM, Ellwanger GB. Wellhead axial movements in subsea wells with partially cemented surface casings. J Pet Sci Eng (2020) 194:107537. doi:10.1016/j.petrol.2020.107537
30. Kiran R, Teodoriu C, Dadmohammadi Y, Nygaard R, Wood D, Mokhtari M, et al. Identification and evaluation of well integrity and causes of failure of well integrity barriers (A review). J Nat Gas Sci Eng (2017) 45:511–26. doi:10.1016/j.jngse.2017.05.009
31. Zhang B, Guan Z, Zhang Q, Han D. Prediction of sustained annular pressure and the pressure control measures for high pressure gas wells. Pet Exploration Dev (2015) 42(4):567–72. doi:10.1016/s1876-3804(15)30051-3
32. Zhou B, Yang J, Liu Z, Luo J, Huang X, Zhou R, et al. Mechanism of pressure management by injecting nitrogen in casing annulus of deepwater wells. Pet Exploration Dev (2015) 42(3):422–6. doi:10.1016/s1876-3804(15)30034-3
Keywords: deep gas well, temperature distribution, trapped annular pressure, fluid distribution, mitigation performance
Citation: Zhang B, Zheng Y, Deng J, Lu N, Cao L, Wang Q and Luo L (2022) Modeling analysis of the temperature profile and trapped annular pressure induced by thermal-expanded liquid in a deep gas well. Front. Phys. 10:1014842. doi: 10.3389/fphy.2022.1014842
Received: 09 August 2022; Accepted: 24 August 2022;
Published: 19 September 2022.
Edited by:
Weiqi Fu, China University of Mining and Technology, ChinaCopyright © 2022 Zhang, Zheng, Deng, Lu, Cao, Wang and Luo. This is an open-access article distributed under the terms of the Creative Commons Attribution License (CC BY). The use, distribution or reproduction in other forums is permitted, provided the original author(s) and the copyright owner(s) are credited and that the original publication in this journal is cited, in accordance with accepted academic practice. No use, distribution or reproduction is permitted which does not comply with these terms.
*Correspondence: Bo Zhang, emhhbmdib3VwY0AxMjYuY29t; Nu Lu, bHVudUBwZXRyb2NoaW5hLmNvbS5jbg==