- 1State Key Laboratory of Power Transmission Equipment and System Security and New Technology, Chongqing University, Chongqing, China
- 2Institute of Plasma Physics, HFIPS, Chinese Academy of Sciences, Hefei, China
- 3CompX, Del Mar, CA, United States
- 4Department of Physics, Auburn University, Auburn, AL, United States
The wave propagation and power deposition inside and outside the blue-core helicon plasma are computed, together with their transitional behaviours prior to and after the blue-core formation. Computations refer to the experiments on the CSDX (controlled shear decorrelation experiment) (Thakur et al., Plasma Sources Science and Technology 23: 044,006, 2014 and Thakur et al., IEEE Transactions on Plasma Science 43: 2754–2759, 2015). It is found that the radial profile of wave electric field peaks off-axis during the blue-core formation, and the location of this peak is very close to that of particle transport barrier observed in experiment; the radial profile of wave magnetic field shows multiple radial modes inside the blue-core column, which is consistent with the experimental observation of coherent high m modes through Bessel function. The axial profiles of wave field indicate that the decay length shortens for increased external field strength, especially when the blue-core mode has been achieved, and this length is relatively longer inside the core than that outside. The wave energy density is overall lower in two orders after blue-core formation than that prior to, and the energy distribution shows a periodic boundary layer near the edge of blue-core column. The dispersion relation inside the blue-core column suggests the presence of two radial modes, while outside the blue-core column it shows no variation, i.e. constant wave number with changed frequency. The power deposition appears to be off-axis in the radial direction, forming a hollow profile, and when the blue-core mode has been formed it shows periodic structure in the axial direction. Analyses based on the step-like function theory and introduced blue-core constant provide consistent results and more physics understanding. These details of wave propagation and power deposition during the blue-core formation are presented for the first time, and helpful for understanding the mechanism of blue-core phenomenon. The equivalence of blue-core plasma column to optical fiber for electromagnetic communication is also explored, and preliminary calculation shows that total reflection can indeed occur if the incident angle is larger than a threshold value. This may inspire a novel application of helicon plasma, and is one of the most interesting findings of present work.
1 Introduction
The underlying physics of helicon discharge, which can produce high-density plasma with remarkable ionisation rate, have been attracting great research interest [1–6]. Besides further measurements of TG (Trivelpiece–Gould) mode and energetic electrons, the blue-core phenomenon that plasma shrinks towards axis and emits bright light in blue colour (argon) for high input RF power and strong confining magnetic field remains mysterious and most challenging of the field [7–12]. It represents a general bright-core mode of helicon discharge for other gases as well, for example nitrogen and helium [13, 14], although in different colours. This bright-core mode denotes the highest level of helicon discharge for which the definition lies in that the gas is fully ionised (100% ionisation rate), because further increased power does not enhance the plasma density but the ionisation state due to the ion pumping effects [15]. Common features have been drawn from this mode such as azimuthal instabilities driven by radial pressure gradients, and high-beta (beta is the ratio of particle pressure to magnetic field pressure) effects [16]. Previous studies mainly employed optical camera and/or spectrometer to characterise these features after the blue-core formation [10, 11, 17–19], however, little attention was given to the transitional behaviours from non-blue-core mode to blue-core mode. Especially, to our best knowledge, there is no measurement yet about the wave field and power absorption inside and outside the blue-core plasma column, respectively.
The present work is devoted to studying the transitional and spatial details of blue-core formation via numerical computations. We shall compute the wave propagation and power deposition prior to and after the blue-core formation, showing significant changes during the mode transition; furthermore, the wave propagation and power deposition features inside and outside the blue-core column are also presented, showing remarkable difference in spatial structures. According to our best knowledge, these details are given for the first time, and very helpful for revealing the mechanism of blue-core phenomenon. The electromagnetic solver (EMS) [20] employed for computations have been well-benchmarked against various experiments and analytical calculations [21–24], demonstrating its predictive capability. Here, to make our computations more valuable and reliable, we refer to the experiments on the CSDX (controlled shear decorrelation experiment) [9, 25] by using the experimental data as inputs and carrying out preliminary comparisons. Moreover, step-like function theory [26] will be utilised for physics analysis, which provides consistent results. Finally, the equivalent analogy of blue-core plasma column to optical fiber will be explored for electromagnetic communications, inspired by their similarities. This equivalence may promote novel applications of blue-core helicon plasma, an exciting and valuable finding of present work.
2 Numerical scheme
2.1 Electromagnetic solver
The EMS, which has been used successfully to model various plasma sources [21–24, 27, 28], is based on two Maxwell’s equations: Faraday’s law and Ampere’s law [20],
with E and B the wave electric and magnetic fields, respectively. The symbols of μ0 and t are standard permeability of vacuum and time. The system is driven by the current density ja of external antenna. Perturbations vary in form of exp[i(kz + mθ − ωt)], with k the axial wave number, m the azimuthal mode number and ω the driving frequency, for a right-hand cylindrical coordinate system (r; θ; z). The displacement vector D is linked to E via a cold-plasma dielectric tensor [29],
Here, ɛ0 is the permittivity of vacuum and b is the unit vector of external magnetic field (b = B0/B0). The dielectric tensor comprises three components:
The subscript α labels the species of particles, i. e. ion and electron, and the plasma frequency
Here, the subscript a denotes the antenna, i. e. La the length, Ra the radius, za the distance to left endplate, Ia the magnitude of antenna current, and H is the Heaviside step function. The boundary conditions enclosing the model are formed by assuming that the tangential components of E vanish on the surface of chamber walls:
where R and L are the radius and length of chamber, respectively.
2.2 Domain and conditions
The EMS model is solved by finite difference method based on four staggered rectangular grids [20]. Figure 1 shows the computational domain that is drawn referring to the recent layout of CSDX experiments [9, 25]. The source chamber (Pyrex glass) in length of 0.4 m and diameter of 0.15 m connects the diffusion chamber (stainless steel) of length 2.8 m and diameter 0.2 m coaxially. Two diagnostic ports are located at z = 1.2 m (P1) and z = 2 m (P2), respectively, in the diffusion chamber to measure the cross-sectional parameters. The source plasma is generated by a half-turn helical antenna in length of 0.2 m and diameter of 0.15 m, for which the current density is expressed by Eq. 7 ∼Eq. 9. The antenna is driven by a radio-frequency (RF) power supply with fixed frequency of 13.56 MHz and maximum power of 5 kW. Here, we also fix the current magnitude to 12 A throughout the paper, referring to the fixed power of 1.6 kW in experiment. The filling gas is argon. The external magnetic field is uniform for both the source and diffusion regions with the same magnitude, and referring to the experiment and previous publications [9, 25, 30], we also choose the four typical strengths of 0.08, 0.12, 0.14 and 0.16 T. Accordingly, four normalised radial profiles of plasma density are constructed, as shown in Figure 2. They are fitted from experimental data [9, 31] with expressions: exp[ − 2746.46r2] for 0.08 T, exp[ − 4167.88r2] for 0.12 T, exp[ − 35,526.8r2] for 0.14 T, and exp[ − 31,493.9r2] for 0.16 T. We can see that the plasma shrinks onto axis with increased magnetic field, i. e. larger gradient in radius, whereas field strength higher than 0.14 T yields little difference. Please note that the discharge mode is W (helicon) for all these field strengths, although the blue-core formation occurs after 0.14 T (including), and the input power is fixed to 1.6 kW during the field variations. Other conditions are also set to be the same to the CSDX experiments [9, 25], including electron temperature of 4 eV. These identical settings bring about great convenience for comparison between numerical and experimental results. Although detailed comparison cannot be performed here, due to the lack of experimental data about the wave field and power absorption during the blue-core formation in the CSDX, this work surely serves as a predictive reference for future experiments. Nevertheless, we shall still compare them preliminarily in terms of the radial locations of blue-core edge, inferred by wave field from computations and by particle flux from experiments, respectively.

FIGURE 1. Schematic of computational domain referring to the CSDX [9, 25, 30]. The uniform magnetic field is for both source and diffusion regions with same magnitude.
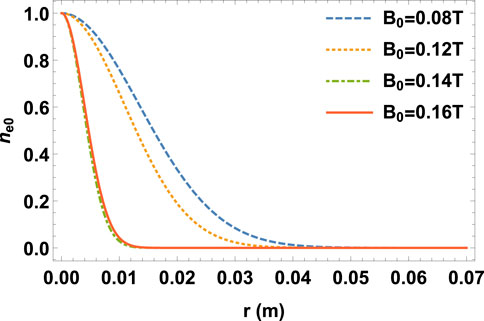
FIGURE 2. Normalised radial profiles of plasma density for four external magnetic field strengths, fitted from experimental data on the CSDX [9, 31].
3 Computed results
3.1 Wave propagation
We first investigate the wave propagation characteristics for the plasma density profiles constructed above. Figure 3 and Figure 4 show the typical radial profiles of wave electric field and magnetic field, respectively, calculated at the first port (P1 in Figure 1), which provides convenience for experimental verification. It can be seen that the wave electric field shows multiple peaks that appear to scale with the density profile width for low field strengths, and clearly forms a local peak around r ≈ 0.015 m for high field strengths. This temporally oscillating peak could induce ponderomotive force [32–34] that may contribute to the formation of transport barrier for which, however, detailed confirmation requires further study. Indeed, the location of this peak is very close to the experimental observation of transport barrier at r ≈ 0.02 m during the blue-core formation [9, 25]. However, the correlation between them is unclear at present and will be explored in the future. Moreover, the wave magnetic field shows additional radial modes inside r ≈ 0.015 m for high field strengths, which can be seen more clearly from the normalised results shown by the inset curves. This is consistent with the experimental observation that very coherent high-m fluctuations occur inside the blue-core column. Due to the limitation of EMS that only a single m can be considered for each run of simulation (m = 1 throughout the paper for the half-turn helical antenna employed here), however, we cannot see directly the appearance of high-m structure but indirectly from the formation of multiple radial modes.
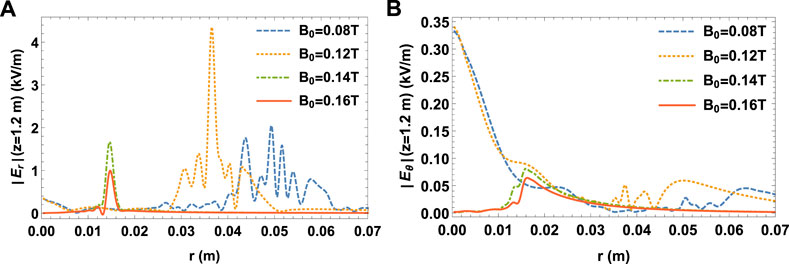
FIGURE 3. Radial profiles of wave electric field (A), radial component; (B), azimuthal component for four external magnetic field strengths, measured at z = 1.2 m (P1).

FIGURE 4. Radial profiles of wave magnetic field (A), radial component; (B), azimuthal component for four external magnetic field strengths, measured at z = 1.2 m (P1). The inset shows normalised results.
This can be inferred from the resonant eigenmodes [35]:
with U the amplitude constant and Q2 = β2 − k2. It is the Bessel function Jm(r) that correlates the radial and azimuthal modes, while in physics they are essentially determined by the spatial eigenmode resonance. Overall, the radial profiles of wave electric field and magnetic field show significant difference when the confining magnetic field increases from low magnitude (before blue-core formation) to high magnitude (after blue-core formation). These different spatial profiles of wave field before and after the blue-core formation can be also observed in the axial direction. We compute the wave magnetic field, which is easily measurable by B-dot probe in experiment, at two radial locations, namely r = 0 m (inside blue-core column) and r = 0.04 m (outside blue-core column). As shown by Figure 5, the wave field looks more evanescent for higher field strength, i.e. decay length shortened from 0.08 to 0.16 T, and more evanescent for bigger radius, i.e. shorter decay length at r = 0.04 m compared to that at r = 0 m. To show more details, we compute the phase of wave magnetic field inside and outside the blue-core column (B0 = 0.16 T), via θ = arctan Im[Bθ]/Re[Bθ]. Figure 6 presents the results. One can see that the wave propagation inside has identical phase in the axial direction (helicon mode) (z ≈ 1.1 ∼ 2.7 m away from antenna and endplates), whereas there seems no regular phase outside but periodic singularities (close to vacuum mode). The underlying reason could be attributed to the plasma density outside the core which is too low to support the helicon mode. The axial profiles of wave electric field show similar features. This implies that the existence of blue-core plasma column in a sense confines the wave propagation inside and localises the wave field near the axial position of antenna, which is illustrated more clearly by the two-dimensional contour plots of wave energy distribution shown in Figure 7. We can see that, with the field strength increased, the wave energy magnitude drops significantly (in two orders), especially from 0.12 T (before blue-core formation) to 0.14 T (after blue-core formation); moreover, the distribution forms a periodic boundary layer around r ≈ 0.015 m for high-field cases (0.14 and 0.16 T), close to the location of transport barrier at r ≈ 0.02 m observed in experiment [9, 25]. This periodic structure looks similar to the beat pattern of helicon radiation observed earlier [23, 36], and is consistent with the whistler bouncing at sharp plasma edge [37, 38]. The off-axis peaks in the radial profile of wave energy density shown by Figure 8 (inset curves) correspond to this boundary layer. Here, integration has been performed along the axial direction, same to the method of experimental measurement, showing the accumulated wave energy in the cross section.
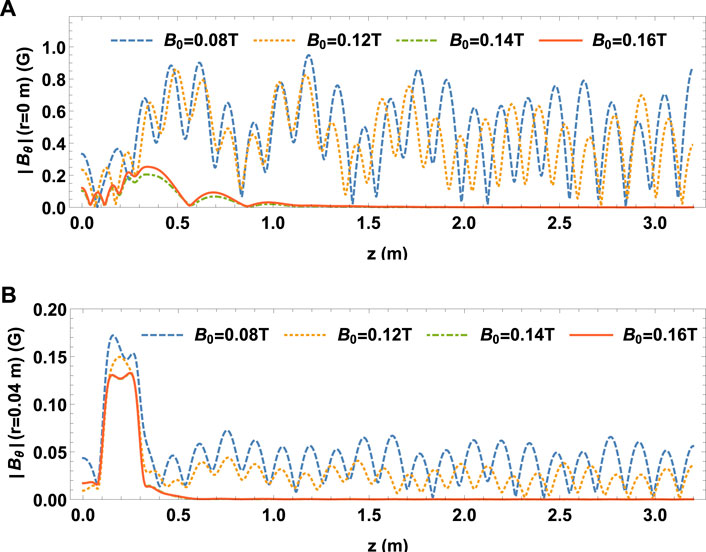
FIGURE 5. Axial profiles of wave magnetic field for various confining field strengths, measured inside (A), (r = 0 m) and outside (B), (r = 0.04 m) blue-core column.
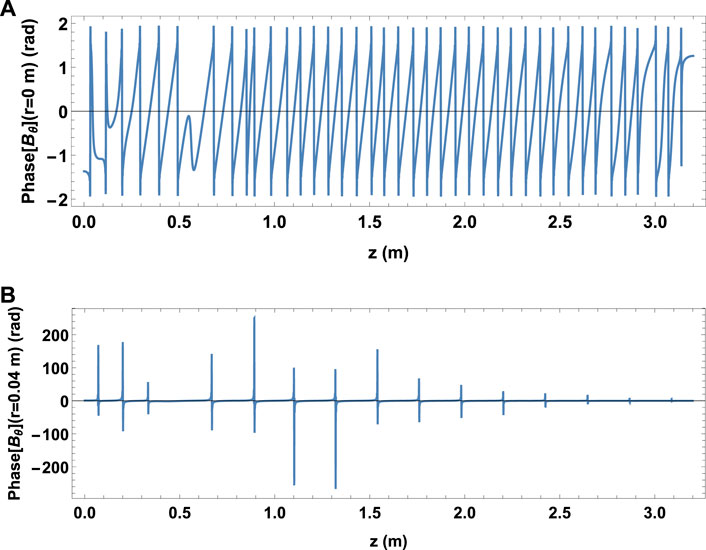
FIGURE 6. Phase for wave magnetic field inside (A), (r = 0 m) and outside (B), (r = 0.04 m) blue-core column (B0 = 0.16 T).
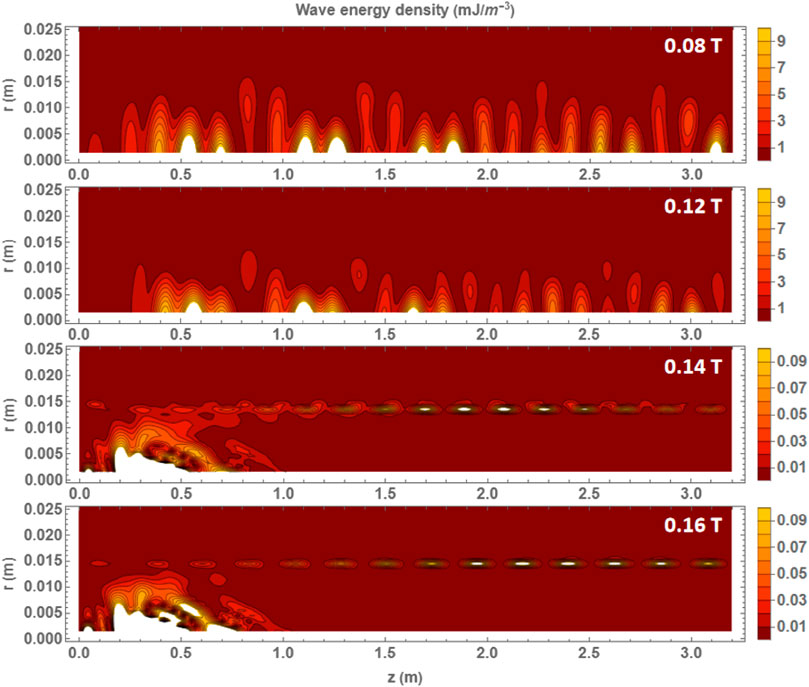
FIGURE 7. Wave energy density for typical four magnetic field strengths. White area shows magnitude higher than the range of colour bar.
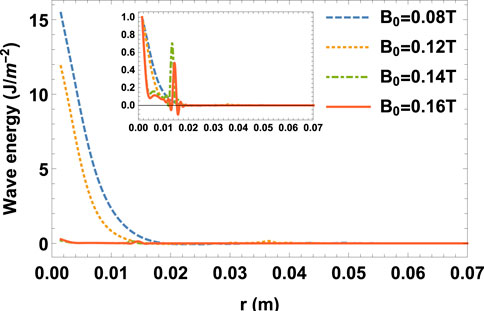
FIGURE 8. Integrated radial profiles of wave energy for the four external magnetic field strengths. The inset shows normalised results.
To reveal the intrinsic physics of different wave propagation features inside and outside the blue-core column, we focus on the case of B0 = 0.16 T and run the EMS code for frequency range of f = π ∼ 10π MHz. Utilising a Fourier decomposition method to extract the dominant k from the axial profiles of wave field, we obtain the dispersion relations shown in Figure 9. For the location inside blue-core column, the dispersion relation appears linear (in form of k = af + b with a the gradient and b an arbitrary non-zero constant) and discontinuous in form of two segments which may imply two distinct modes. For the location outside blue-core column, the computed dispersion relation is not linear but constant, for which we could draw a horizontal line to label the average value of k = 22.37 m−1. The corresponding wave length is λ = 0.28 m, close to the length of antenna (0.2 m), and independent of frequency, whereas the wave length inside blue-core column is much shorter and varies with frequency. This demonstrates that the wave modes inside and outside blue-core column are essentially different. As shown in Figure 5 and Figure 6, once the blue-core column has been formed, wave propagation is mostly confined inside, similar to the light propagation in optical fiber [39, 40]. This feature may inspire novel applications of blue-core helicon plasma, which will be analysed further in next section.
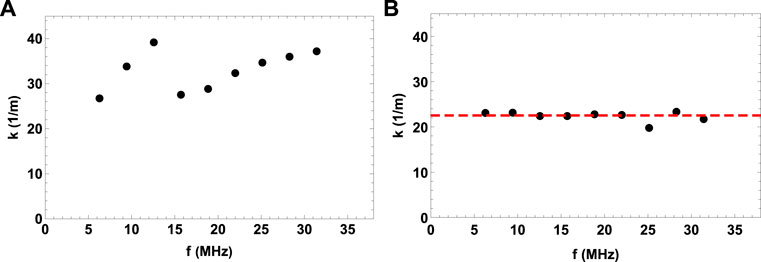
FIGURE 9. Dispersion relations inside (A), (r = 0 m) and outside (B), (r = 0.04 m) the blue-core column for B0 = 0.16 T.
3.2 Power deposition
Next, we explore how the power is deposited from antenna to plasma, especially when the blue-core column has been formed. Different from wave energy that showing the wave propagation features, power deposition shows the coupling effect between antenna and plasma column and is more important for experimental operations. Figure 10 shows the radial profiles of computed power deposition, which have been integrated over the axial direction in a similar way as done for Figure 8. One can see that the magnitude of power deposition reduces significantly when the field strength increases from 0.12 to 0.14 T. This indicates that the coupling effect becomes much more weak after the blue-core formation; moreover, the discharge evolves into a different mode. This is consistent with the experimental observation that the discharge transits from blue-colour mode to blue-core mode [9]. The decreased power for shrunk density profiles implies that certain magnitude of plasma density near edge is beneficial for power coupling, which also agrees with previous studies [41–45]. Please note that for fixed power (1.6 kW), the uncoupled power in experiment is reflected by matching box and becomes heat, whereas our simulation here does not include the matching box and heat module thus cannot see the “extra” power, which will be improved in future simulations. More interestingly, we find that the power deposition is hollow in radius for all field strengths and its peak moves closer to axis when the field strength increases. A two-dimensional picture of power absorption density is given by Figure 11. Similar to Figure 7, it shows that the power distribution shrinks radially towards axis and localises more near the axial position of antenna when the field strength is increased; moreover, it forms a periodic boundary layer after the blue-core establishment. Additionally, inside the layer, the maximum power deposition is off-axis, especially far away from the antenna in the diffusion region.
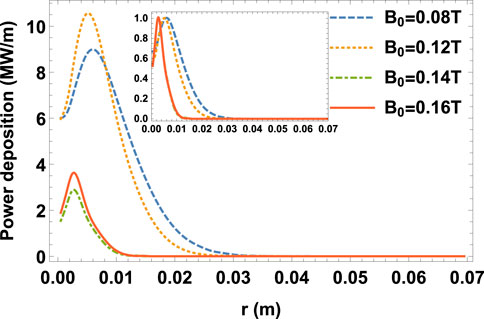
FIGURE 10. Integrated radial profiles of power deposition for the four external magnetic field strengths. The inset shows normalised results.
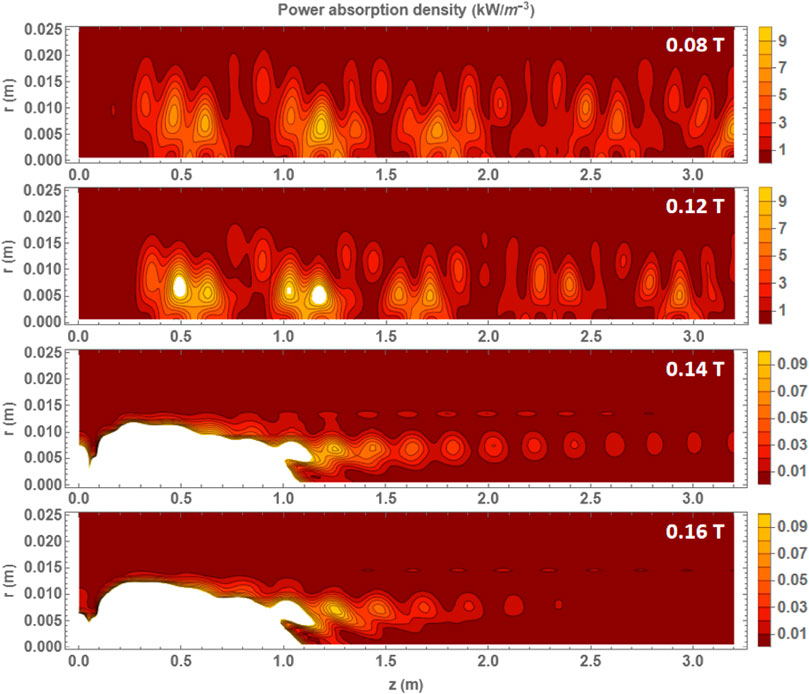
FIGURE 11. Power absorption density for typical four magnetic field strengths. White area shows magnitude higher than the range of colour bar.
To demonstrate the validity of our simulations, we compare preliminarily the radial locations of blue-core edge inferred from the computed wave field and from the measured particle flux. Figure 12 shows the case for the highest field strength of B0 = 0.16 T. Here, we assume that the peak of wave field oscillation correlates with the existence of particle transport barrier in some way that will be determined later, and the sign-inverse point of particle flux labels the transport barrier. The particle flux was measured by Langmuir probes in experiment, and due to limited data the error bar is not available at the moment. We can see that they are very close, confirming preliminarily the validity of present work. Due to the absence of experimental data on wave field and power distribution across the blue-core plasma column and the incapability of EMS to capture particle movement, however, direct comparison cannot be made on the same parameter at present but will be surely carried out in our future research.
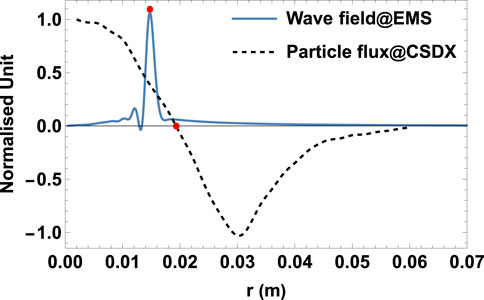
FIGURE 12. Radial profiles of computed wave field and measured particle flux. The red dot on solid line shows the peak magnitude of wave field at r = 0.015 m, and the red dot on dashed line denotes the sign-inverse point of particle flux at r ≈ 0.02 m.
4 Theoretical analysis
4.1 Step-like function theory
To reveal the underlying physics more clearly, we employ the step-like function theory developed by Breizman and Arefiev for radially localised helicon mode [26]. This step-like conception coincides to the blue-core plasma column with sharp radial gradient and represents an ideal case for easy quantification. The theory comprises two equations:
for helicon and TG modes, respectively, with
The symbols of n0 and r0 represent the density inside core and edge radius of plasma column, respectively, while n* and r* label the density outside core and radius of density jump. Please note that this step-like density profile, although is unrealistic in experiment, can manifest the effect of radial density gradient and simplify the mathematical treatment. The resulted electric field has expression [26]:
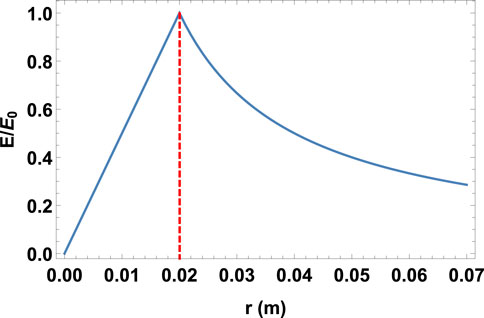
with E0 a constant. For the m = 1 mode considered here, its radial profile is displayed in Figure 13 (with r* = 0.02 m and r0 = 0.07 m referring to the CSDX experiments [9, 25]). This loosely resembles the computed results shown in Figure 3 (in that figure Ez(r) is very similar to Er(r) for the m = 1 mode studied) for the blue-core mode (high-field cases): the wave electric field peaks off-axis and decreases toward both axis and edge. It implies that the off-axis peaks on wave electric field are caused by large radial gradient in plasma density during blue-core formation. According to the step-like function theory, this density jump plays a key role in the power coupling from plasma edge to core [26] and accommodate the mode conversion from TG to helicon [37]. Therefore, we suppose that the peak wave oscillations represent the occurrence of strongest power coupling and mode conversion.
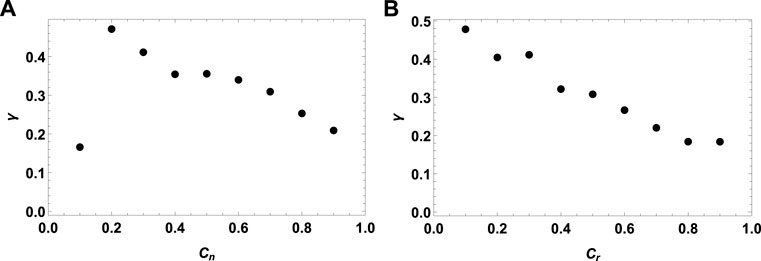
Next, to explore in detail the effects of density jump, i. e. magnitude and location, we introduce the ratios of Cn = n*/n0 and Cr = r*/r0, respectively, which are bigger than zero and smaller than unity, and the product of Cb = Cn × Cr to quantify the shrinking feature of blue-core plasma. This product can be thus defined in phrase of “blue-core constant” or more generally “bright-core constant” to include other gases as well. When fitted to the experimental density profiles shown in Figure 2, this constant becomes Cb = Cn × Cr ≈ 0.2 × 0.1 ≈ 0.02 which labels the formation of blue-core mode. We also introduce the parameter of γ = P*/P0 in simulations to measure the ratio of power deposition inside the blue-core column (P*) to that in total (P0). The radius for P* is chosen to be r = 0.02 m, same to the measured edge of blue-core column in experiments [9, 25]. Figure 14 shows the computed dependence of γ on Cn and Cr. We can see that γ largely increases with reduced Cn and Cr. This indicates that the more plasma is shrunk onto axis, the more power is deposited inside the core region. However, there is an abnormal point for Cn < 0.2 in Figure 14A where the ratio drops back, and could be attributed to the plasma density near edge which is too low to efficiently couple the power from antenna into core. This critical role of edge density for power absorption has been also claimed by other studies [41–45]. This section of step-like analyses provides quantitative and consistent results for the Gaussian density profiles studied in previous sections, and introduces the analogy of blue-core plasma column to optical fiber discussed below.
4.2 Equivalence to optical fiber
Inspired by the finding above that wave propagation is confined mostly inside the blue-core column and the radial density gradient is very large (close to step-like), we propose that this blue-core helicon plasma could be used for electromagnetic communications, similar to the optical fiber for light communication [39, 40]. The interest is to consider the blue-core plasma column as a type of nonlinear optical fiber. The novelty that a plasma fiber may offer (over its optical equivalent) is the ability to tune or actively modify the fiber. To achieve this, the condition of total reflection has to be met, and Figure 15 gives an illustration. This illustration is consistent with previous findings that obliquely propagating waves are reflected by radial density gradient before they reach the edge of plasma [46–48], following a zigzag motion confined to the high density core.
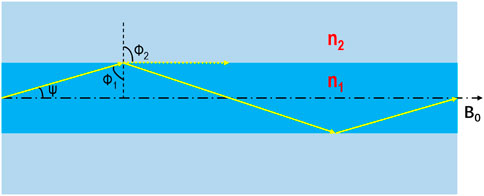
FIGURE 15. Illustration of blue-core plasma column behaving as “optical fiber” for electromagnetic communications.
According to the law of refraction, namely n1 sin ϕ1 = n2 sin ϕ2 with n the index of refraction and ϕ the angle to normal direction, we know that the threshold angle for total reflection (ϕ2 = π/2) is ϕ1 = arcsin (n2/n1). Referring to the definition of n (n = c/vph or n = λ0/λ with c the speed of light, vph the phase velocity, and λ0 the wavelength in vacuum) and waves in uniform magnetised plasma [29, 49], we can write n in form of
with:
Please note that here ψ labels the angle of wave vector to the confining magnetic field, which lies in the same direction of blue-core edge, so that we have ψ + ϕ1 = π/2 as shown in Figure 15. For either parallel wave, i. e.
or oblique wave such as whistler mode, i. e.
we can all draw conclusion with high-density approximation (
5 Conclusion
The blue-core phenomenon during helicon discharge has been attracting great research interests recently. Different from existing studies which mainly employ optical camera or spectrometer to observe the features after blue-core formation, the present study devotes itself to revealing the transitional behaviours prior to and after the blue-core formation and the spatial structures across the edge of blue-core plasma column, in terms of wave propagation and power deposition. These details are given for the first time and useful for understanding the physics of blue-core phenomenon. A well-benchmarked electromagnetic solver (EMS) based on Maxwell’s equations and a cold-plasma dielectric tensor is employed for computations, referring to the recent experiments on CSDX [9, 25]. We found that:
• the computed wave electric field peaks off-axis and near the radial location of particle transport barrier observed in experiment, during the blue-core formation;
• the wave magnetic field shows multiple radial modes inside the blue-core column;
• the axial profiles of wave field demonstrate that the decay length is shorter for higher confining field strength, and the mode structure inside the blue-core column is very different from that outside;
• the two-dimensional distributions of wave energy and power deposition show off-axis (or hollow) features in radius, especially far from antenna in the diffusion region, and periodic structures in the axial direction near the blue-core boundary layer;
• the analyses based on step-like function theory yield consistent results in terms of the radial profile of wave electric field;
• the equivalence of blue-core helicon plasma column to optical fiber for electromagnetic communications possesses theoretical feasibility, as long as the incident angle is larger than the threshold value, and inspires a novel “plasma fibre” applications of helicon plasma.
Future research will be devoted to the detailed comparison between computed and measured wave field and power absorption during the blue-core formation, and the experimental verification of this novel concept of “plasma fiber”.
Data availability statement
The original contributions presented in the study are included in the article/Supplementary material, further inquiries can be directed to the corresponding author.
Author contributions
LC computes the wave field and power deposition in blue-core helicon plasma and writes up the paper, JC contributes to the data and physics analyses, and ST provides experimental conditions for computation and contributes to physics analyses.
Funding
This work was supported by the Chinese Academy of Sciences ``100″ Talent Program (Y35QT1089R) and the Science Foundation of Institute of Plasma Physics (DSJJ-2020-07), and the Fundamental Research Funds for the Central Universities (2022CDJQY-003). Chongqing Entrepreneurship and Innovation Support Program for Overseas Returnees (cx2022004).
Acknowledgments
We appreciate Guangye Chen for providing the EMS code and many instructions for its usage.
Conflict of interest
JC was employed by the company CompX.
The remaining authors declare that the research was conducted in the absence of any commercial or financial relationships that could be construed as a potential conflict of interest.
Publisher’s note
All claims expressed in this article are solely those of the authors and do not necessarily represent those of their affiliated organizations, or those of the publisher, the editors and the reviewers. Any product that may be evaluated in this article, or claim that may be made by its manufacturer, is not guaranteed or endorsed by the publisher.
References
1. Boswell RW. Plasma production using a standing helicon wave. Phys Lett A (1970) 33(7):457–8. doi:10.1016/0375-9601(70)90606-7
2. Boswell RW, Chen FF. Helicons-the early years. IEEE Trans Plasma Sci IEEE Nucl Plasma Sci Soc (1997) 25(6):1229–44. doi:10.1109/27.650898
3. Chen FF, Boswell RW. Helicons-the past decade. IEEE Trans Plasma Sci IEEE Nucl Plasma Sci Soc (1997) 25(6):1245–57. doi:10.1109/27.650899
4. Chen FF. Helicon discharges and sources: A review. Plasma Sourc Sci Technol (2015) 24(1):014001. doi:10.1088/0963-0252/24/1/014001
5. Shinohara S. Helicon high-density plasma sources: Physics and applications. Adv Phys X (2018) 3(1):1420424. doi:10.1080/23746149.2017.1420424
6. Takahashi K. Helicon-type radiofrequency plasma thrusters and magnetic plasma nozzles. Rev Mod Plasma Phys (2019) 3(1):3. doi:10.1007/s41614-019-0024-2
7. Guo XM, Scharer J, Mouzouris Y, Louis L. Helicon experiments and simulations in nonuniform magnetic field configurations. Phys Plasmas (1999) 6(8):3400–7. doi:10.1063/1.873580
8. Blackwell BD, Caneses JF, Samuell CM, Wach J, Howard J, Corr C. Design and characterization of the magnetized plasma interaction experiment (magpie): A new source for plasma–material interaction studies. Plasma Sourc Sci Technol (2012) 21(5):055033. doi:10.1088/0963-0252/21/5/055033
9. Thakur SC, Brandt C, Cui L, Gosselin JJ, Tynan GR. Formation of the blue core in argon helicon plasma. IEEE Trans Plasma Sci IEEE Nucl Plasma Sci Soc (2015) 43(8):2754–9. doi:10.1109/tps.2015.2446537
10. Zhang TL, Cui RL, Zhu WY, Yuan Q, Ouyang JT, Jiang KY, et al. Influence of neutral depletion on blue core in argon helicon plasma. Phys Plasmas (2021) 28(7):073505. doi:10.1063/5.0050180
11. Wang CW, Liu Y, Sun M, Zhang TL, Chen Q, Zhang HB. Effect of inhomogeneous magnetic field on blue core in ar helicon plasma. Phys Plasmas (2021) 28(12):123519. doi:10.1063/5.0070479
12. Chang L, Boswell R, Luo GN. First helicon plasma physics and applications workshop. Front Phys (2022) 9:808971. doi:10.3389/fphy.2021.808971
13. Zhao G, Wang HH, Si XL, Ouyang JT, Chen Q, Tan C. The discharge characteristics in nitrogen helicon plasma. Phys Plasmas (2017) 24(12):123507. doi:10.1063/1.5002725
14. Huang TY, Jin CG, Yu YW, Hu JS, Yang JH, Ding F, et al. Helicon-wave-excited helium plasma performance and wall-conditioning study on EAST. IEEE Trans Plasma Sci IEEE Nucl Plasma Sci Soc (2020) 48(8):2878–83. doi:10.1109/tps.2020.3005157
15. Boswell RW. Very efficient plasma generation by whistler waves near the lower hybrid frequency. Plasma Phys Control Fusion (1984) 26(10):1147–62. doi:10.1088/0741-3335/26/10/001
16. Boswell RW. Helicon sources: Why they work! In first helicon plasma Physics and applications workshop. China: Hefei (2021). p. 22–5.
17. Soltani B, Habibi M. Development of a helicon plasma source for neutral beam injection system of the alborz tokamak. J Fusion Energ (2017) 36(4-5):152–60. doi:10.1007/s10894-017-0135-0
18. Zhang GL, Huang TY, Jin CG, Wu XM, Zhuge LJ, Ji HT. Development of a helicon-wave excited plasma facility with high magnetic field for plasma–wall interactions studies. Plasma Sci Technol (2018) 20(8):085603. doi:10.1088/2058-6272/aac014
19. Yang X, Yuan XG, Chang L, Xu Q, Zhang LP, Chang YJ, et al. Development and characterization of a helicon plasma source under high magnetic field with antenna immersed in vacuum. Plasma Sourc Sci Tech (2022). (in preparation).
20. Chen G, Arefiev AV, Bengtson RD, Breizman BN, Lee CA, Raja LL. Resonant power absorption in helicon plasma sources. Phys Plasmas (2006) 13(12):123507. doi:10.1063/1.2402913
21. Zhang Y, Heidbrink WW, Boehmer H, McWilliams R, Chen G, Breizman BN, et al. Spectral gap of shear Alfvén waves in a periodic array of magnetic mirrors. Phys Plasmas (2008) 15(1):012103. doi:10.1063/1.2827518
22. Lee CA, Chen G, Arefiev AV, Bengtson RD, Breizman BN. Measurements and modeling of radio frequency field structures in a helicon plasma. Phys Plasmas (2011) 18(1):013501. doi:10.1063/1.3533273
23. Chang L, Hole MJ, Caneses JF, Chen G, Blackwell BD, Corr CS. Wave modeling in a cylindrical non-uniform helicon discharge. Phys Plasmas (2012) 19(8):083511. doi:10.1063/1.4748874
24. Chang L, Breizman BN, Hole MJ. Gap eigenmode of radially localized helicon waves in a periodic structure. Plasma Phys Control Fusion (2013) 55(2):025003. doi:10.1088/0741-3335/55/2/025003
25. Thakur SC, Brandt C, Cui L, Gosselin JJ, Light AD, Tynan GR. Multi-instability plasma dynamics during the route to fully developed turbulence in a helicon plasma. Plasma Sourc Sci Technol (2014) 23(4):044006. doi:10.1088/0963-0252/23/4/044006
26. Breizman BN, Arefiev AV. Radially localized helicon modes in nonuniform plasma. Phys Rev Lett (2000) 84(17):3863–6. doi:10.1103/physrevlett.84.3863
27. Chang L. Preliminary computation of the gap eigenmode of shear alfvén waves on the LAPD. Chin Phys B (2018) 27(12):125201. doi:10.1088/1674-1056/27/12/125201
28. Chang L, Liu J, Yuan XG, Yang X, Zhou HS, Luo GN, et al. Helicon plasma in a magnetic shuttle. AIP Adv (2020) 10(10):105114. doi:10.1063/5.0013803
29. Ginzburg VL. The propagation of electromagnetic waves in plasmas. 2nd ed. Oxford, United Kingdom: Pergamon Press (1970).
30. Burin MJ, Tynan GR, Antar GY, Crocker NA, Holland C. On the transition to drift turbulence in a magnetized plasma column. Phys Plasmas (2005) 12(5):052320. doi:10.1063/1.1889443
31. Cui L, Ashourvan A, Thakur SC, Hong R, Diamond PH, Tynan GR. Spontaneous profile self-organization in a simple realization of drift-wave turbulence. Phys Plasmas (2016) 23(5):055704. doi:10.1063/1.4944819
32. Lundin R, Guglielmi A. Ponderomotive forces in cosmos. Space Sci Rev (2006) 127(1-4):1–116. doi:10.1007/s11214-006-8314-8
33. Khazanov GV, Khabibrakhmanov IK, Krivorutsky EN. Interaction between an alfvén wave and a particle undergoing acceleration along a magnetic field. Phys Plasmas (2000) 7(1):1–4. doi:10.1063/1.873778
34. Khazanov GV, Krivorutsky EN. Ponderomotive force in the presence of electric fields. Phys Plasmas (2013) 20(2):022903. doi:10.1063/1.4789874
35. Chang L. The impact of magnetic geometry on wave modes in cylindrical plasmas. PhD thesis. Canberra: Australian National University (2014).
36. Caneses JF, Blackwell BD. Collisional damping of helicon waves in a high density hydrogen linear plasma device. Plasma Sourc Sci Technol (2016) 25(5):055027. doi:10.1088/0963-0252/25/5/055027
37. Shamrai KP, Taranov VB. Volume and surface rf power absorption in a helicon plasma source. Plasma Sourc Sci Technol (1996) 5(3):474–91. doi:10.1088/0963-0252/5/3/015
38. Caneses JF, Blackwell BD, Piotrowicz P. Helicon antenna radiation patterns in a high-density hydrogen linear plasma device. Phys Plasmas (2017) 24(11):113513. doi:10.1063/1.5000848
39. Kao KC, Hockham GA. Dielectric-fibre surface waveguides for optical frequencies. Proc Inst Electr Eng (1966) 113(7):1151–8. doi:10.1049/piee.1966.0189
40. Maurer RD. Glass fibers for optical communications. Proc IEEE (1973) 61(4):452–62. doi:10.1109/proc.1973.9059
41. Chang L, Li QC, Zhang HJ, Li YH, Wu Y, Zhang BL, et al. Effect of radial density configuration on wave field and energy flow in axially uniform helicon plasma. Plasma Sci Technol (2016) 18(8):848–54. doi:10.1088/1009-0630/18/8/10
42. Chang L, Hu XY, Gao L, Chen W, Wu XM, Sun XF, et al. Coupling of RF antennas to large volume helicon plasma. AIP Adv (2018) 8(4):045016. doi:10.1063/1.5025510
43. Wang RL, Chang L, Hu XY, Ping LL, Hu N, Wu XM, et al. The role of second-order radial density gradient for helicon power absorption. Contrib Plasma Phys (2019) 59(9):e201900032. doi:10.1002/ctpp.201900032
44. Isayama S, Shinohara S, Hada T, Chen SH. Underlying competition mechanisms in the dynamic profile formation of high-density helicon plasma. Phys Plasmas (2019) 26(2):023517. doi:10.1063/1.5063506
45. Isayama S, Shinohara S, Hada T, Chen SH. Spatio-temporal behavior of density jumps and the effect of neutral depletion in high-density helicon plasma. Phys Plasmas (2019) 26(5):053504. doi:10.1063/1.5093920
46. Samm U. Plasma-wall interaction in magnetically confined fusion plasmas. Fusion Sci Tech (2008) 53(2T):223–8. doi:10.13182/fst08-a1708
47. Houshmandyar S, Scime EE. Ducted kinetic alfvén waves in plasma with steep density gradients. Phys Plasmas (2011) 18(11):112111. doi:10.1063/1.3662113
48. Caneses JF. Helicon wave propagation and plasma equilibrium in high-density hydrogen plasma in converging magnetic fields. PhD thesis. Canberra, Australia: Australian National University (2015). p. 175.
49. Gurnett DA, Bhattacharjee A. Introduction to plasma physics with space and laboratory applications. Cambridge, United Kingdom: Cambridge University Press (2005).
Keywords: helicon plasma, blue-core, wave propagation, power deposition, wave guide
Citation: Chang L, Caneses JF and Thakur SC (2022) Wave propagation and power deposition in blue-core helicon plasma. Front. Phys. 10:1009563. doi: 10.3389/fphy.2022.1009563
Received: 02 August 2022; Accepted: 16 September 2022;
Published: 06 October 2022.
Edited by:
Amar Prasad Misra, Visva-Bharati University, IndiaReviewed by:
Qiang Qiang, Beijing Institute of Graphic Communication, ChinaMatthew Hole, Australian National University, Australia
Copyright © 2022 Chang, Caneses and Thakur. This is an open-access article distributed under the terms of the Creative Commons Attribution License (CC BY). The use, distribution or reproduction in other forums is permitted, provided the original author(s) and the copyright owner(s) are credited and that the original publication in this journal is cited, in accordance with accepted academic practice. No use, distribution or reproduction is permitted which does not comply with these terms.
*Correspondence: L. Chang, bGVpY2hhbmdAY3F1LmVkdS5jbg==
†ORCID: L. Chang, orcid.org/0000-0003-2400-1836; J. F. Caneses, orcid.org/0000-0001-6123-2081; S. C. Thakur, orcid.org/0000-0002-8422-2705
 L. Chang
 J. F. Caneses3†