 Zhou Jiang1
 Hao Jiang
95% of researchers rate our articles as excellent or good
Learn more about the work of our research integrity team to safeguard the quality of each article we publish.
Find out more
ORIGINAL RESEARCH article
Front. Phys. , 12 January 2022
Sec. Optics and Photonics
Volume 9 - 2021 | https://doi.org/10.3389/fphy.2021.820552
This article is part of the Research Topic Advances in Polarimetry and Ellipsometry: Fundamentals and Applications View all 14 articles
Since the Mueller matrix ellipsometer has been used as a highly accurate tool for thin film measurement, the error analysis and repeatability enhancement of such a tool are of great importance. The existence of the Poisson–Gaussian mixed noise and the random bias of the trigger signal in the optical measurement system may reduce the repeatability and accuracy of a measurement. Utilizing the probabilistic analysis, the random errors in the Mueller matrix measurements are quantified. A quantitative analysis on the instrument matrix has been carried out to assess the individual effects for different error sources. We proposed a general optimal instrument matrix which is capable of minimizing the estimation variance for both Gaussian additive noise and Poisson shot noise. Besides, a peak-matching algorithm is proposed to compress the repeatability errors due to the bias of the trigger signal and the limited sampling frequency. The effectiveness of the proposed methods is shown using both virtual simulations and experiments carried out on our self-developed instrument, which potentially paves a way to reduce the requirements on motor performance, acquisition card resolution, and trigger accuracy, which are critical to cost reduction.
Benefiting from the characteristics such as high-precision, fast, non-contact, easy-to-integrate, ellipsometer has been used as a practical standard tool in the semiconductor industry [1, 2], for optical properties measurements of thin films [3–5] and the thickness measurement of ultrathin oxide films [6]. Besides, there exists an increasing trend in the modern ellipsometry to deal with increasingly complex media such as biomedical specimens [7]. To achieve ultrahigh accuracy in a measurement, various systematic errors as well as random errors [8–12] have to be seriously considered.
Although an ellipsometer can provide ultrahigh measurement precision, it is always disturbed by detector noise (such as signal-independent Gaussian additive noise and signal-dependent Poisson shot noise) [13–16] and the bias of the trigger signal, which induce the random fluctuations and offsets of the intensity signals. In ellipsometric experiments, the major sources of the random errors are the inevitable thermally generated noise in light sources, detectors, and electronic circuits [17]. Usually, random noise can be reduced by signal averaging and can be measured by performing multiple identical runs and by calculating the mean and standard deviation [18].
Reducing the estimation variance is a feasible way to improve the measurement precision [14, 16, 19–23]. Up to now, many researchers have explored reducing the estimation variance of Mueller matrix elements as well as the ellipsometric parameters to improve the repeatability accuracy [13–16, 19–29], among which optimizing the instrument matrices is an effective way [15, 20, 22, 26]. The objective of these optimization methods may focus on minimizing the total variance of all the 16 Mueller matrix elements as well as the elements in the diagonal boxes for most of the applications such as the isotropic film thickness metrology. Since the elements on the off-diagonal blocks of such samples are zeros, the measurement precision only depends on the eight elements related to the ellipsometric parameters. Therefore, the optimal instrument matrix for all the 16 Mueller matrix elements could no longer be the best option for the accuracy enhancement [15].
In the instrumentation of the ellipsometer, trigger signals are usually used to start intensity acquisition. In addition to the random error sources mentioned previously that from the detector, there is another random error source that arises from the random bias of the trigger signals, which exhibits as the random offset of the initial azimuth of the wave plates. Such a random error due to the hardware constraints is mainly caused by unstable trigger signals and the resolution limitation of the acquisition board. Averaging the multiple measurements is a commonly used and effective method to reduce the timing repeatability error and various random errors in the existing ellipsometer data processing [30]. However, such method may distort the voltage data within the cycle when a random offset of the intensity signal exists and then degrades the accuracy of the measurement. Therefore, it is necessary to eliminate the random offset of the acquired signal.
In this article, first, we measured the Gaussian additive noise, the Poisson shot noise, and the signal drift caused by the random bias of the trigger signal, and then the three kinds of random errors are quantified using probabilistic analysis where the associated error model can be used for the simulation experiment. Second, a generalized random error propagation model is proposed to describe the transitive relation between the system parameters and the Mueller matrix elements, when the Gaussian additive noise, the Poisson shot noise, and the bias of the trigger signal exist in the instrument system. Then, the system matrices of the instrument are evaluated which make the estimation variance of the Mueller matrix elements minimum. At the same time, the random error caused by the bias of the trigger signal in the ellipsometer has rarely been studied seriously. So, an offset elimination method based on the peak-matching algorithm is proposed, with which the offset can be reduced by 4 times. Then, the random error model is fed into the proposed general error propagation model for verification. The results show that the estimated variance can be effectively reduced by the proposed method. Last, we use practical experiments to show the effectiveness of the proposed methods. The results show that the variance of the measured thickness of the standard silica is significantly reduced with the proposed methods applied.
Such a significant enhancement indicates that the requirements on motor performance, acquisition card resolution, and trigger accuracy can be reduced with the help of the proposed method, which may be highly valuable for the cost reduction of instrumentation.
Figure 1 illustrates a system layout of a single wavelength ellipsometer (SWE), which consists of three parts: a CW He–Ne laser (HRS015B 100-240VAC, Thorlabs, United States), a polarization state generator (PSG), and a polarization state analyzer (PSA). The light source is installed on an adjustment frame to precisely control the laser light path. The laser light transmits through an optical isolator (IO-2D-633-VLP, Thorlabs, United States) which prevents the interference of reflected light and is divided into two beams with an intensity ratio of 1:9 by a beam splitter (BS025, Thorlabs, United States). One of the beams enters a detector 1 (PDA36A2, Thorlabs, United States) directly for the elimination of the intensity fluctuations of the light source and the other enters the main optical path. After passing through a bandpass filter (FLH633-5, Thorlabs, United States) and being reflected on a mirror (64-013, Edmund, United States), the light incidents on a sample through the PSG at an angle of 65°. Then, the reflected light from the sample was modulated by the PSA and collected by the detector 2 (PDA36A2, Thorlabs, United States).
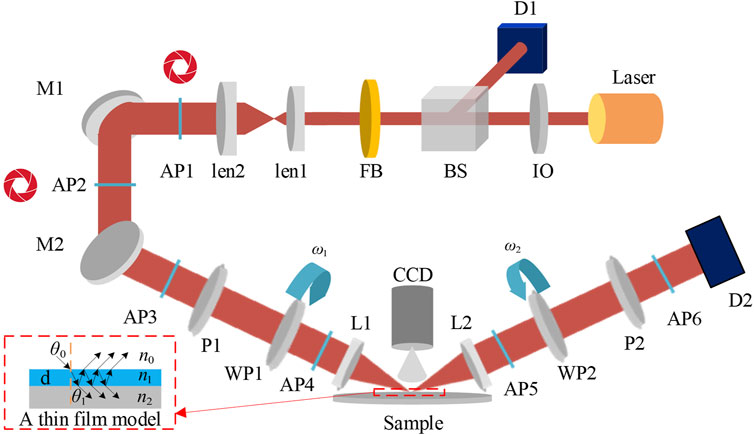
FIGURE 1. Critical components and beam path of the SWE. The ellipsometer is composed of a He–Ne laser light source (He–Ne laser), an optical isolator (IO), a beam splitter (BS), two detectors (D1 and D2), a narrowband filter (FB), a beam expander (BE)(GBE-03A, Thorlabs, United States), six apertures (AP1-AP6)(SM1D12CZ, Thorlabs, United States), two mirrors (M1 and M2), two polarizers (P1 and P2)(LPVISC100-MP2, Thorlabs, United States), two continuously rotating wave plates (WP1 and WP2)(WPQ10M-633, Thorlabs, United States), two focus lenses (L1 and L2), and a CCD camera (Mer-503-20 GM-P, DAHENG, China). Incident and reflected beams are denoted in red.
With the aforementioned configuration, the instrument can acquire the full Mueller matrix of the sample. The light path is controlled by six diaphragms with an adjustable aperture size. In order to fulfill the requirements of high-precision real-time measurement, a high-precision data acquisition card (USB6281, NI, United States) is required. In addition, our self-developed SWE is equipped with a micro-spot component for the measurement in specific situations.
It should be emphasized that in order to improve the measurement accuracy and stability of the instrument as much as possible, the azimuth angle of each optical component in the instrument and the gain coefficients of the photodetector can be optimized.
Figure 2 shows the SWE that we built it in the laboratory. Since we have adopted sophisticated mechanical design and manufacturing, the self-built SWE has high accuracy. Due to the unique optical path design, a series of factors such as light source fluctuation error, ambient light interference, incident angle tilt error, and improper installation error of the polarizer and wave plate, can be eliminated. In order to minimize the beam-wandering effect, we adopt the specific mechanical design. The pitching of the laser can be adjusted accurately by the adjusting device I. A dual-aperture III and dual-reflecting-mirror II design is introduced to ensure the accurate alignment of the laser in PSG. By adjusting the attitude of the reflecting mirrors to guide the laser pass through the small apertures, the accuracy of the alignment can be evaluated by observing the shape of the laser spot. In the PSA part, another pair of apertures V and a dual-axis moving stage IV are used. A camera is used to analyze the spot shape when the stage is moving. When the optical path is perfectly aligned, the small round spot will be achieved. In this way, the beam-wandering effect could be significantly compressed.
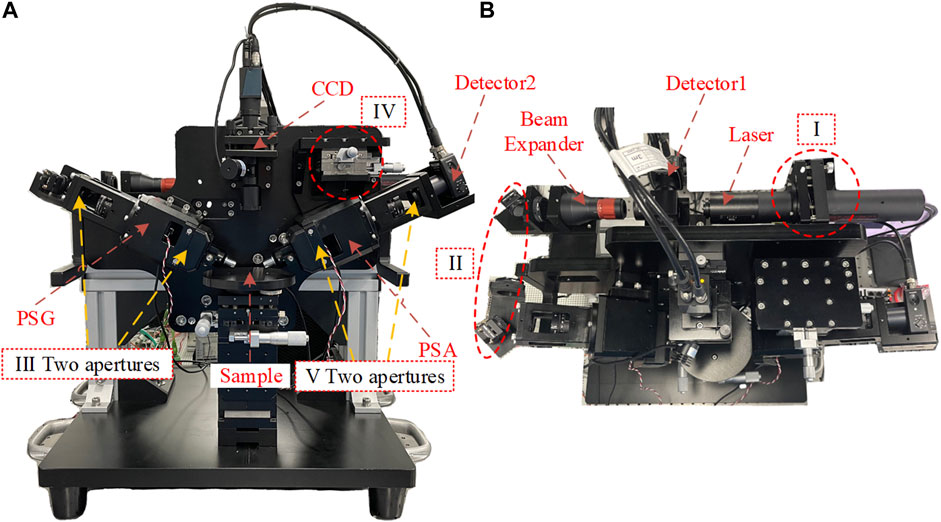
FIGURE 2. Instrumentation of SWE (A) front view and (B) top view.
When a thin film is measured, the light intensity matrix Idec received by the photodetector can be expressed by multiplying the matrix G of the PSG, the Mueller matrix MS of the sample, and the matrix A of the PSA.
The Stokes vector of the incident beam after passing through the PSG and the reflective beam after passing through the PSA are described as Eqs 2 and 3, respectively [31].
where the θ (θ = P, A) is the azimuth angle of the corresponding component in the PSG and PSA, and δy (y = 1, 2) is the retardation due to the weak linear birefringence of the polarizer material. The first and second compensators are driven by two servo hollow motors (AgilityRH, Applimotion, United States), and their fast axis azimuths are changing according to the relations: C1k = ω1tk + CS1 and C2k = ω2tk + CS2, where CS1 and CS2 are the initial azimuths of the compensators.
In a single measurement cycle, the matrix G and A consisted of the Stokes vector SPSGk and HPSAk that outputs polarized light from the PSG and PSA can be expressed as:
We use nonlinear regression intensity fitting algorithm (the Levenberg–Marquardt algorithm) to quickly and accurately extract the sample’s Mueller matrix and optical parameters from the measured periodic signal. To achieve high performance of the instrument, the system needs to be carefully calibrated [32]. The instrument was calibrated by carrying out the measurements on the standard silica film samples. Since the theoretical Mueller matrices of the sample could be calculated from the refractive indices (n, k), thicknesses d, and incidence angles θ of the measurements, the instrument can provide the measured Mueller matrices. Utilizing the intensity fitting method [33], the parameters of the system p = (d, θ, P, A, δ1, δ2, C1, C2) could be accurately determined. Since in the present work we mainly focus on the issues induced by Gaussian additive noise, Poisson shot noise, and the bias of the trigger signal, the details of the calibration could refer to [34]. Besides, we have developed a broadband MME and proposed a series of general methods on system calibration [34], wave plate alignment, and calibration [35–39] as well as depolarization correction [40] to ensure the performance of the developed instrument. The system parameter p can be obtained from the following equation:
where Imeas is the actual measurement intensity matrix, and Icalc is the theoretical intensity matrix. Ωp indicates the value range of the system parameter. Then, the system parameter MS can be obtained from the following equation:
where ΩM indicates the value range of the system Mueller matrix, Γ + Imeas is the Moore–Penrose pseudo-inverse of the covariance matrix of the measured intensity matrix, and Γ + Imeas=(Γ + Imeas ⋅Γ Imeas)−1⋅Γ T Imeas. Then, the thickness d can be obtained from the following equation:
where Ωd indicates the value range of the thickness, a* denotes the priori value of reconstruction and Mmeas is the measurement Mueller matrix and Mcalc is the theoretical Mueller matrix and Γ + Mmeas is the Moore–Penrose pseudo-inverse of the covariance matrix of the measured Mueller matrix and Γ + Mmeas=(Γ + Mmeas ⋅Γ Mmeas)−1⋅Γ T Mmeas.
In this article, Gaussian additive noise, Poisson shot noise, and the random bias of the trigger signal have become three of the most important factors affecting the repeatability accuracy. The variances of the final measurement results of the Mueller matrix element and thickness are influenced by these three factors seriously. The distribution of the three kinds of random errors must be calibrated respectively.
First of all, we measured the thermal noise and dark noise of the detectors at different gain levels which are typical Gaussian additive noise. Figure 3 shows the probability density function histogram of the Gaussian additive noise such as dark noise and thermal noise of the two detectors at 632.8 nm. The dark noise obeyed Gaussian distribution as expected. Then, the mean and variance can be obtained from the detected data through the Gaussian fitting. The generic signal independent noise (Gaussian additive noise) model can be described by
where P(x) is probability density function, x is the value of the dark noise, μ is the mean of x, δ is the standard deviation of x, and δ2 is the variance of x.
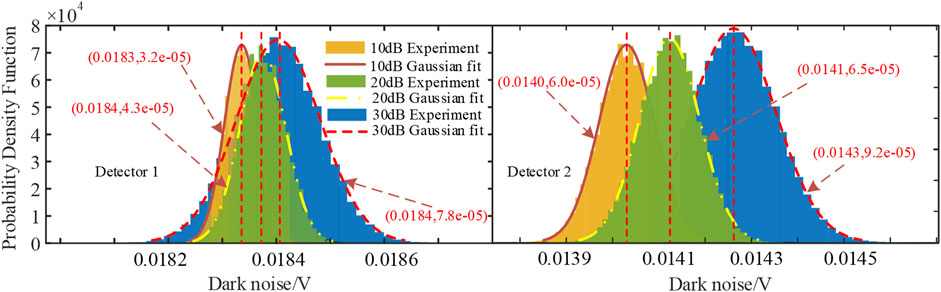
FIGURE 3. Calibration results of Gaussian additive noise of detector 1 and detector 2.
As shown in Figure 3, the bars represent the probability density function from the measurements, and the red line shows the Gaussian fit. The dark noise’s mean value of detector 1 is 0.0184 V when we take different gain levels. The variances of 10 dB, 20 dB, and 30 dB are 3.2e-05, 4.3e-05, and 7.8e-05, respectively. The dark noise’s mean values of detector 2 are 0.0140 V, 0.0141, and 0.0143 V for the gain levels 10 dB, 20 dB, and 30 dB, respectively. The variances of 10 dB, 20 dB, and 30 dB are 6.0e-05, 6.5e-05, and 9.2e-05, respectively.
The gain 30 dB is usually selected in the actual measurement. The variance and the mean values of the dark noise of the detector 2 are 9.2e-05 and 0.0143 V, respectively. The generic signal independent noise model is given by Eq. 6. We generate the intensity measurements in the simulation, and each measurement is corrupted by the noise-obeying Gaussian distribution model in the following section.
Second, the Poisson shot noise of detector 2 was calibrated separately as shown in Figure 4. A silicon photoelectric detector captures a periodic intensity produced by a rotating polarizer. The mean and variance of the Poisson shot noise are calculated after multiple measurements. Poisson shot noise will be modeled from the measured raw data.
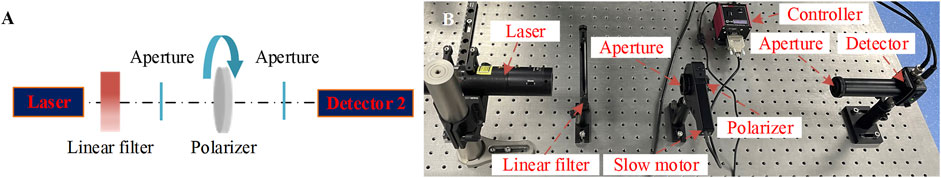
FIGURE 4. Solution for Poisson shot noise calibration of the detector (A) schematic diagram and (B) experiment setup.
As shown in Figure 5, the variance of the Poisson shot noise and the mean of the intensity conform the cubic nonlinear relation. A general analytical model is deduced to describe the Poisson shot noise as
where P(x) is the probability density function, PPoisson(x) is the probability density function of Poisson distribution, a, b, and c are the adjustment parameters, and λ is equal to the expected value of x when that is also equal to its variance. The maximum variances of intensity measurements are 3 × 10⁻⁴ and 9 × 10⁻⁴ for gain levels 20 dB and 30 dB, respectively.
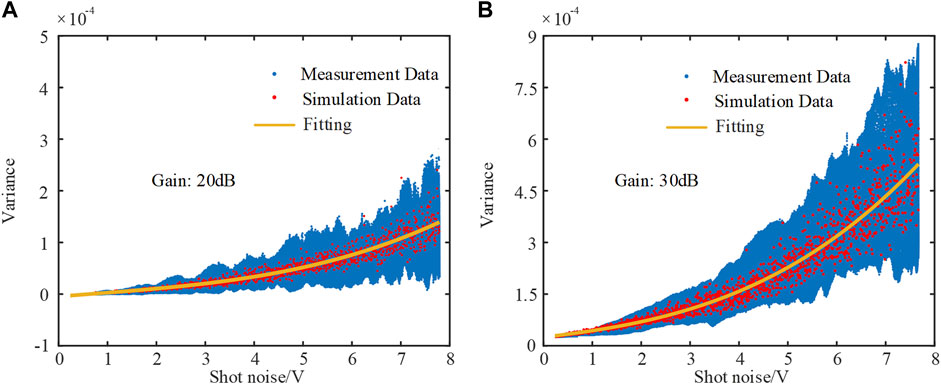
FIGURE 5. Calibration results of Poisson shot noise of detector 2 at (A) 20 dB and (B) 30 dB at 632.8 nm.
We use the proposed analytical model to generate the simulated shot noise and get its mean and variance respectively. Measured noise and normalized noise calculated by the general analytical model are shown in Figure 5, and the data match well. We generate the intensity measurements in the simulation, and each measurement is corrupted by the noise-obeying Poisson distribution model in the following section.
Last, usually due to the delay or advancement of the external trigger and the limited sampling frequency of the acquisition board, the initial point of each measurement will be offset, which causes the timing repeatability error. It can be observed that the period shift intensifies with the increase of measurement time. Such error is shown as the initial angle deviation of the two wave plates associated to the motor speed and sampling frequency.
The intensity data are collected in the same cycle each time after the acquisition board is triggered, and we take the measurement 30 times. Figure 6 shows that the 30 measurements result with 5,000 points in a cycle are superimposed together when the sampling frequency is 20 kHz. It can be observed that there is a staggered situation between cycles which is completely random due to the triggers start randomly and inaccurately. The period is staggered by about 2 ms (0.002 s), which causes the distortion of the data when these periodic data are taken on an average. Therefore, it is necessary to reduce the timing repeatability error through hardware or algorithm. The motors rotate the wave plate with the speed of 1,440°/s and 7,200°/s, so that the period shift will cause the offset of the initial azimuth of the wave plates. The relationship between the range of the initial azimuth deviation should be the same as the relationship between the motor speed because the range of the initial azimuth deviation is calculated by multiplying the motor speed and the offset time 2 ms. The random initial azimuth bias ranges of first and second wave plates are CS1±1.44° and CS2±7.2°, respectively.
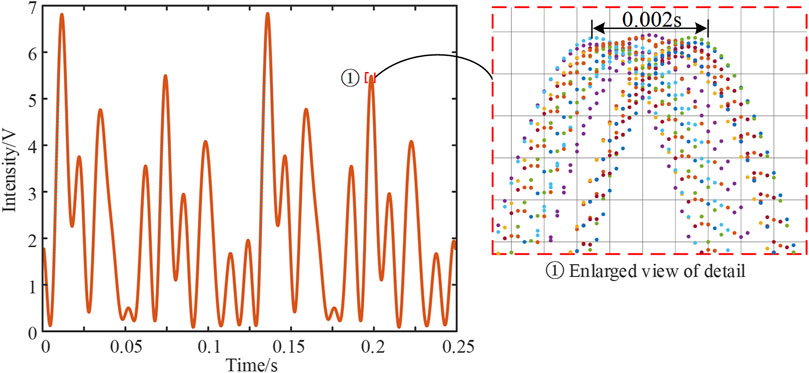
FIGURE 6. Time repeatability error due to the synchronization error of the external trigger and the limited sampling frequency of data acquisition.
The errors caused by Gaussian additive noise and Poisson shot noise are random errors that affect the repeatability accuracy of the system. Besides, the timing repeatability error caused by the limited sampling frequency and random trigger is a random error as well.
According to the system model and error propagation model, the variance caused by the random error can be calculated. First, we inject the instrument random error into the SWE system, and then we can calculate the variance of the Mueller matrix and the thickness of the film. In order to evaluate the effect of the random error on the measurement accuracy, we address the noise properties of MME by theoretical analysis and simulations and further determine the correlation between the random errors and the estimate variance of the measurement system for the optimization.
In this article, the data analysis for MME is the nonlinear regression iteration. Standard ellipsometry measures the ellipsometric parameters of the samples. We can estimate the ellipsometric parameters by measuring the Mueller matrix MS. Let us denote [15].
the 4 × 4 Mueller matrix of the sample. The ellipsometric parameters can be measured by an MME, which consists of a light source, a PSG with an instrument matrix G, and a PSA with an instrument matrix A. Equation 1 can be expressed in the form of vector as [14–16, 19]:
where k represents the tk-measured flux, and K is the number of sampling point.
where Vec (MS) is a 16-dimensional vector obtained by reading the Mueller Matrix MS in a lexicographic order and ⊗ denotes the Kronecker product. Gk and Ak are vectors, and they can be derived by Eqs. 2 and 3, respectively. S0 is the intensity of the light source, as
Since the initial fast axes of the retarders are C1initial and C2initial and K flux measurements are performed during the fundamental optical period π/ω with a rotating frequency ratio [41, 42] of 5ω:Nω, the fast-axes azimuth combinations of (C1k, C2k) can be determined as [13, 36].
We can denote the instrument matrix as
where the Vec(I) is the K-element vector of intensity measured by the detector 2, and T is the
When the measurements are disturbed by Gaussian additive noise, the estimation variance of each element of the measured Mueller matrix Vec (MS) can be denoted as [14].
where the variance is the function of (C1k, P, δ1, C2k, A, δ2, N) and σ2Gaussian, and we can observe the relationship between the variance and the variates from the equation.
When the measurements are disturbed by Poisson shot noise, the estimation variance of each element of the measured Mueller matrix Vec (MS) can be denoted as [14].
where
where the variance is the function of (C1k, P, δ1, C2k, A, δ2, Vec (MS)), and we can observe the relationship between the variance and the variates from the equation. Contrary to the case of Gaussian additive noise, we found that the estimation variance of Poisson shot noise is dependent on the Mueller matrix of the sample.
Besides, when the measurements are disturbed by the random bias of the trigger signal, the relationship between the sample matrices is obtained by the experimental measurement, and the actual Mueller matrix can be expressed as:
where the MS is the experimentally measured sample Mueller matrix, M0 is the true value of the sample Mueller matrix, ΔM is the overall measurement error of the sample Mueller matrix, μM is the Mueller matrix systematic error, and εM is the Mueller matrix random error.
The random bias of the trigger signal will cause the offset of the initial azimuth of the wave plate within an approximate angle. Then, we can think of the random error as a random combination of many system errors which is the deviation of the azimuth. The Mueller matrix systematic error can be denoted as
where the Q (p*) is the calibrated system matrix, ΔD is the system matrix error caused by system parameter deviation, rD is the system matrix error caused by the optical component characterization model, M0 is the true value of the sample Mueller matrix, JDp|p=p* is the Jacobian matrix of the system matrix D to the partial differential coefficient of the system parameter p at p=p*, and Δp is the system parameter deviation. We will quantitatively analyze the variance (Var [M0+μM]) caused by the errors on the measurement results by simulations.
In view of the aforementioned three kinds of random errors, optimization methods can be proposed to improve the repeatability accuracy of the instrument according to the error propagation equation. For the Gaussian additive noise and Poisson shot noise, the instrument matrix can be optimized to improve measurement results. For the bias of the trigger signal error, a method based on timing signal peak matching is proposed to reduce the offset of the wave plate’s azimuth.
From Eq. 15, we know that the estimation variance varies with (C1k, P, δ1, C2k, A, δ2, N) and σ2Gaussian. Then, the impact of the different dependent variables can be observed. First, P and A are assumed to be 0°, and the relationship between the estimation variance and (δ1, δ2) is shown in Figure 7A. It can be observed that the total estimation variance reaches the minimum when the δ1 = δ2 = 130.1°. Second, δ1 and δ2 are assumed to be 130.1°, and the relationship between the estimation variance and (P, A) is shown in Figure 7B. It can be observed that the total estimation variance is minimized when P is around 45.5°/−45.5° and A is around −45.5°/45.5°. The dark blue area in Figure 7B represents the values of P and A, which minimize the total variance estimation.
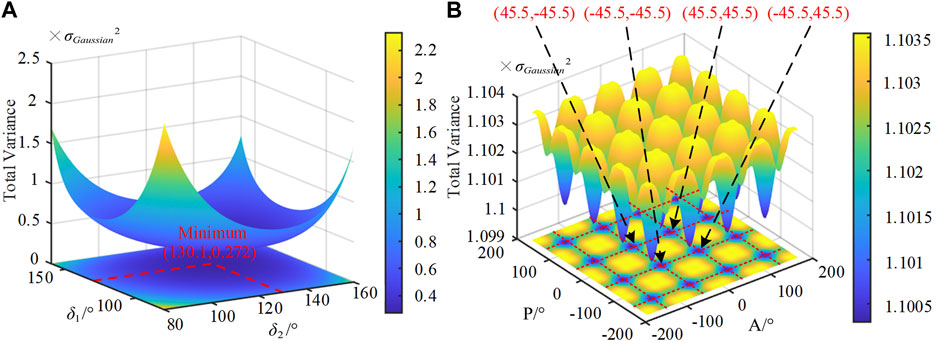
FIGURE 7. Calculated total estimation variances for Gaussian noise when (A) retardance δ1 ≠ δ2 (δ1, δ2)∈[-180°,180°], P = A = 0° and (B) retardance δ1 = δ2 = 130.1°, P≠A (P, A)∈[-180°,180°].
As shown in Figure 8A, the estimated variances are independent to the rotating frequency ratio of MME when the Gaussian additive noise is dominant. Then, we cannot reduce the variances by changing the rotation ratio of the motors. The estimated variance is also inversely proportional to the number of sampling K. As shown in Figure 8B, in the actual instrument configuration, we can find the function of variance and the number of flux measurements is variance = (426.8/K)⋅σ2Gaussian . With the number of K increasing, the variance reduces rapidly until K is 5,000.
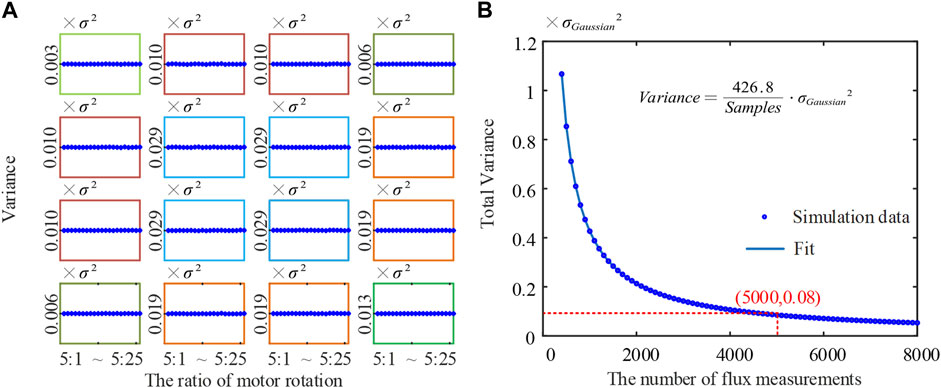
FIGURE 8. Theoretical analysis for Gaussian noise (A) estimation variances of Mueller matrix elements when the ratio of motors’ rotation speed is 5ω:Nω and (B) total estimation variances dependency on the number of sampling points.
From Eq. 16, we know that the estimated variance varies with the parameters (C1k, P, δ1, C2k, A, δ2, N) and the Mueller Matrix of samples Vec (MS). When the Poisson shot noise is dominant, the estimated variance is strongly correlated with the sample. Here, we use the standard silica films with different thicknesses as simulation samples to study the impact of instrument matrix parameters. As shown in Figure 9A, the 16 Mueller matrix elements vary with the thicknesses of the samples, and we can observe that the different Mueller matrix elements have different tendencies when the retardances of wave plates change. As shown in Figure 9B, we can observe that the total variance becomes larger as the thickness increases when the retarders are 90° (a quarter-wave plate). However, the thickness parameter of different standard silica samples is out of action when δ1 = δ2 = 130.1°, and the minimum of total variance can be obtained.
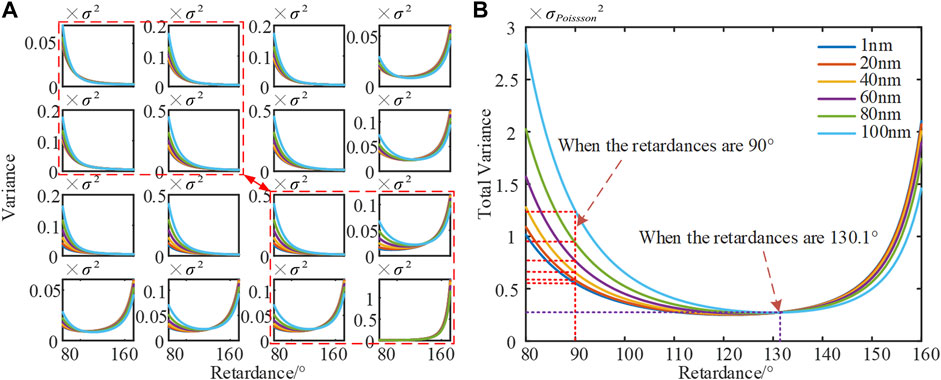
FIGURE 9. Theoretical analysis for Poisson shot noise (A) Mueller matrix elements estimation variances dependency on retardance for samples with different thicknesses and (B) total estimation variances dependency on retardance for samples with different thicknesses.
The random bias of the trigger signal will cause the random offset of the retarder’s azimuth. In order to eliminate the effect of the timing repeatability error, a peak-matching algorithm is proposed to relieve the strict requirements of initial angle compensatory and synchronicity of triggers in the instrument. When several periods of the intensity are collected, the signals are processed by a low-pass filter first to remove the high-frequency noise. Then, the peaks of the sampled periods will be picked out to record their sequence number. To avoid the data distortion, the peak should be included in one optical cycle. The reset of points for further process could be determined by taking the points before and after the peak sequence number continuously. Specifically, if we sampled M points in one optical cycle, we need to select M data including the peak. Without losing generality, suppose the peak sequence number is j, we can define an optical cycle is from the sampling points with sequence number of (j-i, M + j-i), where i could be an arbitrary number. By applying the same process on the data collected in each cycle, the peak in each cycle will be guaranteed with the same sequence, so that the distortion of the data could be eliminated.
Figure 10 shows a signal waveform after applying peak-matching algorithm. Comparing with the previous measurement result shown in Figure 6, the reduction of the timing repeatability error (staggers of the periods) can be clearly observed. As reported in Figure 10, the offset is reduced from 0.002 to 0.0005 s. After multiplying the motor speed by the offset time, we can calculate that the corresponding random initial azimuth bias ranges of the two wave plates are reduced from ±1.44° and ±7.2° to ±0.36° and ±1.8°, respectively.
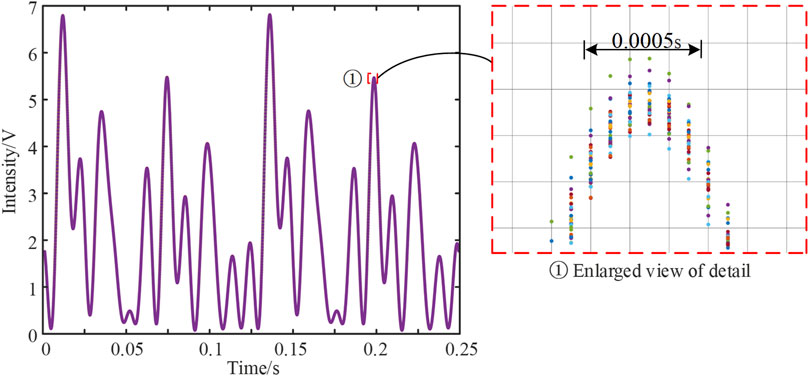
FIGURE 10. Signal waveform after using peak-matching algorithm.
First, the Gaussian additive noise attribution measured by the experiment in the previous work is added to the system. The influence on the standard deviations of Mueller matrix elements and thickness can be observed. As shown in Figure 11, the standard deviations of Mueller matrix elements and the thickness are obviously reduced when the instrument matrix is optimized, and the level of standard deviation fluctuation is about 10-5. The impact of Gaussian additive noise on the Mueller matrix elements is independent to the sample, and this phenomenon conforms to the theoretical expectation. However, the standard deviation of the calculated thickness increases slightly with the increase of the sample thickness.
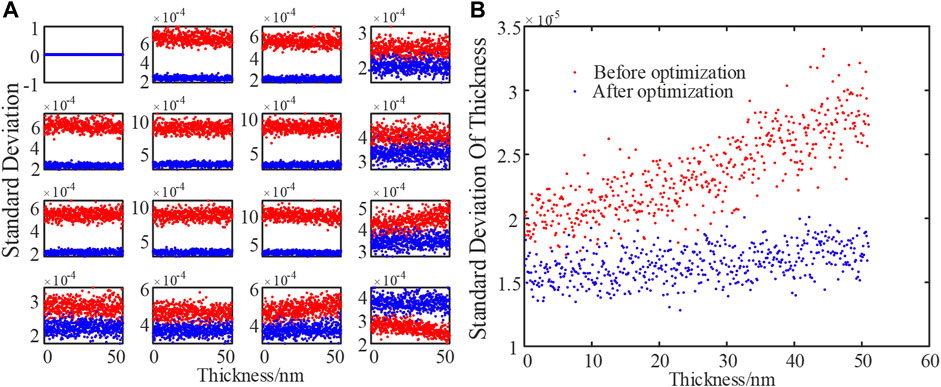
FIGURE 11. Simulation results for Gaussian noise (A) estimated standard deviation of Mueller matrix elements for the samples with different thicknesses and (B) thickness-dependent standard deviation of the measured thickness.
Second, the Poisson shot noise attribution measured by the experiment is added to the numerical system. The improvements of the repeatability in the Mueller matrix and the thickness measurements are shown in Figure 12. When the instrument matrix is optimized, the level of standard deviation fluctuation of the optimized simulation result is below 0.5 × 10⁻⁴. The standard deviation of the calculated thickness results increases slightly first and then falls with the increase of sample thickness.
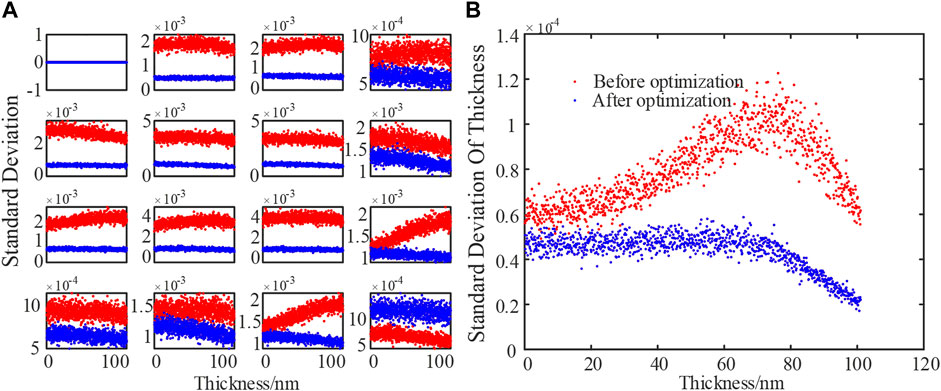
FIGURE 12. Simulation results for Poisson shot noise (A) estimated standard deviation of Mueller matrix elements for the samples with different thicknesses and (B) thickness-dependent standard deviation of the measured thickness.
Last, we set the sampling frequency as 20 Khz, then the rotation speed of the PSG motor and PSA motor are 1,440°/s and 7,200°/s, respectively. Moreover, the timing repeatability errors of the PSG motor and the PSA motor are randomly varying within the range of ±1.44° and ±7.2°, respectively. The standard deviation of the thickness fluctuates within the level of about 10-3. The statistical results are shown red in Figure 13. Compared to the red dot which stands for the standard deviations before optimization, the blue dots shown in Figure 13 show the clear error compression on the Mueller matrix and the thickness measurements when the proposed peak-matching algorithm was introduced. We can also observe that the error increases as the film thickness increases.
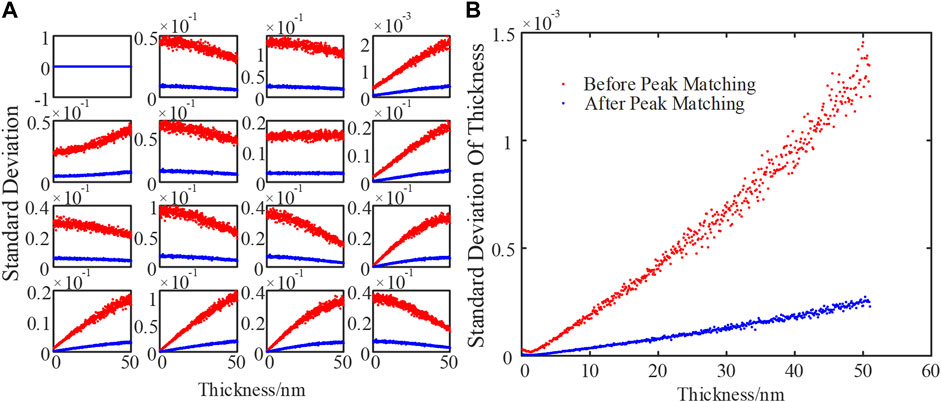
FIGURE 13. Simulation results for the random bias of the trigger signal (A) estimated standard deviation of Mueller matrix elements for the samples with different thicknesses and (B) thickness-dependent standard deviation of the measured thickness.
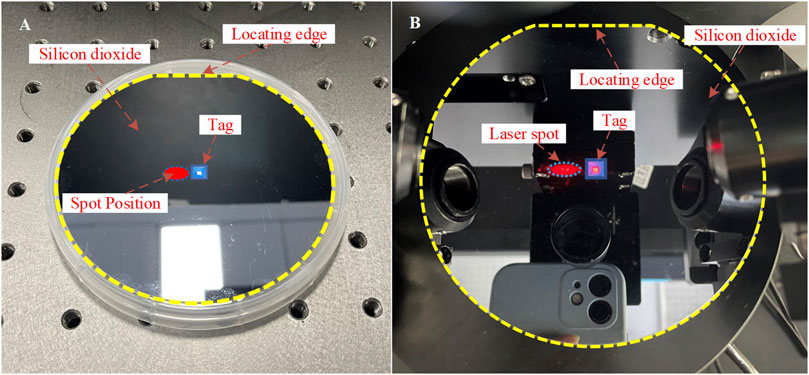
FIGURE 14. Diagram of the point positioning (A) silicon wafer and (B) in situ measurement.
As can be seen from Figure 13B, after optimizing the instrument matrix and taking the method of peak-matching algorithm, the repeatability accuracy can be increased by an order of magnitude.
To verify the validity of the proposed method, thin film measurement experiments on standard silicon dioxide film samples have been carried out. At first, a tag is attached to the center of the sample surface, whose edge is parallel to the locating edge of the sample. The measurements are carried out 30 times on the point next to the left edge of the tag. During the measurement, the sample is held by a vac-sorb pump installed on the sample stage to ensure no movement is introduced during the test. After changing the system configuration, the tag and the locating edge will be used to limit the spatial variance of the testing area. Then, the measurement will be carried out another 30 times. The standard deviation of the thicknesses will be calculated, and the result of the two tests will be compared to evaluate the effectiveness of the proposed method.
Three different thickness silicon dioxide films are prepared first, whose nominal thicknesses are about 2, 15, 55 nm (Standard Silicon Dioxide, Eoptics, China). Each standard silicon dioxide film is measured 30 times with our self-developed SWE. The Mueller matrix elements as well as the standard deviation of 30 measurements for each element can be obtained. The standard deviations of 16 measured Mueller matrix elements can be reduced to 1 × 10⁻⁴ when the proposed methods are applied. Besides, the thicknesses of each film are calculated with the algorithm represented by Eq. 8. It can be observed from Table 1 that the standard deviation of the thickness has been drastically reduced. For example, the measurement standard deviations for the measuring point of Sample 1, Sample 2, and Sample 3 have been reduced by 78.785, 55.779, and 79.781%, respectively.
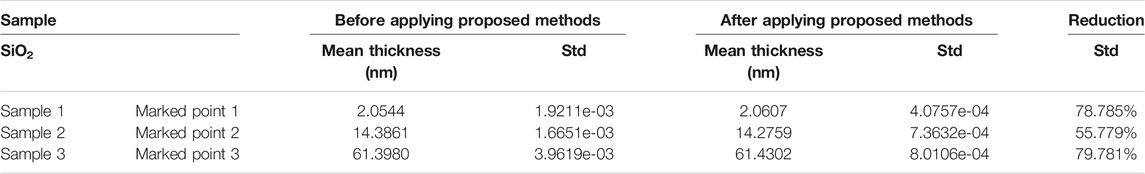
TABLE 1. Results of film thickness measurements.
In this work, an instrument matrix optimization method and a peak-matching algorithm have been proposed to improve the repeatability accuracy for ellipsometry. The analysis on the correlation between the random errors and the system configurations is carried out to search the optimal instrument matrix for film measurements. The estimation variances on individual Mueller matrix elements are derived analytically for Gaussian noise, Poisson noise, and the bias of the trigger signal. Numerical simulations show that the proposed method is robust and can dramatically improve the measurement repeatability accuracy. The experimental results show that the proposed method can significantly compress the standard deviation of the measured Mueller matrix elements and thickness. The results show that the proposed method can reduce the standard deviations of measurement results by more than 50% on silicon dioxide films of different thickness measurements. The proposed methods pave a potential way to reduce the requirements on motor performance, acquisition card resolution, and trigger accuracy, which are critical to cost reduction.
The original contributions presented in the study are included in the article/supplementary material, further inquiries can be directed to the corresponding authors.
ZJ performed the instrumentation, simulation, experimental demonstration, and manuscript drafting; SZ performed the instrumentation, formulation, and manuscript editing; JL contributed to data processing and manuscript editing; QL contributed to result discussion and funding acquisition; HJ contributed to conceptualization, result discussion, manuscript review and editing, and funding acquisition; and SL contributed to result discussion, manuscript editing, and project administration.
This work was funded by the National Natural Science Foundation of China (51975232) and the National Key Research and Development Plan (Grant No. 2017YFF0204705).
The authors declare that the research was conducted in the absence of any commercial or financial relationships that could be construed as a potential conflict of interest.
All claims expressed in this article are solely those of the authors and do not necessarily represent those of their affiliated organizations, or those of the publisher, the editors, and the reviewers. Any product that may be evaluated in this article, or claim that may be made by its manufacturer, is not guaranteed or endorsed by the publisher.
1. Collins RW, Koh J, Fujiwara H, Rovira PI, Ferlauto AS, Zapien JA, et al. Recent Progress in Thin Film Growth Analysis by Multichannel Spectroscopic Ellipsometry. Appl Surf Sci (2000) 154-155:217–28. doi:10.1016/S0169-4332(99)00482-1
2. Fan Z, Tang Y, Wei K, Zhang Y. Calibration of Focusing Lens Artifacts in a Dual Rotating-Compensator Mueller Matrix Ellipsometer. Appl Opt (2018) 57:4145. doi:10.1364/AO.57.004145
3. Lee J, Rovira PI, An I, Collins RW. Rotating-Compensator Multichannel Ellipsometry: Applications for Real Time Stokes Vector Spectroscopy of Thin Film Growth. Rev Scientific Instr (1998) 69:1800–10. doi:10.1063/1.1148844
4. Aspnes DE, Studna AA. High Precision Scanning Ellipsometer. Appl Opt (1975) 14:220. doi:10.1364/AO.14.000220
5. Nguyen NV, Pudliner BS, An I, Collins RW. Error Correction for Calibration and Data Reduction in Rotating-Polarizer Ellipsometry: Applications to a Novel Multichannel Ellipsometer. J Opt Soc Am A (1991) 8:919. doi:10.1364/JOSAA.8.000919
6. Kim KJ. Review on the Thickness Measurement of Ultrathin Oxide Films by Mutual Calibration Method. Surf Interf Anal (2021) 7040. doi:10.1002/sia.7040
7. He C, He H, Chang J, Chen B, Ma H, Booth MJ. Polarisation Optics for Biomedical and Clinical Applications: a Review. Light Sci Appl (2021) 10:194. doi:10.1038/s41377-021-00639-x
8. Dong H, Tang M, Gong Y. Measurement Errors Induced by Deformation of Optical Axes of Achromatic Waveplate Retarders in RRFP Stokes Polarimeters. Opt Express (2012) 20:26649. doi:10.1364/OE.20.026649
9. Dai H, Yan C. Measurement Errors Resulted from Misalignment Errors of the Retarder in a Rotating-Retarder Complete Stokes Polarimeter. Opt Express (2014) 22:11869. doi:10.1364/OE.22.011869
10. West EA, Smith MH. Polarization Errors Associated with Birefringent Waveplates. Opt Eng (1995) 34(6):1574–80. doi:10.1117/12.202079
11. Boulbry B, Bousquet B, Jeune BL, Guern Y, Lotrian J. Polarization Errors Associated with Zero-Order Achromatic Quarter-Wave Plates in the Whole Visible Spectral Range. Opt Express (2001) 9:225. doi:10.1364/OE.9.000225
12. Miao Z, Tang Y, Wei K, Zhang Y. Random Error Analysis of Normalized Fourier Coefficient in Dual-Rotating Compensator Mueller Matrix Ellipsometer. Meas Sci Technol (2021) 32:125602. doi:10.1088/1361-6501/ac1a80
13. Jiang B, Meng K, Youcef-Toumi K. Quantification and Reduction of Poisson-Gaussian Mixed Noise Induced Errors in Ellipsometry. Opt Express (2021) 29:27057. doi:10.1364/OE.432793
14. Quan N, Zhang C, Mu T, Li S, You C. Estimation Variance of Dual-Rotating-Retarder Mueller Matrix Polarimeter in the Presence of Gaussian thermal Noise and Poisson Shot Noise. J Opt (2020) 22:025701. doi:10.1088/2040-8986/ab613c
15. Li X, Hu H, Wu L, Liu T. Optimization of Instrument Matrix for Mueller Matrix Ellipsometry Based on Partial Elements Analysis of the Mueller Matrix. Opt Express (2017) 25:18872. doi:10.1364/OE.25.018872
16. Twietmeyer KM, Chipman RA. Optimization of Mueller Matrix Polarimeters in the Presence of Error Sources. Opt Express (2008) 16:11589. doi:10.1364/OE.16.011589
17. El-Agez TM, El Tayyan AA, Taya SA. Rotating Polarizer-Analyzer Scanning Ellipsometer. Thin Solid Films (2010) 518:5610–4. doi:10.1016/j.tsf.2010.04.067
18. El-Agez TM, Taya SA. An Extensive Theoretical Analysis of the 1 : 2 Ratio Rotating Polarizer-Analyzer Fourier Ellipsometer. Phys Scr (2011) 83:025701. doi:10.1088/0031-8949/83/02/025701
19. Smith MH. Optimization of a Dual-Rotating-Retarder Mueller Matrix Polarimeter. Appl Opt (2002) 41:2488. doi:10.1364/AO.41.002488
20. Sabatke DS, Descour MR, Dereniak EL, Sweatt WC, Kemme SA, Phipps GS. Optimization of Retardance for a Complete Stokes Polarimeter. Opt Lett (2000) 25:802. doi:10.1364/OL.25.000802
21. Duan QY, Gupta VK, Sorooshian S. Shuffled Complex Evolution Approach for Effective and Efficient Global Minimization. J Optim Theor Appl (1993) 76:501–21. doi:10.1007/BF00939380
22. Goudail F. Noise Minimization and Equalization for Stokes Polarimeters in the Presence of Signal-dependent Poisson Shot Noise. Opt Lett (2009) 34:647. doi:10.1364/OL.34.000647
23. Lee S, Lee M, Kang M. Poisson-Gaussian Noise Analysis and Estimation for Low-Dose X-ray Images in the NSCT Domain. Sensors (2018) 18:1019. doi:10.3390/s18041019
24. Dinu M, Quochi F. Amplitude Sensitivity Limits of Optical Sampling for Optical Performance Monitoring. J Opt Networking (2002) 1:237–48.
25. Dai J, Goudail F, Boffety M, Gao J. Estimation Precision of Full Polarimetric Parameters in the Presence of Additive and Poisson Noise. Opt Express (2018) 26:34081. doi:10.1364/OE.26.034081
26. Li X, Liu T, Huang B, Song Z, Hu H. Optimal Distribution of Integration Time for Intensity Measurements in Stokes Polarimetry. Opt Express (2015) 23:27690. doi:10.1364/OE.23.027690
27. Anna G, Goudail F. Optimal Mueller Matrix Estimation in the Presence of Poisson Shot Noise. Opt Express (2012) 20:21331. doi:10.1364/OE.20.021331
28. Goudail F, Bénière A. Estimation Precision of the Degree of Linear Polarization and of the Angle of Polarization in the Presence of Different Sources of Noise. Appl Opt (2010) 49:683. doi:10.1364/AO.49.000683
29. Takakura Y, Ahmad JE. Noise Distribution of Mueller Matrices Retrieved with Active Rotating Polarimeters. Appl Opt (2007) 46:7354. doi:10.1364/AO.46.007354
30. Modine FA, Jellison GE, Gruzalski GR. Errors in Ellipsometry Measurements Made with a Photoelastic Modulator. J Opt Soc Am (1983) 73:892. doi:10.1364/JOSA.73.000892
31. Taya SA, El-Agez TM, Alkanoo AA. A Spectroscopic Ellipsometer Using Rotating Polarizer and Analyzer at a Speed Ratio 1:1 and a Compensator. Opt Quant Electron (2014) 46:883–95. doi:10.1007/s11082-013-9799-5
32. El-Agez TM, Taya SA. Development and Construction of Rotating Polarizer Analyzer Ellipsometer. Opt Lasers Eng (2011) 49:507–13. doi:10.1016/j.optlaseng.2011.01.005
33. Zhang S, Jiang H, Gu H, Chen X, Liu S. High-speed Mueller Matrix Ellipsometer with Microsecond Temporal Resolution. Opt Express (2020) 28:10873. doi:10.1364/OE.389825
34. Liu S, Chen X, Zhang C. Development of a Broadband Mueller Matrix Ellipsometer as a Powerful Tool for Nanostructure Metrology. Thin Solid Films (2015) 584:176–85. doi:10.1016/j.tsf.2015.02.006
35. Gu H, Chen X, Shi Y, Jiang H, Zhang C, Gong P, et al. Comprehensive Characterization of a General Composite Waveplate by Spectroscopic Mueller Matrix Polarimetry. Opt Express (2018) 26:25408. doi:10.1364/OE.26.025408
36. Gu H, Chen X, Zhang C, Jiang H, Liu S. Study of the Retardance of a Birefringent Waveplate at Tilt Incidence by Mueller Matrix Ellipsometer. J Opt (2018) 20:015401. doi:10.1088/2040-8986/aa9b05
37. Gu H, Chen X, Jiang H, Zhang C, Li W, Liu S. Accurate Alignment of Optical Axes of a Biplate Using a Spectroscopic Mueller Matrix Ellipsometer. Appl Opt (2016) 55:3935. doi:10.1364/AO.55.003935
38. Gu H, Chen X, Jiang H, Zhang C, Liu S. Optimal Broadband Mueller Matrix Ellipsometer Using Multi-Waveplates with Flexibly Oriented Axes. J Opt (2016) 18:025702. doi:10.1088/2040-8978/18/2/025702
39. Gu H, Liu S, Chen X, Zhang C. Calibration of Misalignment Errors in Composite Waveplates Using Mueller Matrix Ellipsometry. Appl Opt (2015) 54:684. doi:10.1364/AO.54.000684
40. Li W, Zhang C, Jiang H, Chen X, Liu S. Depolarization Artifacts in Dual Rotating-Compensator Mueller Matrix Ellipsometry. J Opt (2016) 18:055701. doi:10.1088/2040-8978/18/5/055701
41. Taya SA, El-Agez TM, Alkanoo AA. Rotating Polarizer, Compensator, and Analyzer Ellipsometry. Chin Phys. B (2013) 22:120703. doi:10.1088/1674-1056/22/12/120703
Keywords: Mueller matrix ellipsometer, thin film measurement, noise, error, repeatability
Citation: Jiang Z, Zhang S, Liu J, Li Q, Jiang H and Liu S (2022) Error Analysis for Repeatability Enhancement of a Dual-Rotation Mueller Matrix Ellipsometer. Front. Phys. 9:820552. doi: 10.3389/fphy.2021.820552
Received: 23 November 2021; Accepted: 16 December 2021;
Published: 12 January 2022.
Edited by:
Xiaoyong Hu, Peking University, ChinaReviewed by:
Chao He, University of Oxford, United KingdomCopyright © 2022 Jiang, Zhang, Liu, Li, Jiang and Liu. This is an open-access article distributed under the terms of the Creative Commons Attribution License (CC BY). The use, distribution or reproduction in other forums is permitted, provided the original author(s) and the copyright owner(s) are credited and that the original publication in this journal is cited, in accordance with accepted academic practice. No use, distribution or reproduction is permitted which does not comply with these terms.
*Correspondence: Qi Li, bGlxaUBuaW0uYWMuY24=; Hao Jiang, aGppYW5nQGh1c3QuZWR1LmNu
Disclaimer: All claims expressed in this article are solely those of the authors and do not necessarily represent those of their affiliated organizations, or those of the publisher, the editors and the reviewers. Any product that may be evaluated in this article or claim that may be made by its manufacturer is not guaranteed or endorsed by the publisher.
Research integrity at Frontiers
Learn more about the work of our research integrity team to safeguard the quality of each article we publish.