- Institute of Geotechnical Engineering, Southeast University, Nanjing, China
This work provides a three-dimensional discrete element simulation (DEM) model to study the air sparging technology. The simulations have taken into account the multi-phases of bubble (gas) - fluid (water) - soil (solid) particles. Bubbles are treated as discrete individual particles, with buoyancy and drag forces applied to bubbles and soil particles. The trajectory of each discrete bubble particle can be tracked using the discrete element model. It is found that the diffusion of the whole bubble is inverted conical though the motion behavior of a single bubble particle is random. Furthermore, the distribution of the radius of influence (ROI) is not uniform. The bubbles become more concentrated as in the center of the inverted cone. The number of bubbles dissipated from the water surface is normally distributed. The DEM simulation is a novel approach to studying air sparging technology that can provide us a deeper insight into bubble migration at the microscopic level.
1 Introduction
As human society evolves and the city scale expands, researchers are becoming more interested in environmental restoration and reuse of contaminated sites, owing to the increasing value of environmental protection and land re-utilization. In-situ remediation technology can repair contaminated soil without transporting them for remediation. Air sparging is one of the most efficient in-situ remediation strategies for the treatment of volatile organic contaminants (VOCs) among the numerous in-situ remediation technologies available. VOCs in soil pores are volatile, dissolved, adsorbed, and free, making it challenging to remove them by conventional methods. The air sparging method injects high-pressure gas into the soil, forcing VOCs to escape when the gas rises to the ground surface.
Air sparging is extremely complex since the motion of a huge number of air bubbles is chaotic. Understanding the mechanics of air flows under sparging conditions is conducive to the efficiency improvement of air sparging technology. For this purpose, laboratory tests in transparent tanks [1] or by colorimetric visualization methods using iron filings [2] have been performed. Marley et al. [3] indicated that air bubbles generated by the injection of air into the aquifer moved horizontally and vertically through the groundwater. Peterson et al. [2] observed “chamber flow” in the form of air bubbles or channels in fine to very fine-grained sands (grain diameter
Cundall and Stack proposed the discrete element method (DEM) for the first time in 1979 [6]. This numerical method is used to simultaneously investigate granular media behavior from macroscopic and microscopic perspectives [7–9]. In fluid-solid interaction simulations, DEM has been extensively applied. CFD-DEM coupling is a preferable option for coupling simulations that consider the flow field and flow velocity. For instance, Jiang et al. [10] employed a coupled CFD-DEM method to investigate the shear strength of methane hydrate-bearing sediments using an undrained biaxial shear test. Akhshik et al. [11] explored the cuttings transportation in the aerated mud drilling process for inclined annuli at downhole conditions with a CFD-DEM model. Liu et al. [12] also utilized it to investigate bubbling fluidized beds. DEM has also been applied to study bubble issues. Gao et al. [13, 14] employed DEM to investigate the particle capture by bubbles in the presence of electrical double layer repulsion. Sakai et al. [15–17] proposed the coarse grain model to a large-scale system, which uses coarse grain to describe the motions of the original system of several fine particles. A coarse-graining DEM for the complex shaped domain has been applied by Mori et al. [18] to model an arbitrary shape wall boundary in a gas-solid flow and has been validated by experimental tests, demonstrating that the method is capable of accurately modeling industrial gas-solid two-phase systems. Nevertheless, these investigations primarily focused on the movement and shape change of a single or several large bubbles. The overall motion of a large number of bubbles, which is the core of air sparging technology, is rarely explored. As the air sparging technology requires a large number of small spherical bubbles in a short time and previous literature has demonstrated that bubble particles can be simulated by DEM, the DEM method just satisfies the requirement of generating a huge number of bubble particles in a short time. Therefore, we apply DEM for the simulation of air sparging technology.
In this paper, our model considers three phases of the bubble (gas) - fluid (water)- soil (solid) particles. Bubbles are viewed as discrete individual particles. Bubbles and soil particles are subjected to buoyancy and drag forces. After being injected into soil particles, bubble particles moved upward to the liquid surface. Parametric studies have been carried out based on the validated model. The study systematically explores the air sparging angle under different conditions as well as the ROI using statistical analysis.
2 DEM Simulations
2.1 Contact Law
In this study, the software PFC 5.0 [19] was used for DEM simulations. The rolling resistance linear model was adopted [20, 21], in which the contact law considered the torque acting on the contacting parts to counteract the rolling motion. The air sparging model described in this study is in a hydrostatic environment. The effect of water has been applied to soil particles and bubble particles through drag and buoyancy force. As a result, the model only considers three types of contacts for solid-solid, solid-bubble, bubble-bubble. All of these three kinds of contact adopt the rolling resistance contact law, with distinct parameters for each contact. The specific parameters have been added to the manuscript.
The contact force and moment are updated as in Eq. 1 by the force-displacement law for the rolling resistance linear model,
where Fl is the linear force, and Fd is the dashop force. The linear force Fl includes the normal force Fn and the shear force Fs.
The normal force Fn is calculated by Eq. 2.
where kn is the normal stiffness, and gs is the surface gap between two particles.
The tangential force Fs is calculated by Eq. 3 in the non-sliding scenario.
where ks is the shear stiffness, and δs is the displacement increment of particles.
If particles slide, the tangential force Fs is calculated by Eq. 4:
where μ is the friction coefficient.
The rolling resistance moment Mr is incremented as:
where Δθb is the relative bend-rotation increment.
where kr is the rolling resistance stiffness, and ks is the shear stiffness.
The contact effective radius
The rolling resistance moment Mr is updated, but it cannot surpass the limiting torque Mlimit determined in Eq. 8.
where the rolling resistance coefficient μr corresponds to the tangent of the greatest angle of a slope on which the rolling resistance torque counterbalances the torque produced by gravity pulling on the particle.
2.2 DEM Model of Air Sparging Technology
The soil sample is generated in a box measuring 0.6 × 0.12 × 0.8 m. Soil particles were generated in the box using the RSA algorithm, and then the gravitational force was applied to the particles, causing the particles to settle down in the box. The soil sample was considered equilibrated when the average ratio of the unbalanced force magnitude is less than 10–5. The default soil particle size is 8 × 10⁻⁴ m. The effective modulus of soil particles is 50 MPa. The density of the soil particle is 1,650 kg/m3. The friction coefficient and rolling resistance coefficient of soil particles are 0.4 and 0.3, respectively.
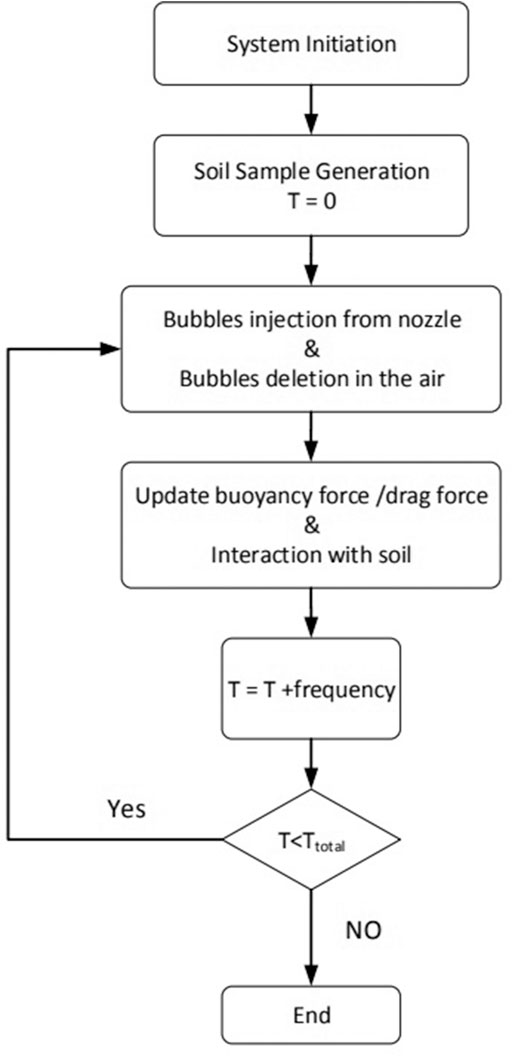
The water surface is set at the top of the box. A gas nozzle with the default dimension of 0.01 × 0.01 × 0.01 m is located at the center of the box bottom. The detail of the flow chart of air sparging technology is summarized in Figure 1. In each time step, bubble particles are injected out of the gas nozzle. When air bubbles move in the pore channel of soil particles, they are constantly subjected to three forces including gravity force, buoyancy force, and drag force, until they leave the water level and dissipate in the air. The bubble density is set as 1.5 kg/m3. The initial velocity of bubbles is set as 1.0 m/s. The frequency of bubble generation is 5.0 × 10⁻⁶, meaning that about 200 000 particles are generated per second. The contact modulus of bubbles is set as 105Pa, which is very small so that the allowable overlap between bubbles is high. The benefit of this parameter setting is that although the bubble particles remain spherical and cannot deform during the simulation process, they can pass through the pores between the soil particles that are smaller than the bubble size, realizing bubble migration in the soil particles. Because this simulation pays more attention to the overall migration trajectory of numerous bubbles, the deformation of a single bubble is not the focus of this study.
The buoyancy force Fb on the bubbule particle is calculate by
where ρw is the fluid density, V is the immersed ball volume, g is the gravity.
The drag force Fdrag is calculated by Eq. 10
where ηw is the fluid dynamic viscosity, which is set as 1.3 Ns/m2 in the simulations. R is the ball radius, v is the ball velocity vector.
The water surface is treated as a virtual wall in the program. If the algorithm identifies the interaction between bubble particles and the virtual wall of the water surface, the bubbles are eliminated. The program terminates when the running time is reached.
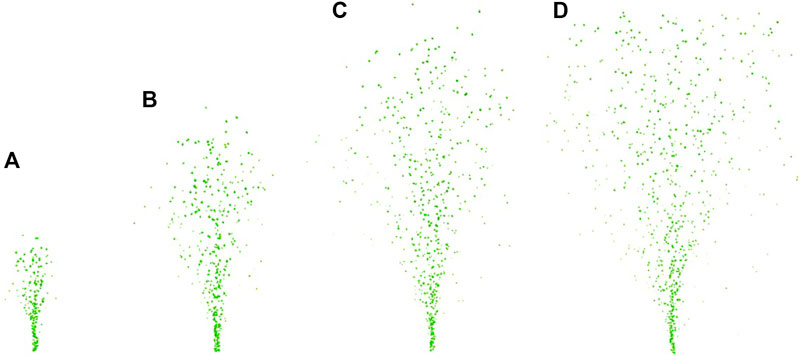
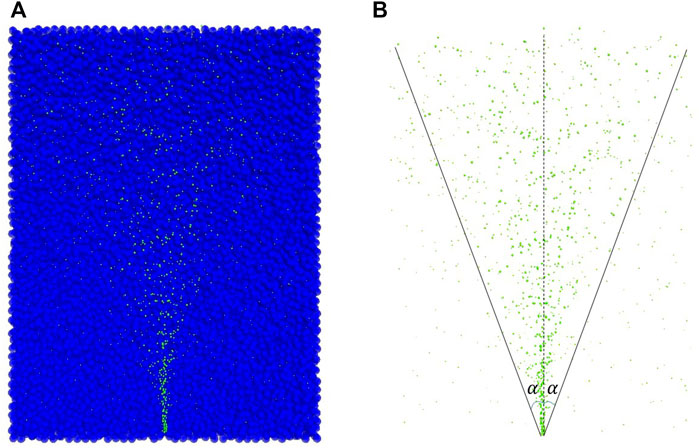
Figure 2 depicts the progression of bubbles generated by the aeration method from the beginning to a basically stable flow. The bubble beam is concentrated close together at first to penetrate the bottom layers of the soil. Then, bubbles gradually disperse due to the obstruction of soil particles, and the motion of bubbles gradually enters the second stage, in which bubbles disseminate in an inverted triangle. The half of the top angle of this inverted triangle α is called the aeration angle, which is an important parameter to evaluate the effectiveness of air sparging. Although the aeration area increases with the aeration angle, the effectiveness of air sparging diminishes as the ROI decreases. Figure 3A presents a DEM simulation of the entire bubble migration path into the soil particles, while Figure 3B depicts the aeration angle of the model. The model has been validated by experimental tests.

FIGURE 2. Bubble generation process by DEM: (A) T = 2 × 10⁻⁴s, (B) T = 4 × 10⁻⁴s, (C) T = 6 × 10⁻⁴s, (D) T = 8 × 10⁻⁴s.
3 Results and Discussion
The primary goal of aeration is to remove VOCs from soils during the rising process of bubbles. Therefore, ROI is a significant metric that indicates that as bubbles concentrate away from the liquid surface, the area becomes cleaner as more VOCs are eliminated. The concentration area that bubbles pass through is conducive to improving the efficiency of air sparging technology and arranging the position of aeration nozzles more rationally. Although the trajectory of a single bubble is complex, chaotic, and irregular, the overall motion law of all bubbles, just like the ultimate distribution of balls in the Galton board test, follows a certain statistical law. In the Galton board experiment, balls drop from the center of the upper edge of the Galton board. After innumerable nail collisions, it was piled up at the bottom. The final slot that a single ball is falling into is unintentional, but the majority of balls eventually fall into the center slots, with a tiny number of balls falling into slots on both sides [22–25]. Similar to balls moving in nails, bubbles in the spaces of soil particles eventually overflow the water in large quantities from the central area. By counting the final positions where bubbles depart the liquid surface, the concentrated regions where bubbles exit the water surface can be determined. The discrete element method can easily determine ROI by counting the number of bubbles passing through a unit area in a unit time, notwithstanding the difficulty of the experiment.
Take the parameter porosity of the soil sample as an example. As we know, bubbles travel through the pore channels of soil particles. The distribution of voids in soils significantly influences the ascending paths of bubbles. Many factors influence porosity, including soil compactness, soil particle size, soil material quality, among others. Since the pore channel of clay is too narrow for bubbles to pass through, the efficiency of the aeration method is relatively better in the sand than in the clay. However, if the pore channel is too large, the aeration angle will be diminished because the bubbles will travel through numerous primary pore channels, impairing the effect of air sparging. In this test, four soil particle samples with porosities of 0.30, 0.35, 0.40, and 0.45 were generated. The soil particles for each sample have a monosize of 10 mm. Each sample has particle numbers of 6,074, 5,454, 5,035, and 4,616, respectively. After 100 000 bubble particles have been ventilated, the aeration angle is determined. The aeration angle for each sample is about 27.6°, 25.3°, 22.1° and 19.6°, respectively. Therefore, the aeration angle decreases as the porosity increases.
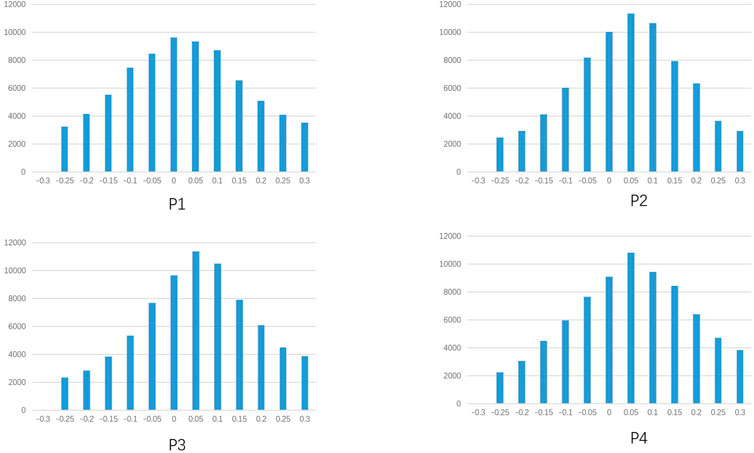
The statistical outcome of the final number of bubbles passing through the water level per unit area is illustrated in Figure 4. Each curve presents an uneven distribution of bubbles passing through the water surface. Each interval is 4 mm. The bubbles are concentrated in the middle of the surface, particularly between −0.08 and 0.08 m. The maximum ventilation volume appears in the interval of 0 ∼ 0.05 m, which is about six times larger than the minimum ventilation volume in the intervals of −0.3 ∼ −0.25 m or 0.25 ∼ 0.3 m. In other words, although aeration covers an area of −0.3 ∼ 0.3 m, the effective aeration area is substantially smaller. When comparing different samples, the distribution of bubble dissipation on the water surface is also different. A sample with a porosity of 0.3 has a more even final bubble distribution than samples with other porosities. In most bilateral intervals, the maximum outgassing capacity in the interval -0.05–0 m is three times larger than the minimum outgassing capacity. As the porosity increases to 0.45, the maximum outgassing capacity increases considerably while the minimum outgassing capacity drops. The former is almost six times greater than the latter.

FIGURE 4. Number distribution of bubble dissipation on the water surface for soil samples with different porosities.
The above research shows that changes in porosity have varied effects on aeration angle and aeration efficiency. The aeration angle affects the area covered by aeration. The larger the aeration angle, the larger the area. At the same time, the uniformity of aeration changes when the aeration effect meets the normal distribution. Therefore, the aeration range of the actual effect is smaller than the range of the calculated aeration angle.
4 Conclusion
In this paper, the discrete element method is used to simulate the bubble motions in the aeration process, and the bubble region is verified using numerical statistics. It provides a novel perspective on the study of the aeration method. This study considers the coupling simulation of three phases of the bubble (gas) - fluid (water) - solid (soil) particles. The soil particles are simulated by particles and fixed in the positions. Bubbles are viewed as discrete individual particles with differing mechanical characters when compared to soil particles. The action of water on bubbles and soil particles equals the buoyancy and drag force exerted on them. Although the motion behavior of a single bubble particle is random, the diffusion of the entire bubble system is inverted conical. Moreover, ROI is not distributed evenly. The bubbles are more concentrated when they are closer to the ball center of the inverted cone bottom surface. The distribution of bubble number satisfies the normal distribution. Porosity is an important factor that influences the effectiveness of air sparging. As the porosity grows, air bubbles move much more freely in the pore channel. The aeration angle affects the area covered by aeration. The larger the aeration angle, the larger area is covered. Meantime, the uniformity of aeration is different when the aeration effect satisfies the normal distribution. Therefore, the aeration area of the actual effect is smaller than the range of the calculated aeration angle. The numerical simulation of the aeration method provides guidance for engineering practice.
Data Availability Statement
The raw data supporting the conclusions of this article will be made available by the authors, without undue reservation.
Author Contributions
KW, Methodology, Writing—Original Draft; ZL, Validation, Writing—Review; Editing; ZBL, Conceptualization, Resources; SYL, Supervision.
Funding
We gratefully acknowledge the financial support provided by National Natural Science Foundation of China NO. 41 877 240 and NO. 51 608 112, and Project of Jiangsu Province Transportation Engineering Construction Bureau CX-2019GC02.
Conflict of Interest
The authors declare that the research was conducted in the absence of any commercial or financial relationships that could be construed as a potential conflict of interest.
Publisher’s Note
All claims expressed in this article are solely those of the authors and do not necessarily represent those of their affiliated organizations, or those of the publisher, the editors and the reviewers. Any product that may be evaluated in this article, or claim that may be made by its manufacturer, is not guaranteed or endorsed by the publisher.
References
1. Ji W, Dahmani A, Ahlfeld DP, Lin JD, Hill E. Laboratory Study of Air Sparging: Air Flow Visualization. Ground Water Monit Rem (1993) 13(4):115–26. doi:10.1111/j.1745-6592.1993.tb00455.x
2. Peterson JW, Murray KS, Tulu YI, Peuler BD, Wilkens DA. Air-flow Geometry in Air Sparging of fine-grained Sands. Hydrogeology J (2001) 9:168–76.
3. Marley MC, Hazebrouck DJ, Walsh MT. The Application of In Situ Air Sparging as an Innovative Soils and Ground Water Remediation Technology. Ground Water Monit Rem (1992) 12(2):137–45. doi:10.1111/j.1745-6592.1992.tb00044.x
4. McCray JE, Falta RW. Defining the Air Sparging Radius of Influence for Groundwater Remediation. J Contaminant Hydrol (1996) 24:25–52. doi:10.1016/0169-7722(96)00005-8
5. Yao M, Kang X, Zhao Y, Qin C, Yang Y, Li B. A Mechanism Study of Airflow Rate Distribution within the Zone of Influence during Air Sparging Remediation. Sci Total Environ (2017) 609:377–84. doi:10.1016/j.scitotenv.2017.07.169
6. Cundall PA, Strack ODL. A Discrete Numerical Model for Granular Assemblies. Géotechnique (1979) 29:47–65. doi:10.1680/geot.1979.29.1.47
7. O’Sullivan C. Particulate Discrete Element Modelling. Boca Raton, Florida, USA: CRC Press (2011).
8. Wu K, Liu S, Sun W, Rémond S. Dem Study of the Shear Behavior and Formation of Shear Band in Biaxial Test. Adv Powder Technol (2020) 31:1431–40. doi:10.1016/j.apt.2020.01.016
9. Wu K, Rémond S, Abriak N, Pizette P, Becquart F, Liu S. Study of the Shear Behavior of Binary Granular Materials by Dem Simulations and Experimental Triaxial Tests. Adv Powder Technol (2017) 28:2198–210. doi:10.1016/j.apt.2017.05.027
10. Jiang M, Shen Z, Zhou W, Arroyo M, Zhang W. Coupled Cfd-Dem Method for Undrained Biaxial Shear Test of Methane Hydrate Bearing Sediments. Granular Matter (2018) 20:63. doi:10.1007/s10035-018-0826-x
11. Akhshik S, Rajabi M. Cfd-dem Modeling of Cuttings Transport in Underbalanced Drilling Considering Aerated Mud Effects and Downhole Conditions. J Pet Sci Eng (2018) 160:229–46. doi:10.1016/j.petrol.2017.05.012
12. Liu D, van Wachem B. Comprehensive Assessment of the Accuracy of Cfd-Dem Simulations of Bubbling Fluidized Beds. Powder Technol (2019) 343:145–58. doi:10.1016/j.powtec.2018.11.025
13. Gao Y, Evans GM, Wanless EJ, Moreno-Atanasio R. DEM Simulation of Single Bubble Flotation: Implications for the Hydrophobic Force in Particle-Bubble Interactions. Adv Powder Technol (2014) 25:1177–84. doi:10.1016/j.apt.2014.05.020
14. Gao Y, Evans GM, Wanless EJ, Moreno-Atanasio R. Dem Modelling of Particle-Bubble Capture through Extended Dlvo Theory. Colloids Surf A: Physicochemical Eng Aspects (2017) 529:876–85. doi:10.1016/j.colsurfa.2017.06.082
15. Sakai M, Takahashi H, Pain CC, Latham J-P, Xiang J. Study on a Large-Scale Discrete Element Model for fine Particles in a Fluidized Bed. Adv Powder Technol (2012) 23:673–81. doi:10.1016/j.apt.2011.08.006
16. Sakai M, Yamada Y, Shigeto Y, Shibata K, Kawasaki VM, Koshizuka S. Large-scale Discrete Element Modeling in a Fluidized Bed. Int J Numer Meth Fluids (2010) 64:1319–35. doi:10.1002/fld.2364
17. Sakai M, Koshizuka S. Large-scale Discrete Element Modeling in Pneumatic Conveying. Chem Eng Sci (2009) 64:533–9. doi:10.1016/j.ces.2008.10.003
18. Mori Y, Wu C-Y, Sakai M. Validation Study on a Scaling Law Model of the Dem in Industrial Gas-Solid Flows. Powder Technol (2019) 343:101–12. doi:10.1016/j.powtec.2018.11.015
19.Itasca. Pfc 3d Manual. Report. Itasca: PFC5.0 Documentation. U.S.Minneapolis: Consulting Company (2010).
20. Iwashita K, Oda M. Rolling Resistance at Contacts in Simulation of Shear Band Development by Dem. J Eng Mech (1998) 124(3):285–92. doi:10.1061/(asce)0733-9399(1998)124:3(285)
21. Ai J, Chen J-F, Rotter JM, Ooi JY. Assessment of Rolling Resistance Models in Discrete Element Simulations. Powder Technol (2011) 206:269–82. doi:10.1016/j.powtec.2010.09.030
22. Mat Daud AA. Mathematical Modelling and Symbolic Dynamics Analysis of Three New Galton Board Models. Commun Nonlinear Sci Numer Simulation (2014) 19(10):3476–91. doi:10.1016/j.cnsns.2014.03.011
23. Smirnov KN, Shpigun OA. Transverse Dispersion in Ordered Pillar Arrays as a Markov Chain: Extension of the Galton-Board Model. J Chromatogr A (2015) 1375:27–32. doi:10.1016/j.chroma.2014.11.065
24. Leitner M, Leubner MP, Vörös Z. Creating Kappa-like Distributions from a Galton Board. Physica A: Stat Mech its Appl (2011) 390(7):1248–57. doi:10.1016/j.physa.2010.11.044
Keywords: DEM, multi-phases, air sparging, bubbles, normal distribution
Citation: Wu K, Li Z, Liu Z and Liu S (2022) A 3D DEM Model for Air Sparging Technology in the Saturated Granular Soils. Front. Phys. 9:812413. doi: 10.3389/fphy.2021.812413
Received: 10 November 2021; Accepted: 15 December 2021;
Published: 07 January 2022.
Edited by:
Wei Wang, Hohai University, ChinaReviewed by:
Shengnian Wang, Nanjing Tech University, ChinaShunying Ji, Dalian University of Technology, China
Copyright © 2022 Wu, Li, Liu and Liu. This is an open-access article distributed under the terms of the Creative Commons Attribution License (CC BY). The use, distribution or reproduction in other forums is permitted, provided the original author(s) and the copyright owner(s) are credited and that the original publication in this journal is cited, in accordance with accepted academic practice. No use, distribution or reproduction is permitted which does not comply with these terms.
*Correspondence: Zan Li, bGl6YW5Ac2V1LmVkdS5jbg==
 Kai Wu
 Zan Li
 Zhibin Liu
