- 1State Key Laboratory of Quantum Optics and Quantum Optics Devices, Institute of Laser Spectroscopy, Shanxi University, Taiyuan, China
- 2Collaborative Innovation Center of Extreme Optics, Shanxi University, Taiyuan, China
- 3School of Science, North University of China, Taiyuan, China
- 4National Energy R and D Center of Petroleum Refining Technology, Beijing, China
- 5Key Laboratory of Atomic and Molecular Physics and Functional Material of Gansu Province, College of Physics and Electronic Engineering, Northwest Normal University, Lanzhou, China
Through the theoretical simulation and analysis of the whole process of laser ablating target and producing plasma with high spatio-temporal resolution, it is helpful for people to gain a more complete understanding of the ablation process of target and the evolution process of plasma parameters, which has an important guiding role for the improvement and optimization of laser ablation technology. Alloys are commonly used in daily life, but there are few researches on laser-induced alloy targets at present. Therefore, based on the thermal model of laser ablation and the two-dimensional axisymmetric multi-species hydrodynamic model, the process of laser ablating Al-Mg alloy under atmospheric pressure argon is theoretically simulated, and the ablation process of alloy target and the spatio-temporal evolution results of plasma parameters under different laser irradiances are compared. At high laser irradiance, the melt and evaporation depth, laser energy absorption and plasma characterization parameters are much greater than those at low laser irradiance, and the species energy distribution at different laser irradiance also presents different trends. In addition, the velocity of different species is calculated according to the position-time diagram of the maximum emission intensity, and they expand at a constant speed during the studied time. These results can provide some theoretical guidance for the early application of laser-induced breakdown spectroscopy in metallurgy.
Introduction
The interaction between laser and matter and the resulting plasma have a wide range of application values, for example, laser-induced breakdown spectroscopy (LIBS) is based on the analysis of plasma emission spectra to achieve qualitative and quantitative analysis of material components. Due to its unique advantages of no sample preparation, little damage to samples, and simultaneous detection of multiple elements [1, 2], this technology has been applied in many fields, such as industrial process monitoring [3, 4], biomedical [5, 6], space exploration [7, 8], nuclear industry [9, 10], etc. Measurement accuracy is the key to quantitative analysis of LIBS, but the complexity of the interaction between laser and matter and plasma evolution process leads to the limitation in the improvement of LIBS measurement accuracy [11, 12]. The theoretical simulation and analysis of the whole process of laser ablating target and producing plasma in LIBS with high spatio-temporal resolution can help people to fully understand the ablation process of target and the evolution process of plasma parameters, which may point out the way to improve the completeness of LIBS experimental equipment and the spectral analysis model.
Many theoretical simulations of the plasma generated by laser ablation of targets have been carried out in the past, and a relatively simple target composed of single element is usually chosen for the purpose of facilitating the calculation. For example, A. A. Oumeziane et al. used a comprehensive numerical model including electron nonequilibrium and laser beam absorption to study the interaction ultraviolet laser and cooper target in helium [13]. V. Morel et al. described the interaction between ultra-short pulse laser (femtosecond, picosecond) and aluminum target in nitrogen using collisional radiative model, and analyzed the transition between equilibrium and nonequilibrium of aluminum plasma [14]. C. L. Fu et al. used one-dimensional numerical model to simulate the laser ablation process of Mo target in vacuum [15]. However, most substances exist in the form of compounds, and the differences of elements directly affect the expansion of species in the plasma. Therefore, the study of multi-species plasma is more important. There have been a number of studies on this aspect. For example, G. Colonna et al. used one-dimensional hydrodynamic model to describe the expansion of TiO plasma produced by laser ablation, and analyzed the spatio-temporal evolution of plasma parameters under different input conditions [16]. A. De Giacomo et al. used a state-to-state collisional radiative model to calculate the temporal evolution of plasma parameters when laser acted on TiO and TiO2 targets in vacuum or oxygen background gas [17]. I. B. Gornushkin et al. used the radiation dynamic model to simulate the expansion of SiC plasma in vacuum, compared the spatio-temporal evolution of plasma parameters under different initial conditions, and analyzed the changes of Si I and C II emission lines in the range of 280–290 nm [18]. Q. Min et al. used the extended radiation hydrodynamic model to study the radiation and dynamic properties of high valence ions (C VI、C V、S VI、S V) in SiC plasma under vacuum, and compared them with the experimental results [19]. To sum up, the above literatures deal with the targets containing non-metallic elements and the resulting plasma. At present, there is little research on the targets composed of multiple metal elements for laser ablation, but such targets have been used in many fields because of its unique characteristics.
In this paper, the interaction between laser with different irradiance and binary alloy target in argon gas is theoretically simulated and the species dynamics of various metal elements is analyzed so as to speed up the application of LIBS in process analysis in metallurgy.
Theoretical Model
Under the action of pulsed laser, the heating process of the target material is solved by one-dimensional heat conduction model [20]:
In the formula, cp, ρt, λt, α, and R mainly reflect the properties of the target material, and represent the specific heat, mass density, thermal conductivity, absorption coefficient and reflectivity, respectively. v is the evaporation rate of the target material, Tt is the temperature of the target, I is the laser irradiance after considering the plasma shielding effect, and z is the coordinate along the inward normal to the target surface.
For alloy targets, we consider the properties of different melting and boiling points of metal elements, and apply different heat conduction models at different stages. That is, when the target temperature reaches a relatively low boiling point, only the formation of relevant species of the element corresponding to this boiling point is considered, otherwise the formation of relevant species of two elements is considered.
When the temperature of the target material reaches the boiling point, vapor species are generated, and they continue to absorb laser energy and ionize to form plasma. The plasma parameters (ρ: the mass density, u: the plasma velocity, Te: the plasma temperature) can be described by a multi-species hydrodynamic model including mass, momentum and energy conservation equations (21)–(23):
Here ρi, udi correspond to the mass density, diffusion velocity of species i [22, 24], and p, e, q are respectively the local pressure, the specific internal energy of an ideal gas and the radiation power loss due to bremsstrahlung process [25]. λ, τ represent thermal conductivity, viscous stress tensor [25, 26] and αIB, αPI are the absorption coefficient of reverse bremsstrahlung and photoionization coefficient [13, 27].
The species diffusion velocity is found by inverting the matrix equation (22):
where ni, nk and n are the number density of species i, k and the total number density, Dik is the binary diffusion coefficient for species i and k.
The viscous stress tensor is determined by the following expression [26]:
where μ and μ′ are the viscosity and the dilatational viscosity, and δ is the Kronecker delta.
Under the condition of local thermal equilibrium, the species number density can be obtained by using the Saha equations and the charge conservation equations. Jump conditions [28] are used to correlate the parameters of the target and plasma. A thin vapor layer, namely Knudsen layer, is formed above the target and translational equilibrium is achieved by collisions within several mean free paths in this region. The forward difference method was used to solve the heat conduction equation, and the explicit Lax-Wendroff combined with the Flux-Corrected Transport method [29] was used to solve the hydrodynamics equations.
Results and Discussion
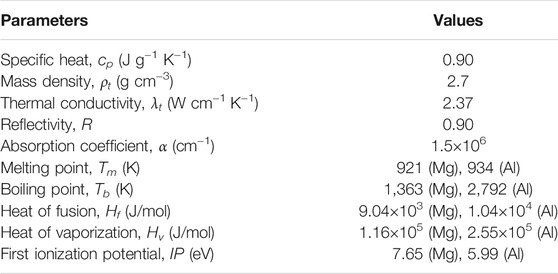
In this paper, we used the above model to simulate the interaction between laser and Al-Mg alloy in atmospheric pressure argon. The parameters of Al-Mg alloy target involved in the calculation are shown in table 1. The laser with spot radius of 0.5 mm and corresponding peak irradiances of 0.5 GW/cm2 and 5 GW/cm2 was used to ablate the alloy target. The ablation process of target and the plasma ablated from the binary alloy under two laser irradiances were compared. In addition, the velocity of different species was studied by using the position-time diagram of the maximum spectral line intensity. The parameters of the selected spectral lines of plasma radiation used for the study are shown in table 2, which are from the NIST database. The grid steps used below and above the target are respectively 1 μm and 0.01 mm, and the time step is 0.1 ns. They are determined by the Courant-Friedrichs-Lewy condition, and the grid step Δs and time step Δt satisfy the relationship: u·Δt/Δs <1. The six species involved were Mg I, Mg II, Al I, Al II, Ar I and e−. The above calculation algorithm was developed in MATLAB environment.
The plasma plume is formed in the first few nanoseconds of the pulsed laser, which will cause part of the energy to be absorbed when the subsequent laser passes through, that is, the plasma shielding phenomenon. The attenuated residual laser energy finally reaches the target surface. Figure 1A shows the evolution of the initial (solid line) and final (dashed line) laser irradiance at two different laser irradiances, in which red and black represent 0.5 GW/cm2 and 5 GW/cm2, respectively. Under these laser irradiances, the actual laser irradiance reaching the center of the target surface decreases after considering the plasma shielding effect. In order to better understand the attenuation degree, the attenuation rate curves of these laser irradiances are shown in Figure 1B. It can be seen that the laser energy is absorbed more by the plasma plume at high irradiance. Moreover, the laser irradiance is not affected until 10 ns, which indicates that the plasma plume is transparent to the laser during this period. At high laser irradiance, due to the serious plasma shielding effect near the peak irradiance, the laser energy reaching the target surface is very low, so the actual peak position moves forward obviously. At low laser irradiance, the actual peak position corresponds to the initial one.
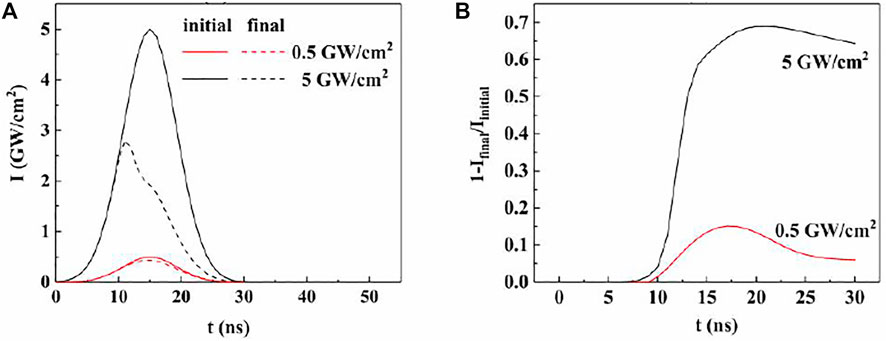
FIGURE 1. Evolution of the initial and final laser irradiance reaching the center of the target surface (A) and the attenuation rate of the laser irradiance (B) with time at different laser irradiance.
Heating, Melting and Vaporization of Target
Figure 2A shows the evolution of the melt (dashed line) and evaporation (solid line) depths at the center of the target over time under two laser irradiances, in which the red represents 0.5 GW/cm2 and the black represents 5 GW/cm2. During this period, the melt depth increases and the melt rate decreases at high irradiance, which is most obvious when there is no heat source at the end of the pulsed laser. At low irradiance, the melt depth first increases and then decreases, reaching the maximum value of 3 μm at 33 ns. The evaporation depth increases monotonously until the laser pulse stops ablation, and at this time, the evaporation rate at high irradiance is much faster than that at low irradiance. Figure 2B shows the profile of the evaporation depth of the target at the end of the pulsed laser (30 ns) under two laser irradiances, in which the dashed line represents 0.5 GW/cm2 and the solid one represents 5 GW/cm2. The ablation of the target mainly depends on the laser energy reaching the target surface. Because the laser spot is assumed to have a Gaussian distribution, different parts of the target are removed to varying degrees. The ablation amount at center of the spot is the most, and the evaporation depth at the center at high irradiance is about 4 times deeper than that at low irradiance.
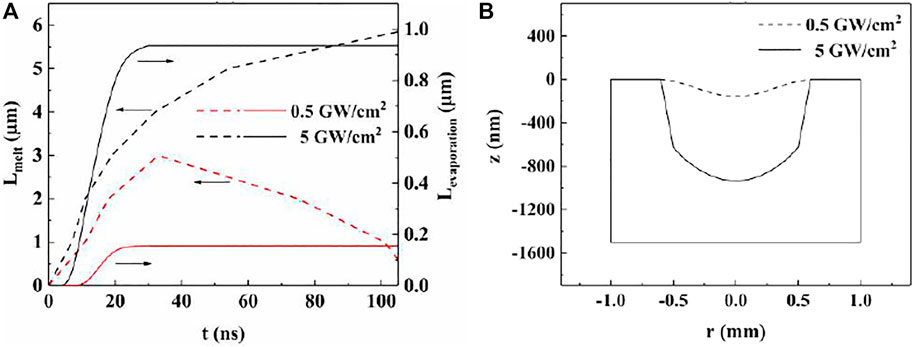
FIGURE 2. Temporal evolution of the melt and evaporation depths of target center (A) and profile of evaporation depth at the end of pulsed laser (B) at different laser irradiances.
Evolution of Plasma Parameters
The intensity of the emission line (u-l transition) of the plasma in local thermal equilibrium can be expressed as:
where C is a constant, U is the partition function, g, E, A, λ are respectively the degeneracy, energy of the upper level, transition probability and wavelength, and kB is the Boltzmann constant.
Using the above formula, we can get the emission line intensity of each species in the plasma. The temporal evolution of the maximum spectral line intensity of different species under the two laser irradiances is shown in Figure 3, in which the right side is the local enlarged picture of the left side, and different colors represent different species in the plasma. The scatter is the theoretical result, while the full line is the result of linear fitting, and all correlation coefficients R2 are greater than 0.98. The velocity of different species in the plasma is characterized by the slope of the position-time diagram of the maximum intensity of the spectral line. The velocity at high irradiance is obviously faster than that at low irradiance, and the trends of velocity between different species are the same under the two laser irradiances. It can also be seen from the figure that for magnesium and aluminum, the velocity of ions of the same element is faster than that of atoms, indicating that the higher the charge state is, the faster the velocity is. For the ions, the Coulomb acceleration also works [19], because the electrons have a high mobility and an electric field is formed between the electrons and the ions. According to the velocity formula, we know that the velocity of the species is inversely proportional to the square root of its mass. Therefore, in the same charge state, the velocity of the species with small relative atomic mass will be faster than that of the species with large relative atomic mass. The velocity of atoms satisfies the above relationship, but the velocity of aluminum ions is faster than that of magnesium ions. Moreover, the velocity of argon atoms is second only to that of aluminum ions. From table 2, we find that the species velocity in the plasma is directly related to the energy of the upper level, that is, the higher the energy of the upper level, the closer the species is to the leading edge of the plasma, where there is a higher temperature.
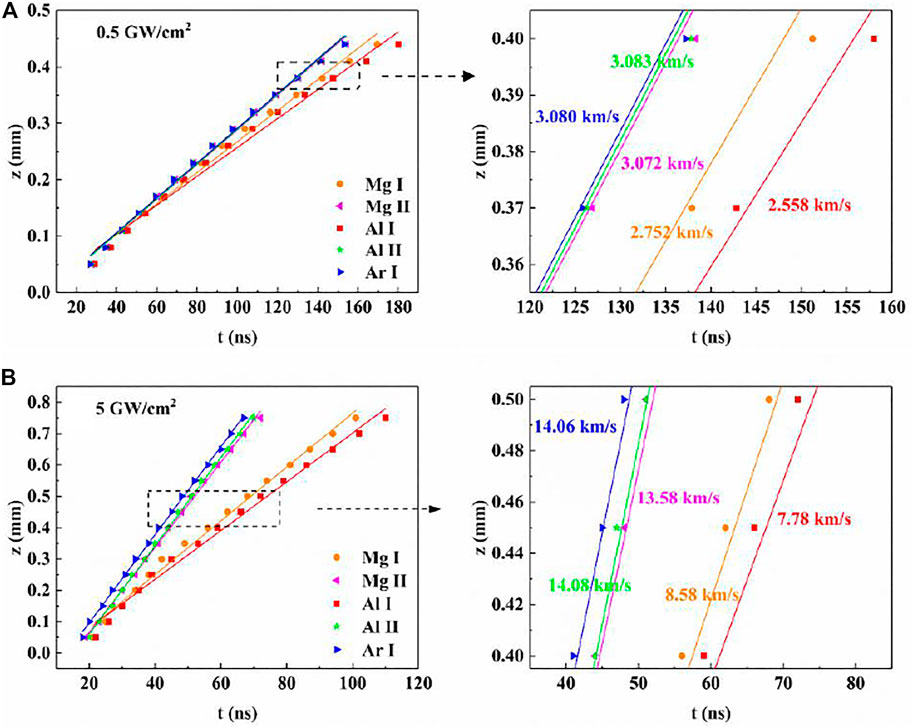
FIGURE 3. Position-time diagram of maximum line intensity of different species in the plasma at the peak laser irradiances of 0.5 GW/cm2 (A) and 5 GW/cm2 (B).
Figure 4 shows the evolution of species proportion with time on the symmetry axis at the position 0.5 mm away from the target plane under the two laser irradiances. The figure on the left shows the evolution curves of atoms, and the figure on the right shows the evolution curves of ions and electrons. Under the two laser irradiances, the background gas is gradually pushed forward with the extrusion of the vapor plasma, and the Ar species proportion decreases from the maximum value of one to almost 0. The ionization degree is higher at high laser irradiance. Expect for Ar species, the proportions of other species increase monotonically at low irradiance. At high irradiance, the difference is that the proportions of other species first increase rapidly to the peak, then gradually decrease and flatten. With the delay time, the plasma temperature decreases, the ionization degree also decreases, and proportions of the ions and electrons decrease slightly. In addition, the vapor species appear earlier at the same position away from the target because of the faster diffusion of species at high irradiance.
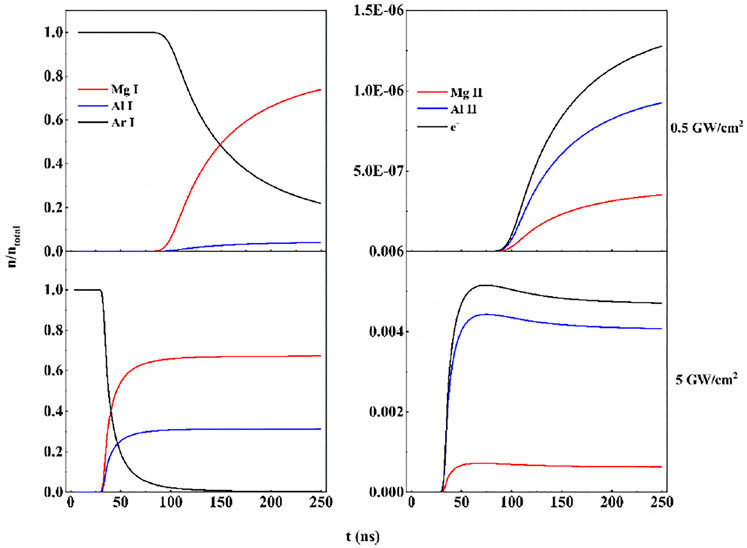
FIGURE 4. Temporal evolution of the species proportion on the symmetry axis at the position 0.5 mm away from the target plane at different laser irradiances.
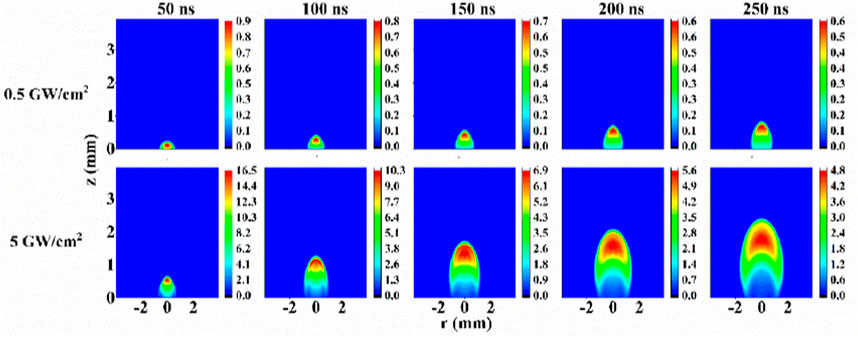
Plasma temperature is an important parameter closely related to plasma characteristics and emission line intensity. Figure 5 shows the contour map of plasma temperature with time under two laser irradiances, where it can be seen that the plasma temperature expands outward in a shape similar to a bullet. With the delay time, the plasma size increases and the temperature decreases. The plasma temperature gradient is large near the shock wave, and its maximum appears in the front of the plasma. At high irradiance, the plasma size and temperature increase significantly. Figure 6 shows the temporal evolution of plasma temperature at different positions from the target surface. At different positions above the target surface, the plasma temperature first reaches the maximum rapidly, and then decreases slowly. The temperature reduction section in the figure is fitted by an exponential function, with R2 of greater than 0.99. At the same laser irradiance, the farther away from the target, the slower the temperature decreases, and at the same position, the higher the laser irradiance, the faster the temperature drop. Moreover, the farther away from the target, the lower the peak temperature is due to the more energy lost by plasma expansion.
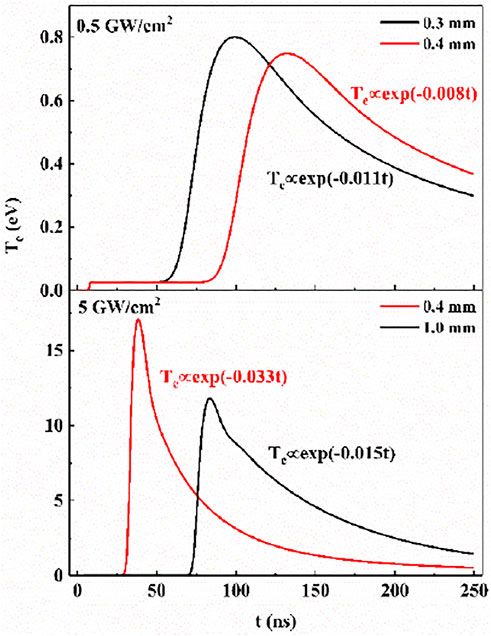
FIGURE 6. Temporal evolution of plasma temperature at different positions from the target surface at different laser irradiances.
Species Energy Distribution
The energy distribution of species is used in many fields, and the research on it is of great significance. Through the transformation between velocity and energy distribution, the energy distribution function with energy ε and angle θ between the research direction and the normal of the target can be expressed as follows [28]:
Where r is perpendicular to the direction of target normal, z is the coordinate along the outward normal to the target surface, ur and uz are the velocities corresponding to the r and z axes, and
Figure 7A shows the change of energy distribution of aluminum species along the normal direction of the target with time under two laser irradiance. At high irradiance, the width of energy distribution increases until 150 ns and then decreases, while at low irradiance, the width of energy distribution decreases with time. Figure 7B shows the energy distribution of aluminum species with angle under the two laser irradiances at the delay time of 250 ns. Since the difference between the lines is invisible at high laser irradiance, we give an enlarged view of the peak in the illustration. At high irradiance, with the increase of angle, the peak value first increases and then decreases, and reaches the maximum at 10°. At low irradiance, the peak value decreases as angle increases. The width of energy distribution decreases slightly at both irradiances. Under high laser irradiance, the ablation rate of the target is higher, and the plasma produced is faster and hotter, so the species have higher energy, and the width of energy distribution is much larger than that under low irradiance.
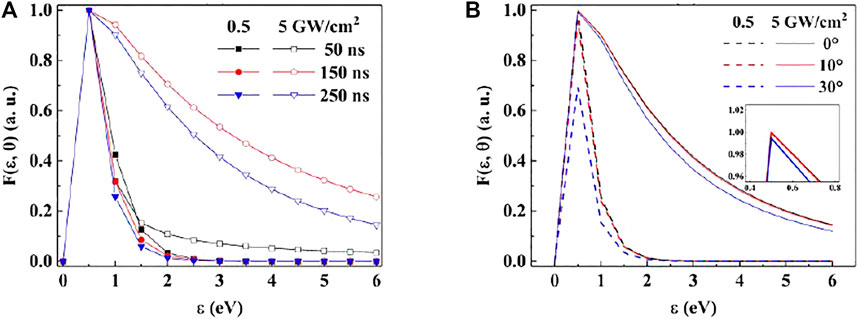
FIGURE 7. Energy distribution of aluminum species with time (A) and angle (B) at different laser irradiances.
Conclusion
In this paper, we use the thermal model of laser ablation and the two-dimensional axisymmetric multi-species hydrodynamic model to study the interaction between laser and Al-Mg alloy in argon, including the heating, melting, vaporization of alloy target and the generation and expansion of plasma. The ablation process of alloy target and the spatio-temporal evolution of plasma parameters under different laser irradiances are obtained. Our results show that the melt and evaporation depths of the target, the ionization degree and the plasma temperature at high laser irradiance are greater than those at low laser irradiance. Under different irradiances, the energy distribution of species also shows different trends. At high irradiance, the width of energy distribution in the normal direction of the target reaches the maximum at 150 ns, while the peak value of energy distribution reaches the maximum at 10° at a delay time of 250 ns. We also give the velocity of different species in the plasma according to the position-time diagram of the maximum line intensity of species. It is found that energy of the upper level of the selected lines will directly affect the species velocity, and the velocity of species determines their distribution, which provides theoretical support for the fine collection of spectra in laser-induced breakdown spectroscopy.
Data Availability Statement
The raw data supporting the conclusion of this article will be made available by the authors, without undue reservation.
Author Contributions
JW was the main author and responsible for the first draft of the manuscript. All authors provided review and comment on the subsequent versions of the manuscript. JW was responsible for theoretical simulations, acquisition of theoretical data and analysis of results. YZ, LZ, and SW explained the results and provided suggestions to improve the manuscript. MS, DS, and QM provided guidance for the optimization of theoretical models. WM, WY, and SJ have provided support with the model setup, analysis, and interpretation of results. All authors read and approved the final manuscript.
Funding
National Key R and D Program of China (2017YFA0304203); National Energy R and D Center of Petroleum Refining Technology (RIPP, SINOPEC); Changjiang Scholars and Innovative Research Team in University of Ministry of Education of China (IRT_17R70); National Natural Science Foundation of China (NSFC) (61975103, 61875108, 61775125, 11434007); Major Special Science and Technology Projects in Shanxi (201804D131036); 111 project (D18001); Fund for Shanxi “1331KSC”.
Conflict of Interest
The authors declare that the research was conducted in the absence of any commercial or financial relationships that could be construed as a potential conflict of interest.
Publisher’s Note
All claims expressed in this article are solely those of the authors and do not necessarily represent those of their affiliated organizations, or those of the publisher, the editors and the reviewers. Any product that may be evaluated in this article, or claim that may be made by its manufacturer, is not guaranteed or endorsed by the publisher.
References
1. Spizzichino V, Fantoni R. Laser Induced Breakdown Spectroscopy in Archeometry: A Review of its Application and Future Perspectives. Spectrochimica Acta B: At Spectrosc (2014) 99:201–9. doi:10.1016/j.sab.2014.07.003
2. Sheta S, Afgan MS, Hou Z, Yao S-C, Zhang L, Li Z, et al. Coal Analysis by Laser-Induced Breakdown Spectroscopy: a Tutorial Review. J Anal Spectrom (2019) 34:1047–82. doi:10.1039/C9JA00016J
3. Zhang L, Hu Z-Y, Yin W-B, Huang D, Ma W-G, Dong L, et al. Recent Progress on Laser-Induced Breakdown Spectroscopy for the Monitoring of Coal Quality and Unburned Carbon in Fly Ash. Front Phys (2012) 7:690–700. doi:10.1007/s11467-012-0259-7
4. Noll R, Fricke-Begemann C, Brunk M, Connemann S, Meinhardt C, Scharun M, et al. Laser-Induced Breakdown Spectroscopy Expands Into Industrial Applications. Spectrochimica Acta Part B: At Spectrosc (2014) 93:41–51. doi:10.1016/j.sab.2014.02.001
5. Singh VK, Rai AK. Prospects for Laser-Induced Breakdown Spectroscopy for Biomedical Applications: a Review. Lasers Med Sci (2011) 26:673–87. doi:10.1007/s10103-011-0921-2
6. Singh V, Kumar V, Sharma J, Khajuria Y, Kumar K. Importance of Laser Induced Breakdown Spectroscopy for Biomedical Applications: a Comprehensive Review. Mater Focus (2014) 3:169–82. doi:10.1166/mat.2014.1162
7. Knight AK, Scherbarth NL, Cremers DA, Ferris MJ. Characterization of Laser-Induced Breakdown Spectroscopy (LIBS) for Application to Space Exploration. Appl Spectrosc (2000) 54:331–40. doi:10.1366/0003702001949591
8. Sallé B, Cremers DA, Maurice S, Wiens RC. Laser-induced Breakdown Spectroscopy for Space Exploration Applications: Influence of the Ambient Pressure on the Calibration Curves Prepared From Soil and clay Samples. Spectrochimica Acta Part B: At Spectrosc (2005) 60:479–90. doi:10.1016/j.sab.2005.02.009
9. Ahmad K, Al-Eshaikh MA, Kadachi AN. Characterization of Alumina-Based Ceramic Nanocomposites by Laser-Induced Breakdown Spectroscopy. Appl Phys A (2015) 119:1223–9. doi:10.1007/s00339-015-9167-3
10. Wu J, Qiu Y, Li X, Yu H, Zhang Z, Qiu A. Progress of Laser-Induced Breakdown Spectroscopy in Nuclear Industry Applications. J Phys D: Appl Phys (2020) 53:023001. doi:10.1088/1361-6463/ab477a
11. Guo LB, Hao ZQ, Shen M, Xiong W, He XN, Xie ZQ, et al. Accuracy Improvement of Quantitative Analysis by Spatial Confinement in Laser-Induced Breakdown Spectroscopy. Opt Express (2013) 21:18188–95. doi:10.1364/OE.21.018188
12. Yu J, Hou Z, Ma Y, Li T, Fu Y, Wang Y, et al. Improvement of Laser Induced Breakdown Spectroscopy Signal Using Gas Mixture. Spectrochimica Acta Part B: At Spectrosc (2020) 174:105992. doi:10.1016/j.sab.2020.105992
13. Oumeziane AA, Liani B, Parisse J-D. Laser Induced Plasma on Copper Target, a Non-Equilibrium Model. Phys Plasmas (2014) 21:023507. doi:10.1063/1.4864647
14. Morel V, Bultel A, Annaloro J, Chambrelan C, Edouard G, Grisolia C. Dynamics of a Femtosecond/Picosecond Laser-Induced Aluminum Plasma Out of Thermodynamic Equilibrium in a Nitrogen Background Gas. Spectrochimica Acta Part B: At Spectrosc (2015) 103-104:112–23. doi:10.1016/j.sab.2014.11.014
15. Fu CL, Wang Q, Ding HB. Numerical Simulation of Laser Ablation of Molybdenum Target for Laser-Induced Breakdown Spectroscopic Application. Plasma Sci Technol (2018) 20:62–8. doi:10.1088/2058-6272/aab661
16. Colonna G, Casavola A, Capitelli M. Modelling of LIBS Plasma Expansion. Spectrochimica Acta Part B: At Spectrosc (2001) 56:567–86. doi:10.1016/S0584-8547(01)00230-0
17. De Giacomo A, Shakhatov VA, De Pascale O. Optical Emission Spectroscopy and Modeling of Plasma Produced by Laser Ablation of Titanium Oxides. Spectrochimica Acta Part B: At Spectrosc (2001) 56:753–76. doi:10.1016/s0584-8547(01)00224-5
18. Gornushkin IB, Kazakov AY, Omenetto N, Smith BW, Winefordner JD. Radiation Dynamics of Post-Breakdown Laser Induced Plasma. Spectrochimica Acta Part B: At Spectrosc (2004) 59:401–18. doi:10.1016/j.sab.2003.12.023
19. Min Q, Su M, Cao S, Sun D, O’Sullivan G, Dong C. Dynamics Characteristics of Highly-Charged Ions in Laser-Produced SiC Plasmas. Opt Express (2018) 26:7176–89. doi:10.1364/OE.26.007176
20. Bhattacharya D, Singh RK, Holloway PH. Laser‐Target Interactions During Pulsed Laser Deposition of Superconducting Thin Films. J Appl Phys (1991) 70:5433–9. doi:10.1063/1.350201
21. Zel’dovich YB, Raizer YP. Physics of Shock Waves and High-Temperature Hydrodynamic Phenomena. New York: Academic Press (1966).
23. Wang J, Zhang L, Wang S, Su M, Sun D, Han J, et al. Numerical Simulation of Laser-Induced Plasma in Background Gas Considering Multiple Interaction Processes. Plasma Sci Technol (2021) 23:035001. doi:10.1088/2058-6272/abdda3
24. Le HC, Zeitoun DE, Parisse JD, Sentis M, Marine W. Modeling of Gas Dynamics for a Laser-Generated Plasma: Propagation Into Low-Pressure Gases. Phys Rev E (2000) 62:4152–61. doi:10.1103/PhysRevE.62.4152
25. Chen Z, Bogaerts A. Laser Ablation of Cu and Plume Expansion into 1atm Ambient Gas. J Appl Phys (2005) 97:063305. doi:10.1063/1.1863419
27. Bogaerts A, Chen Z, Gijbels R, Vertes A. Laser Ablation for Analytical Sampling: What Can We Learn From Modeling? Spectrochimica Acta Part B: At Spectrosc (2003) 58:1867–93. doi:10.1016/j.sab.2003.08.004
28. Gusarov AV, Gnedovets AG, Smurov I. Gas Dynamics of Laser Ablation: Influence of Ambient Atmosphere. J Appl Phys (2000) 88:4352. doi:10.1063/1.1286175
Keywords: plasma-induced plasma, theoretical simulation, hydrodynamic mode, alloy target, different laser irradiance
Citation: Wang J, Zhao Y, Zhang L, Wang S, Su M, Sun D, Min Q, Ma W, Yin W and Jia S (2021) Kinetic Evolution of Laser Ablating Alloy Materials. Front. Phys. 9:812283. doi: 10.3389/fphy.2021.812283
Received: 10 November 2021; Accepted: 24 November 2021;
Published: 16 December 2021.
Edited by:
Huadan Zheng, Jinan University, ChinaReviewed by:
Shunchun Yao, South China University of Technology, ChinaZongyu Hou, Tsinghua University, China
Copyright © 2021 Wang, Zhao, Zhang, Wang, Su, Sun, Min, Ma, Yin and Jia. This is an open-access article distributed under the terms of the Creative Commons Attribution License (CC BY). The use, distribution or reproduction in other forums is permitted, provided the original author(s) and the copyright owner(s) are credited and that the original publication in this journal is cited, in accordance with accepted academic practice. No use, distribution or reproduction is permitted which does not comply with these terms.
*Correspondence: Lei Zhang, azEyMjZAc3h1LmVkdS5jbg==; Wangbao Yin, eXdiNjVAc3h1LmVkdS5jbg==
 Junxiao Wang1,2
 Lei Zhang
 Weiguang Ma