- 1PowerChina Huadong Engineering Corporation Limited, Hangzhou, China
- 2HydroChina Itasca R&D Center, Hangzhou, China
It is recognized that NSF on a pile affects the structural and geotechnical design. The formation of NSF on a pre-stressed high-strength concrete (PHC) pile under a control building in a Vietnamese project was investigated using a verified numerical model in FLAC3D. The height of backfills, the consolidation degree of soil, working loads on the PHC pile, and the pile diameter were analyzed in sensitivity analyses to investigate the influence on NSF. It was found that higher backfills and higher consolidation degree were dominant in the formation of NSF, causing an increase of the dragload and an upward movement of the neutral plane. The working load and the pile diameter affected the dragload and the position of the neutral plane less. A limit decrease of the dragload induced by NSF was observed when the working load increased. Accelerating the soil consolidation process would be suggested to avoid great displacement due to NSF.
Introduction
The skin friction on a pile is caused by the relative movement on the interface between the pile and the soil. By definition, if the pile settles faster than the adjacent soil, the skin friction is positive; if the soil settles faster than the pile, the skin friction is negative (NSF) [1]. After long-term monitoring, Fellenius found that all piles in soil experienced NSF and a small relative movement was sufficient to develop NSF [2]. There are important fundamental differences in the behavior of piles with NSF compared to piles without it that affect the structural and geotechnical design [3]. On the one side, the dragload induced by NSF drags the pile downward such that the settlements exceed the serviceability constraints by design; on the other side, in some specific cases, the structural strength of the pile is exceeded. However, it is widely recognized in the international geotechnical community, as well as in numerous building codes, that NSF is not an ultimate geotechnical bearing capacity issue for the pile [4–6].
Multiple methods for determining NSF were proposed by Poulos and Mattes [7], Fellenius [2], Wong and Teh [8], and Hanna and Sharif [9]. However, these methods were limited for estimating NSF. Fellenius monitored NSF on a slender pile, which increased up to 40 tons for 5 months [10]. Siegel and McGillivray monitored a single cast-in-place pile with no applied load to the pile head and observed the development of NSF incrementally over 103 days [11]. The increase in NSF lasts for a long period because the consolidation of the adjacent soil takes place after pile driving; meanwhile, small relative movement is sufficient to mobilize NSF. Endo et al. measured NSF on three 609 mm diameter steel pipe piles in dewatered soil [12]. Improving the consolidation degree of soils before pile driving is efficient to reduce the relative movement. Thus, the prefabricated vertical drains and the surcharges are suggested. Comodromos et al. proposed that the working load of piles and the loading sequences affected the dragload significantly [13]. Ye et al. loaded a pile in the range of 0–400 kN and found that NSF was decreased from −25.5 kPa to −13.9 kPa, and the neutral plane moved upward [14]. Chiou and Wei investigated the influence of pile-head loading on the development of NSF in consolidating ground based on an effective stress-based mechanical-flow analysis model in ABAQUS and found that under the same pile-head loads, the reduction in total dragload for the friction-end-bearing pile is smaller than that for friction [15]. Although NSF on piles can be reduced under loading, the absolute settlements of piles increase. Liu et al. pointed out that depending on the numerical simulations, the bearing layer and the pile–soil interaction of a wished-in-place pile affected the formation of NSF as well [16].
For a better understanding of the formation of NSF and guiding this project, the pre-stressed high-strength concrete piles in high-backfill sites in a Vietnamese project are focused. The abovementioned influence factors, that is, natural consolidation time, the working load, and the diameter of piles, on the dragload and the neutral plane are analyzed by using a verified numerical model in the program FLAC3D. Besides the natural consolidation time and the diameter of the pile, the height of backfills is investigated as well.
Project Overview
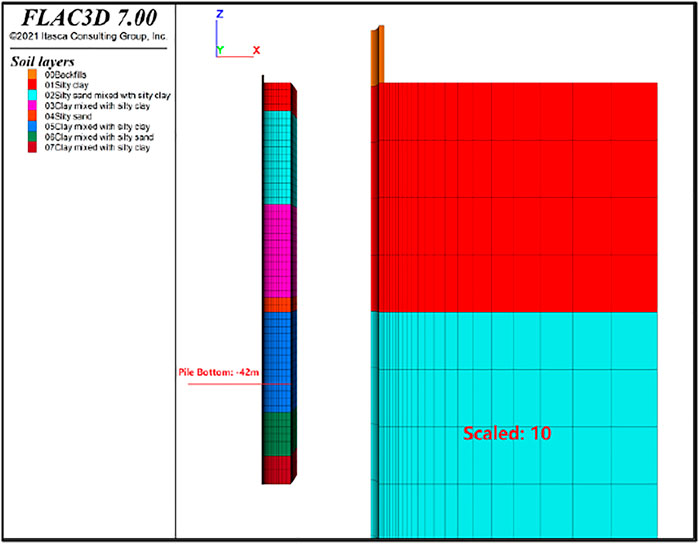
Figure 1 describes the control building for a booster station in a Vietnamese wind power project located in the southeast sea area of Ben Tre province, Vietnam. This project with a total capacity of 310 MW aims to increase the power source for the regional grid and the safety of the power supply, and improve the voltage. The geotechnical investigation report indicates that the soil under the control building is mainly composed of soft soil layers, which under loading can deform with a large magnitude, but in a long consolidation time. To enhance the bearing capacity of the foundation, either piles on the bearing layer or increasing the soil consolidation degree, for example, by using prefabricated vertical drain (PVD), are employed. PHC piles and large-area backfill with a height of 4.0 m are applied in this project. Figure 1 also describes the installation layout of the PHC piles. The 400 mm diameter PHC piles are driven into a bearing layer, that is, clay mixed with silty clay, at a depth of −42 m. The soft soil layers are considered to deform faster than the PHC piles, which causes NSFs on piles and unexpected settlements of the control building.
Verification of Numerical Model
Material Properties
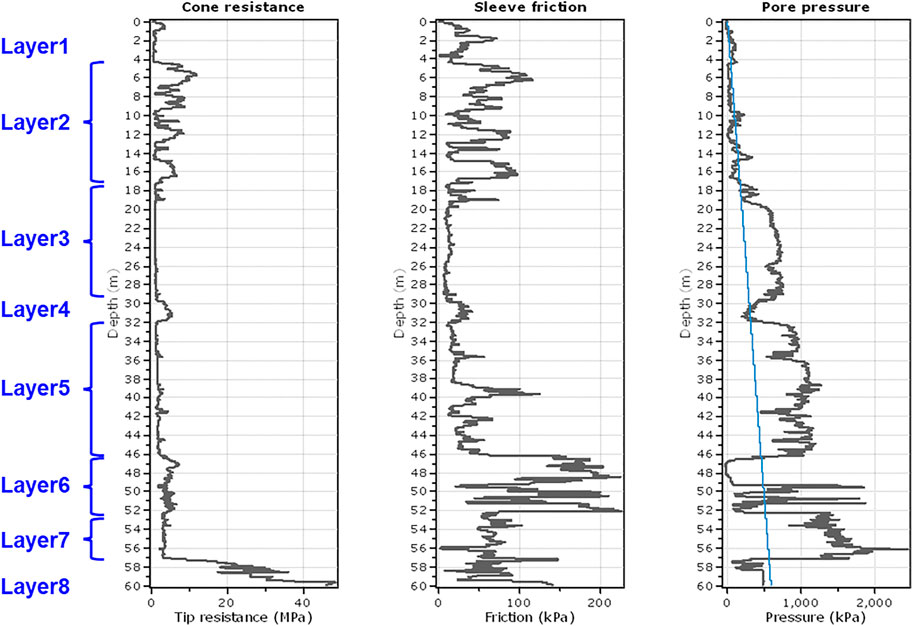
The geological conditions onsite were verified by the electrical CPTU probes. Even though the two CPTUs were far away from each other, the profile was very consistent, overlapping almost perfectly. This is a good indication of homogeneity, not only in terms of stratigraphy but also in terms of mechanical properties. Compared to the laboratory tests, the CPTU tests determined more realistic material properties. Figure 2 represented the CPTU interpretation data along with the depth, that is, the tip resistance qc, the shaft resistance fs, and the pore pressure u. Following the interpretation method proposed by Robertson [17], the layering conditions and the mechanical properties listed in Table 1 were estimated. Sensitive soft soil layers were detected onsite. They were sensitive to loadings and settled faster than the PHC pile, as expected.
Numerical Model
A quarter of a 4 m × 4 m domain was adopted because of the symmetry of typical modeling. Figure 3 represented the origin PHC pile foundation and the scaled PHC pile foundation with a scale factor of 10. The numerical model was composed of about 24,000 meshes. Symmetric boundary conditions were imposed on the two planes of symmetry by prescribing a normal velocity of zero to these planes. The base of the model was constrained in three global directions. The velocity of zero normal to the far-field boundary was imposed.
The PHC pile with a length of 42 m and a thickness of 0.075 m was assigned with a linear elastic model. The layered foundation was assigned with the hardening small strain (HSS) model, which was capable of analyzing the pile driving accompanying the soil consolidation. The yield surface of this material model expanded with an increase of the shear and volumetric plastic strain. It was well established for multiple loading paths that the elastic modulus of unloading/reloading was greater compared to the virgin loading and the shear modulus degradation was caused by an increase in shear strain [18]. The material properties were determined based on the CPTU interpretation data. The internal friction angle φ´ and the cohesion c´ were listed in Table 1. It was suggested by the Itasca documentation that the lateral earth pressure coefficient K0 was estimated by K0 =1-sinφ´[18]. The exponent m was usually adopted as 0.5 for sand and 0.5–1.0 for clay. Bolton represented that the dilation angle of sand was φ′-30°, and the dilation angle of clay was zero [19]. The shear modulus G0 and the initial elastic modulus E0 can be determined by the following equations:
where ρ was the soil density, Vs the shear wave velocity, and μ the Poisson ratio. Following the descriptions in the Itasca documentation, it was adopted that Eur = E0/3, E50 = Eur/3, Eoed = E50 for the cohesionless soil, and Eur = E0/3, E50 = Eur/3, Eoed = 0.6E50 for the cohesion soil [18]. It was well established that the pile–soil interaction was simulated by the interfaces attached to the structural elements with applicable cohesion and friction angle. Here, c = 0.8csoil and φ = 0.8φsoil [19].
Model Verification
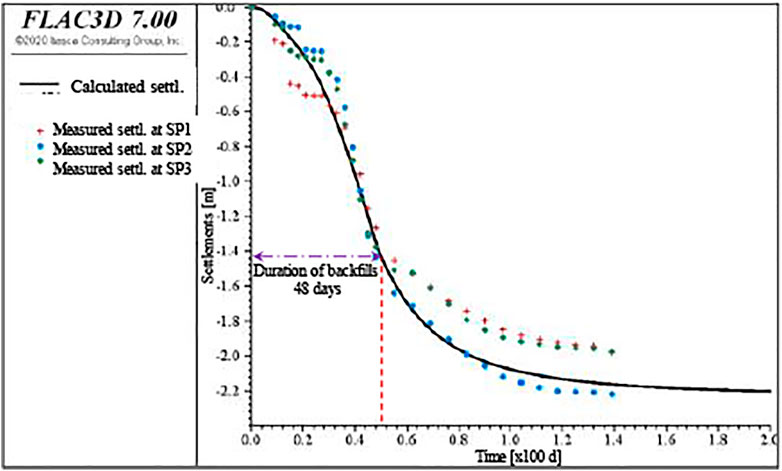
NSF was induced by the relative displacements between the pile and the surrounding soil, which were generally caused by the soil consolidation due to surcharging, dewatering, or soil reconsolidation after pile driving and soil liquefaction [3]. To verify the feasibility of the HSS model with specific material properties, the numerically predicted soil settlements were compared to the measured settlements onsite. The settlements onsite were caused by the backfilling for accelerating the consolidation, which was completed in 48 days. Figure 4 established the measured settlements from three characteristic points SP1, SP2, and SP3 as well as the predicted settlements with a maximum magnitude of about 222 mm. The numerical results showed a good agreement with the measured settlements. The deviation was within 5%.
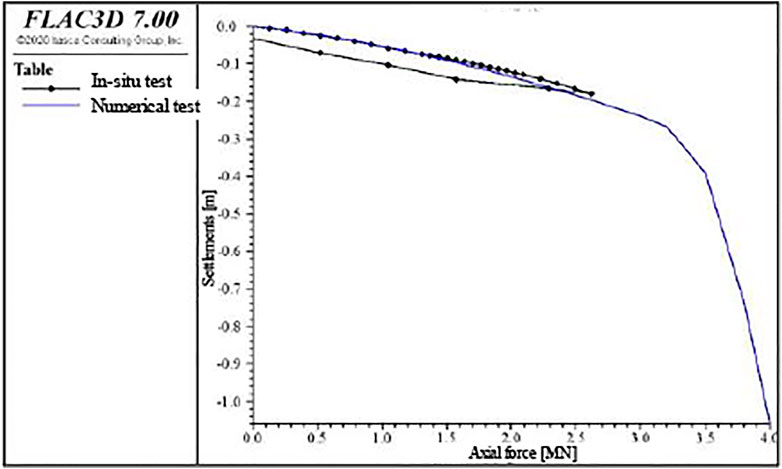
It was well established that the static pile loading tests onsite were widely accepted to obtain the bearing capacity under vertical loading and detect the potential of pile slipping. In this project, the 400 mm diameter, 42 m long PHC pile was continually loaded up to 2,618 kN and settled approximately 17.9 mm. Figure 5 represented the Q-S curves by static pile loading tests onsite and numerical calculation. The numerical results showed a good agreement with the measured results. The deviation was within 10%. The vertical bearing capacity of the PHC pile was assumedly well predicted by the numerical simulation, although the measured one was absent. A significant yielding point can be observed at Q = 3,200 kN, which can be considered as the final vertical bearing capacity.
Parametric Study
NSF induced by the large-area backfills was studied depending on the aforementioned verified numerical model. The soil layering, material properties, and the pile–soil interaction were identical to the verified numerical model. The steps to simulate the formation of NSF were (note that the backfills were hypothetically finished in a short time):
i. Balancing the Earth pressure field
ii. Surcharging on the surface (backfills) and controlling the consolidation time
iii. Activating the PHC pile
iv. Applying the loads on the pile top
v. Soil consolidating again and excess pore pressure dissipating
vi. Extracting the data for analyses
Table 2 listed the influence factors on NSF of the PHC pile. For a quantitative analysis to investigate the dominant influence factors, the height of backfills, the consolidation time, the loads on the pile, and the pile diameter were examined individually in the parametric studies.
The Influence of the Height of Backfills
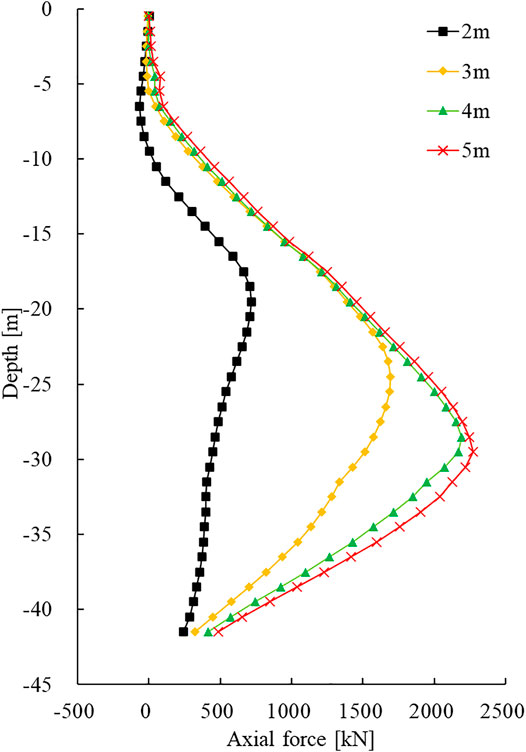
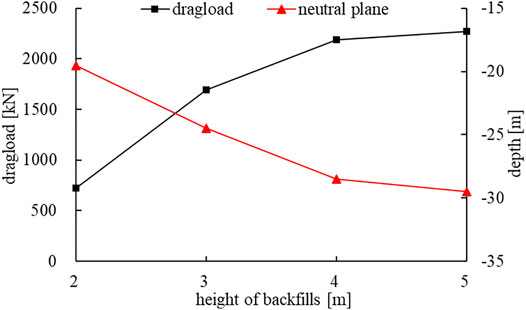
It was well recognized that the surcharges densified the soil and avoided large settlements during the operation. A relative movement between the soil and the pile occurred obviously, which induced NSF. The surcharges were directly proportional to the height of the backfills on the foundation surfaces. The height of the backfills varied with an interval of 1 m in the range of 2–5 m, as listed in Table 2. The weight of backfills was adopted as 18 kN/m3. Figure 6 represented the axial force of the PHC pile along with the depth. The axial force increased with higher backfills; meanwhile, the drag force caused by the NSF increased as well. Figure 7 illustrated the drag force and the neutral plane changed with different heights of backfills. The mobilized NSF increased with higher backfills, and then tended to be stable and slightly reduced. The maximum drag force of 2,270 kN occurred when the height of backfills was 5 m. The neutral plane moved downward under larger surcharges. The lowest neutral plane was at the position of −30.5 m when the height of the backfills was 5 m.
The Influence of Consolidation Time
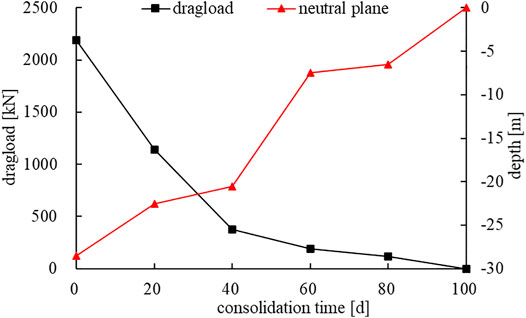
The consolidation time was the time interval between the backfilling and the pile driving. Improving the consolidation degree can reduce the relative displacement between the pile and the soil. Figure 8 represented the axial force of the PHC pile after different consolidation time. The axial force was decreased with a larger consolidation degree (longer consolidation time), which meant the drag force induced by the mobilized NSF was smaller. Figure 9 illustrated the relationship of the drag force and the neutral plane to the consolidation time. The neutral plane moved upward with a larger consolidation degree. The mobilized NSF and the drag force turned to zero when the soil consolidated for 100 days. The consolidation time significantly affected the mobilization of NSF and the pile settlements. The soil consolidation induced by the backfills was regarded as finished for a consolidation time of 100 days. However, the consolidation time of 100 days was not acceptable in an economically dominant project. PVD was suggested to accelerate the consolidation process.
The Influence of Working Load
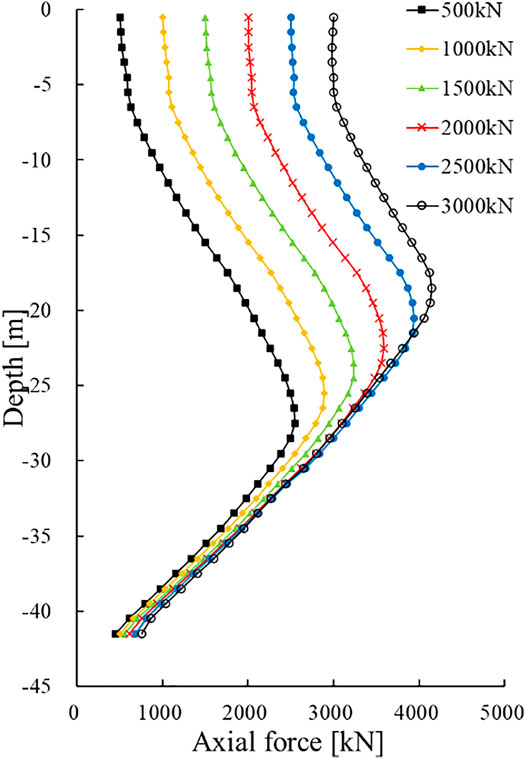
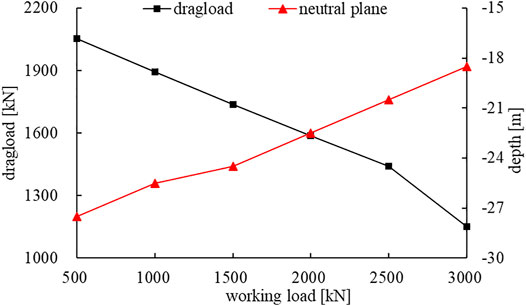
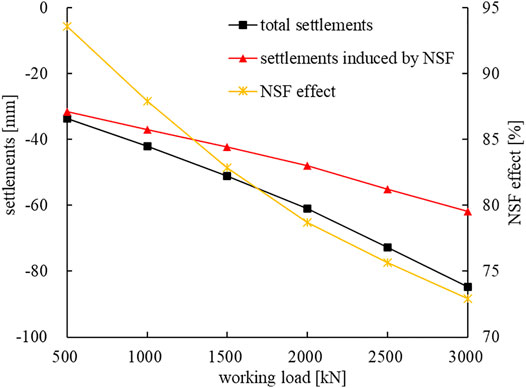
Figure 10 represented the axial forces of the PHC pile under different working loads. The maximum axial force increased with a greater working load. However, as demonstrated in Figure 11, the dragload was reduced from 2052 to 1,151 kN when the working load increased from 500 to 3,000 kN; meanwhile, the neutral plane moved upward. Figure 12 plotted the total settlements, settlements caused by NSF, and the ratio of them for the PHC pile under working loads. It was recognized that the effects of NSF decreased when the working load on the PCH pipe pile increased, though the total settlements and the settlements caused by NSF increased together. If the PHC pile is loaded close to the vertical bearing capacity, a small NSF is enough to create large settlements exceeding the serviceability constraints. Therefore, it is relevant to consider NSF in design.
The Influence of Pile Diameter
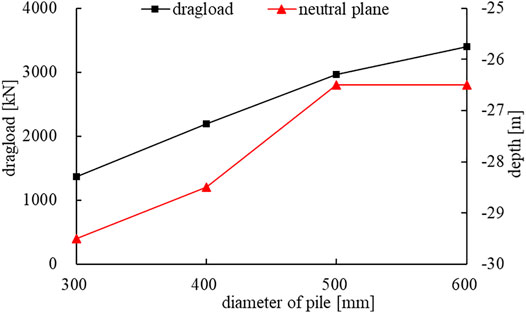
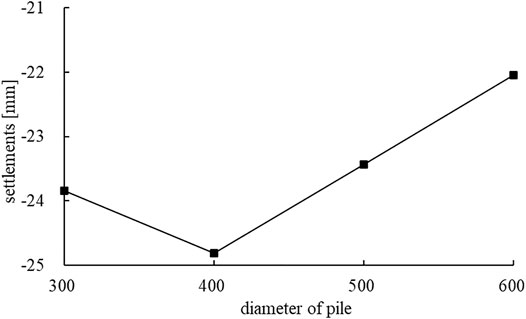
Figure 13 represented the distribution of the axial force of the PHC pile. The axial force was greater with a greater pile diameter. Figure 14 represented the change of NSF and the neutral plane for different pile diameters. NSF increased from 1,370 kN to 3,401 kN when the pile diameter increased from 300 to 600 mm. The neutral plane moved upward, and finally stayed in a constant value with a greater pile diameter. Figure 15 showed that the pile settlements reduced, and then increased with a larger diameter of the PHC pile. The maximum settlements were 24.8 mm when the diameter was 400 mm. On the one side, the neutral plane moved upward; on the other side, the drag force induced by NSF increased. There must be a balanced position where maximum settlements occurred.
Sensitivity Analysis Method
Sensitivity analysis (SA) is the study of how the uncertainty in the output of a model (numerical or otherwise) can be apportioned to different sources of uncertainty in the model input [20], which is expressed by the following equation:
where the ratio of X j and its increment represents the change of the input factors, the ratio of Fi and its increment represents the change of the output of this model, and Sij represents the sensitivity index. Table 3 listed Sij for the drag force and the pile settlements estimated by different input factors (the height of backfills, the consolidation time, and the pile diameter). It was recognized that the height of backfills and the consolidation time mostly affected NSF and the pile deformation. The sort by the magnitude of Sij for the drag force: consolidation time > pile diameter > height of backfills > working load; the sort by the magnitude of Sij for the settlements of the PHC pile: height of backfills > consolidation time > working load > pile diameter. In practice, the elevation of the control building was required by design. Thus, accelerating the consolidation process was the optional way to avoid NSF and improve the pile performance.
Conclusion
Depending on the verified model in LAC3D, the drag force induced by NSF, the movement of neutral plane, and the settlements of PHC pile were quantitatively analyzed. It was found that the height of backfills and the consolidation degree (equivalent to the consolidation time) were dominant in the formation of NSF. The drag force was greater with higher backfills because the neutral plane moved downward, which increased the area of the mobilized NSF. As such, even in the absence of the surcharges, NSF was greater at the earlier stage of the consolidation followed directly by the pile driving than at the end of the consolidation. NSF was vanished when the neutral plane arrived at the pile top. The working load on the pile top was another influence factor on the dragload. A limit decrease of the dragload can be observed when the working load increased because the relative movement between the pile and the soil decreased. However, great settlements occurred as well, which may exceed the serviceability constraints. It was not the optimal way to increase the pile diameter in practice, although it can reduce NSF in a certain range (after a balance position). Accelerating the soil consolidation process would be suggested to avoid great displacement due to NSF. The PVC and preloading on the soil surface can be employed.
Data Availability Statement
The original contributions presented in the study are included in the article/Supplementary Material; further inquiries can be directed to the corresponding author.
Author Contributions
PB proposed the idea of studying the negative skin friction based on the offshore project conducted and managed by XG and HB. GX helped PB to carry out the numerical study in FLAC3D under the guidance of PB and CW.
Funding
The authors declare that this study received funding from PowerChina Huadong Engineering Corporation Limited, Hangzhou. The funder was not involved in the study design, collection, analysis, interpretation of data, the writing of this article or the decision to submit it for publication.
Conflict of Interest
XG, HB, PB, GX, and CW were employed by PowerChina Huadong Engineering Corporation Limited. PB, GX, and CW were employed by HydroChina Itasca R&D Center.
The project was managed by PowerChina Huadong Engineering Corporation Limited, Hangzhou.
Publisher’s Note
All claims expressed in this article are solely those of the authors and do not necessarily represent those of their affiliated organizations, or those of the publisher, the editors, and the reviewers. Any product that may be evaluated in this article, or claim that may be made by its manufacturer, is not guaranteed or endorsed by the publisher.
References
2. Fellenius BH. Unified Design of Piles and Pile Groups. Committee on Foundations of Bridges and Other Structures (1988).
3. Siegel TC, Lucarelli A. Theory and Modelling of Negative Skin Friction on a Pile in Soil. DFI J - J Deep Foundations Inst (2016) 10(3):135–42. doi:10.1080/19375247.2017.1288883
4.Ministry of Housing and Urban-Rural Development of the People’s Republic of China. Technical Code for Building Pile Foundation. Beijing: Ministry of Housing and Urban-Rural Development of the People’s Republic of China (2002).
6.Pile Foundation. Specification for Pretensioned Spun concrete Pile Foundation. DB33/1016-2004 (2017).
7. Poulos HG, Mattes NS. The Analysis of Downdrag in End-Bearing Piles Soil. In: Mech & Fdn Eng Conf Proc mexico (1900), 203–209.
8. Wong KS, Teh CI. Negative Skin Friction on Piles in Layered Soil Deposits. J Geotechnical Eng (1995) 121(6):457–65. doi:10.1061/(asce)0733-9410(1995)121:6(457)
9. Hanna AM, Sharif A. Drag Force on Single Piles in Clay Subjected to Surcharge Loading. Int J Geomech (2006) 6(2):89–96. doi:10.1061/(asce)1532-3641(2006)6:2(89)
10. Fellenius BH. Down-drag on Piles in Clay Due to Negative Skin Friction. Can Geotech J (1972) 9(4):323–37. doi:10.1139/t72-037
11. Siegel TC, Mcgillivray A. Interpreted Residual Load in an Augered Cast-In-Place Pile. In: Proceedings, Annual DFI Conference; Kansas City, MO (2009).
12. Endo M, Minou A, Kawasaki T, Shibata T. Negative Skin Friction Acting on Steel Piles in clay. In: Proceedings, 8th International Conference on Soil Mechanics and Foundation Engineering; Mexico City; 1973 (1969). p. 85–92.
13. Comodromos EM, Bareka SV, Spyridoula VB. Evaluation of Negative Skin Friction Effects in Pile Foundations Using 3D Nonlinear Analysis. Comput Geotechnics (2005) 32:210–21. doi:10.1016/j.compgeo.2005.01.006
14. Ye GB, Zheng WQ, Zhang Z. Investigation on Distribution of Negative Friction of Frictional Piles in Large Filling Sites. Rock Soil Mech (2019) 40(A01):9. doi:10.16285/j.rsm.2019.0206
15. Chiou JS, Wei WT. Numerical Investigation of Pile-Head Load Effects on the Negative Skin Friction Development of a Single Pile in Consolidating Ground. Acta Geotechnica (2021) 16:1867–78. doi:10.1007/s11440-020-01134-0
16. Liu J, Gao H, Liu H. Finite Element Analyses of Negative Skin Friction on a Single Pile. Acta Geotech. (2012) 7(3):239–52. doi:10.1007/s11440-012-0163-x
17. Robertson PK. Interpretation of Cone Penetration Tests - a Unified Approach. Can Geotech J (2009) 46(11):1337–55. doi:10.1139/t09-065
18.Itasca Consulting Group Inc. FLAC3D User’s Manual. Minneapolis: Minneapolis Itasca Consulting Group Inc (2018).
19. Bolton MD. The Strength and Dilatancy of Sands. Géotechnique (1986) 36(1):65–78. doi:10.1680/geot.1986.36.1.65
Keywords: PHC pile, negative skin friction, dragload, neutral plane, FLAC3D
Citation: Gen X, Ben H, Bing P, Xiangming G and Weijiang C (2022) Analysis of Influence Factors of Negative Skin Friction on PHC Pile in High-Backfill Sites. Front. Phys. 9:809637. doi: 10.3389/fphy.2021.809637
Received: 05 November 2021; Accepted: 31 December 2021;
Published: 04 February 2022.
Edited by:
Qingxiang Meng, Hohai University, ChinaReviewed by:
Guoyong Duan, China Three Gorges University, ChinaShiyue Zhang, Shanghai Research Institute of Materials (SRIM), China
Copyright © 2022 Gen, Ben, Bing, Xiangming and Weijiang. This is an open-access article distributed under the terms of the Creative Commons Attribution License (CC BY). The use, distribution or reproduction in other forums is permitted, provided the original author(s) and the copyright owner(s) are credited and that the original publication in this journal is cited, in accordance with accepted academic practice. No use, distribution or reproduction is permitted which does not comply with these terms.
*Correspondence: Pan Bing, cGFuX2JAaGRlYy5jb20=
 Xiong Gen1
 Ge Xiangming
