- 1State Key Laboratory of Simulation and Regulation of Water Cycle in River Basin, China Institute of Water Resources and Hydropower Research, Beijing, China
- 2Department of Geotechnical Engineering, China Institute of Water Resources and Hydropower Research, Beijing, China
- 3Sinohydro Bureau 6 Co., Ltd., Shenyang, China
- 4Sinohydro Bureau 8 Co., Ltd., Changsha, China
The compaction density of sand-gravel materials has a strong gradation correlation, mainly affected by some material source parameters such as P5 content (material proportion with particle size greater than 5 mm), maximum particle size and curvature coefficient. When evaluating the compaction density of sand-gravel materials, the existing compaction density evaluation models have poor robustness and adaptability because they do not take into full consideration the impact of material source parameters. To overcome the shortcomings of existing compaction density models, this study comprehensively considers the impact of material source parameters and compaction parameters on compaction density. Firstly, asymmetric data were fused and a multi-source heterogeneous dataset was established for compaction density analysis. Then, the Elman neural network optimized by the adaptive simulated annealing particle swarm optimization algorithm was proposed to establish the compaction density evaluation model. Finally, a case study of the Dashimen water conservancy project in China is employed to demonstrate the effectiveness and feasibility of the proposed method. The results show that this model performs high-precision evaluation of the compaction density at any position of the entire working area which can timely correct the weak area of compaction density on the spot, and reduce the number of test pit tests.
1 Introduction
As a cohesionless coarse-grained soil material, sand-gravel material has higher strength and deformation modulus after compaction. It has the advantages of capacity to absorb large seismic energy, and adaptability to diverse foundation conditions [1]. In China’s vast southern Xinjiang region, natural sand-gravel materials with abundant reserves are broadly distributed in riverbeds and the Gobi Desert. The sand-gravel dam has become one of the most common dam types in water conservancy and hydropower development in this region because of its use of local materials, simple structure, good deformation adaptability, and few construction procedures and other characteristics. In the process of dam filling and rolling, efficacious control of compaction density is indispensable to ensure the safe operation of the dam, which directly affects the stability and durability of the dam. Improving the compaction density of sand-gravel dam can effectively reduce engineering accidents such as seepage damage and dam cracking [2].
According to the current construction specifications [3], the conventional method of dam compaction density control at the construction site is an association of controlling compaction parameters during construction operation and post-operation quality-control (i.e., spot tests of material density). It relies on manual sampling inspection of compaction density and control of compaction parameters [4]. The conventional compaction density control method can neither guarantee the compaction density of the entire construction area nor satisfy the demand for intelligent and efficient construction.
In recent years, with several ultra-high earth-rock dams, traditional construction and evaluation methods have become inadequate. The intelligent construction of dams has shown strong development momentum, comprehensively enhancing the overall level of engineering construction information management. The real‐time compaction monitoring system(RCMS) has been extensively investigated and applied in dam quality control. It can realize the entire-process and fine control during dam rolling construction and provide a real-time evaluation method that can reflect the construction quality of the entire work area.
The existing earthwork compaction monitoring system mainly consists of a real-time monitoring system of rolling compaction parameters and a compaction density evaluation model. Among them, the former was initially proposed and applied in road construction. With the advance of technology and research, continuous compaction control (CCC) [5, 6], intelligent compaction (IC) [7, 8] and roller integrated compaction monitoring (RICM) [9–11] systems have been successively applied. Nevertheless, considering the considerable variations between road construction and earth-rock dam construction in physical properties, construction technology and quality control indexes, these researches are not completely applicable to earth-rock dam construction [12].
During the last decade or so, through the unremitting efforts of many scholars, the compaction monitoring system in the construction of earth-rock dams has gradually matured. Zhong et al. [13, 14] put forward a real-time monitoring technology for dam construction quality, which can effectively control compaction parameters and ensure better construction quality, and has been successfully applied to Nuozhadu Project. Chen et al. [15] developed an improved unmanned driving technology for construction machinery without changing the oil circuit, circuit control system and mechanical structure, and applied it to the Chushandian Reservoir in Henan Province to verify the applicability and effectiveness of the technology. Huang et al. [16] developed a real-time construction quality supervising system for face rockfill dams to supervise the working surface’s compaction parameters, including rolling track, rolling times, rolling speed and compacted thickness, which has been successfully applied in the construction of the concrete face rockfill dam of Shuibuya hydropower station. Zhang et al. [17] presented an unmanned rolling compaction system for rockfill materials during construction, and proved the effectiveness and high efficiency of the system in the field application of the Qianping reservoir project. Liu et al. [12] utilized RTK-GPS and RICM technology to monitor the compaction value and rolling construction parameters (such as compaction passes, vibration status and compacted thickness, etc.) in the construction process of earthwork, and proposed a method for evaluating the compaction density of earth-rock dam based on the simultaneous control of compaction degree and rolling construction parameters.
In terms of the evaluation model of compaction density, some related researches have been conducted by scholars. Multiple linear regression models and neural network frameworks are used to establish compaction density evaluation models. Yang and Shi [18] analyzed the impact of rainfall on vibration compaction value (VC) in detail through an experimental test of the Longtan RCC dam, and established the corresponding nonlinear regression model. Liu et al. [19] established a corresponding multiple linear regression model considering the impact of rolling parameters and the moisture content on compactness, and verified its validity in the NZD dam project in southwest China. Thompson et al. [20] fully considered the influence of soil type and moisture content, and respectively established multiple regression models of dry soil density, Kriging impact value (CIV), dynamic cone penetration value (DCP) and soil stiffness (ELWD) represented by MDP and water content as independent variables. Wang et al. [21] constructed a compacting quality evaluation model based on support vector regression with chaotic firefly algorithm (CFA), which provided a new idea for compaction density evaluations that combine intelligent bionic algorithms with data mining algorithms.
Although many scholars have conducted in-depth studies on the evaluation model of compaction density in various aspects, these evaluation models have the following problems in the real-time monitoring system. Firstly, the existing compaction density evaluation models mainly focus on the fine-grained soil with a small particle size distribution range (less than 120 mm) and lack of research on the sand-gravel materials with an extensive particle size distribution range (more than 200 mm). Secondly, the existing evaluation model does not fully consider the changes of soil attributes (moisture content and gradation), which means that the same index values may not represent the same density under different soil attributes [19]. The dry density of filling materials during dam construction has a gradation correlation. However, in the construction quality control of dam material, the influence of P5 content on dry density is mainly considered. In contrast, the effects of maximum particle size, variable coefficient and curvature coefficient are not fully considered. In the dam material grading analysis, the traditional grading screening method separates the test pit materials. However, there are numerous shortcomings, such as low sampling rate, cumbersome operation process, interference of human factors in the test process and results. The obtained material source parameter data is quite scarce. One of the most significant and arduous issues of current research is effectively combining and analyzing the asymmetric data of a small amount of material parameter data and a large amount of rolling construction parameter data in the compaction density evaluation model. Thirdly, the relationship between dry density and its factors is complicated and fuzzy. The existing compaction density evaluation model established by the regression model is intuitive and straightforward and suitable for a few parameters and known curve types [22]. It is arduous to reach an appropriate regression model for multi-parameter and nonlinear relationships. When evaluating the compaction density of sand-gravel materials, the robustness and adaptability of the existing models become worse due to the significant difference in the particle size of filling materials.
In order to overcome the shortcomings of the investigation above, this paper selected sand-gravel materials as the research object, statistically collects and collates the detected data of test pits on filling units of different divisions after the rolling construction as well as the compaction parameters at the test pit position obtained from the RCMS as the historical database. A multi-source heterogeneous dataset was established by integrating rolling construction parameter data, material source parameter data and compaction density data. Moreover, in order to improve the accuracy of the compaction density forecasting model, Elman neural network (ENN) is introduced to construct a compaction density evaluation model of the sand-gravel dam coupled with dam material source parameters and compaction parameters. Given the inherent problems of ENN such as slow convergence speed and falling into local optimum easily [23], this paper adopts an adaptive simulated annealing particle swarm optimization algorithm to optimize Elman neural network (ASAPSO-ENN). The prediction ability of the proposed model is verified by field test data in the Dashimen water conservancy project and compared with other models based on evaluation indexes.
2 Methodology
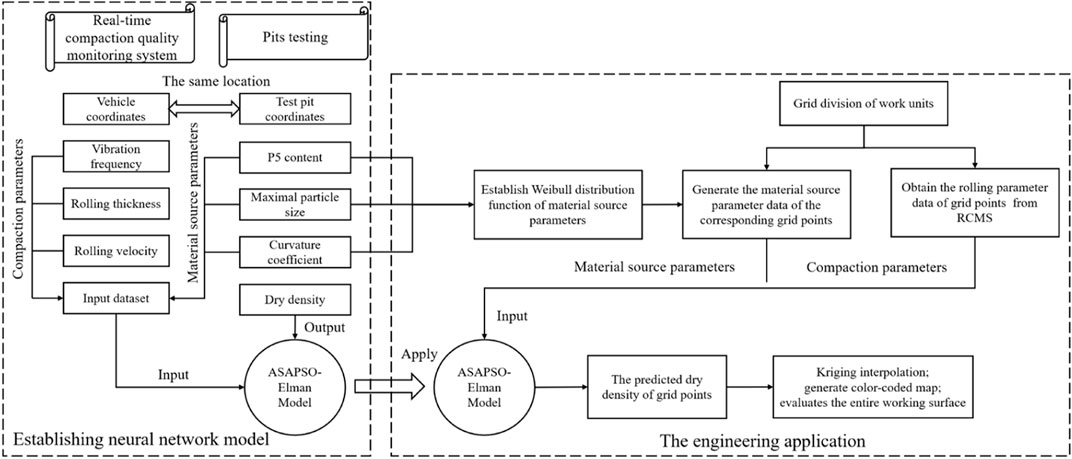
The workflow of the proposed methodology is illustrated in Figure 1, which mainly includes three parts: the acquisition of evaluation parameters, the establishment of neural network models and the comprehensive evaluation of compaction density. Firstly, the data of rolling construction parameters, material source parameters and compaction density were obtained, and a multi-source heterogeneous dataset collected by different data acquisition systems is established. Secondly, the Elman neural network optimized by the adaptive simulated annealing particle swarm optimization algorithm is used to construct the compaction density evaluation model. The material source parameter and rolling parameter data are applied to the inputs, whereas the compaction density data from the in-situ test is the output. A better learning effect can be achieved by adjusting the neural network topology, the number of iterations, and the error accuracy of learning. Finally, the proposed methodology is applied to the sand-gravel dam’s compaction density evaluation in China’s hydropower project.
2.1 Acquisition and Establishment of a Multi-Source Heterogeneous Dataset
The factors affecting the compaction density of the sand-gravel dam include compaction parameters and material source parameters. The data of compaction parameters can be obtained in a real-time compaction quality monitoring system. RCMS is independently developed by our research group, as shown in Figure 2, including vehicle-mounted terminal equipment (Figure 2A), data transmission system (Figure 2B) and software platform system (Figure 2C). During the filling and rolling construction of the sand-gravel dam, many vehicle-mounted terminal devices are installed on the vibratory roller, and the sampling equipment is generally set to a sampling frequency of 1 Hz to collect the rolling construction parameters. The collected construction parameter data include the vehicle coordinates, rolling thickness, vibration frequency and acceleration, etc. These rolling construction parameter data are huge, and each filling unit will generate nearly one million pieces of construction information. The collected data is transmitted to the management platform and the industrial board installed in the mechanical cab through the data transmission system to guide and remind the construction operation.
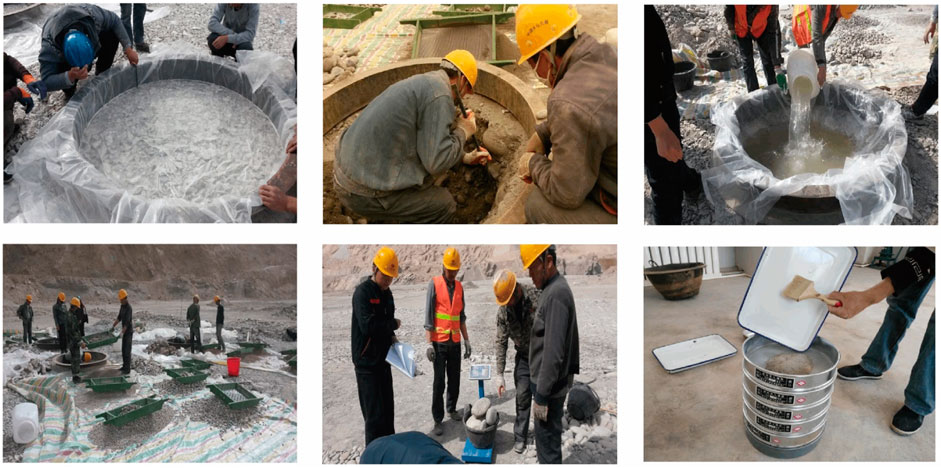
The material source parameter data and compaction density data can be obtained from pit testing of the finished work area. The pit testing includes dry density measurements and grading analysis of test pit material after compaction, whose specific processes are shown in Figure 3. Dry density measurements were carried out by the water-filling method. The grading analysis was conducted via sieving to obtain the P5 content, curvature coefficient and maximal particle size of the sand-gravel materials samples, which is carried out simultaneously with dry density measurements. Regarding detected data of test pits in the construction area, there are only a few quality testing groups for each unit project (only about 3–5 groups), and it is impossible to get their values in every position on the surface. In order to incorporate a small amount of material source parameter data with a large number of construction parameter data, and realize the comprehensive evaluation of the compaction density of the entire unit engineering, this paper collects and collates the detected data of test pits on filling units of different divisions after the rolling construction as the historical database. According to the position coordinates of the test pits, the compaction parameters at the corresponding points were found from the RCMS, and a multi-source heterogeneous dataset was established by integrating rolling construction parameter data, material source parameter data and compaction density data.
2.2 ASAPSO-ENN Model
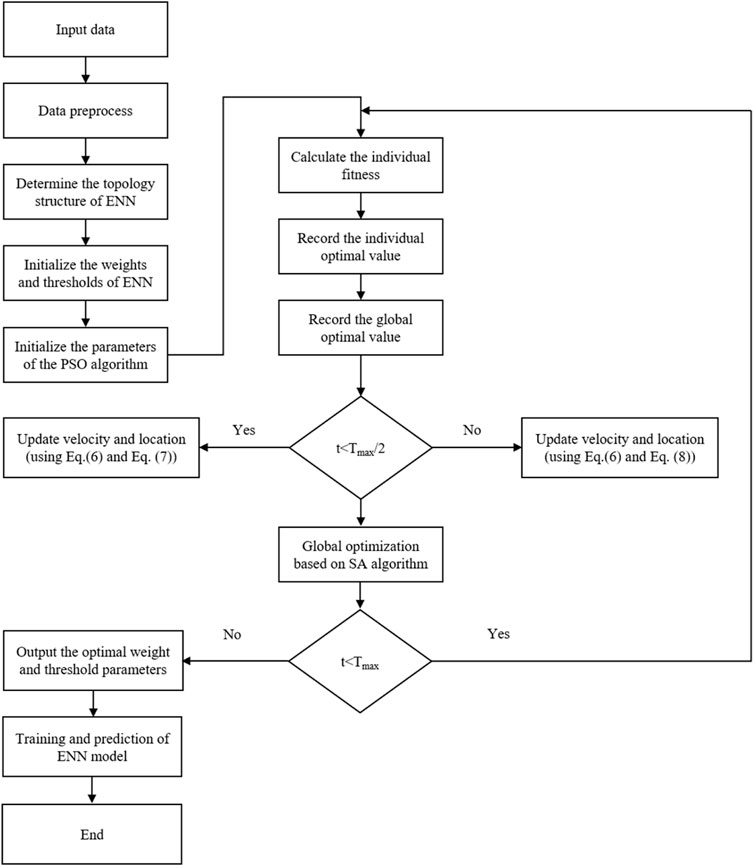
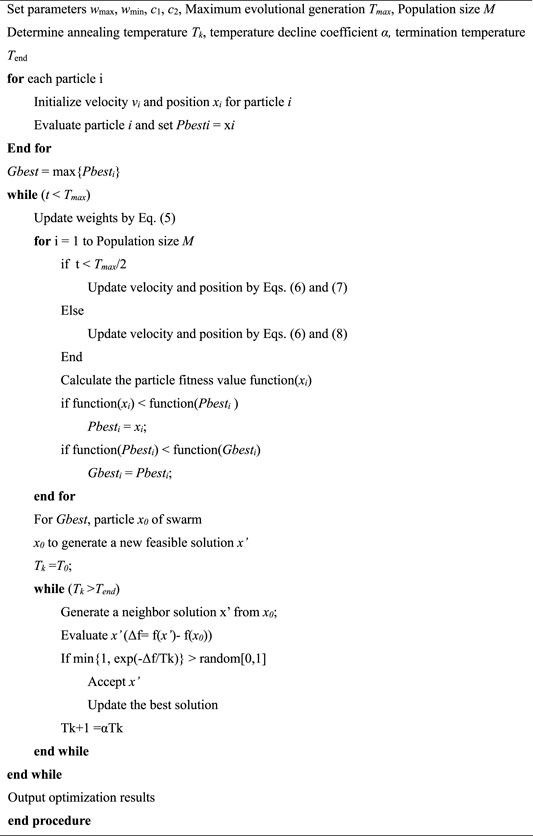
The flowchart diagram of the proposed ASAPSO-ENN model can be demonstrated as Figure 4. This section will elaborate on the Elman neural network and intelligent optimization algorithm adopted by the proposed model in this paper.
2.2.1 Elman Neural Network
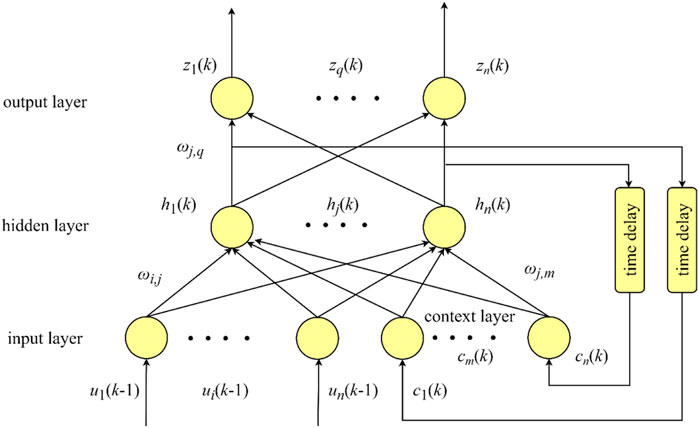
Elman neural network is a multi-layer dynamic neural network proposed by Elman in 1990 [24]. Because of its dynamic recursive structure, it has a good approximation ability to nonlinear function, so it is widely used in blasting vibration velocity forecasting [25], spatiotemporal drought prediction [26], ammonia adsorption forecasting [27] and other related fields. As shown in Figure 5, Elman neural network is divided into four layers: input layer, hidden layer, output layer and context layer. The connection of the input, hidden and output layer is similar to that of feedforward neural networks. However, the difference is that the context layer is added to store the output value of the neuron of the hidden layer at the previous moment. The output of the hidden layer is re-used as the input to the hidden layer by taking over the delay and storage of the context layer. This kind of connection enables the network to enjoy a memory function for historical state data, thereby increasing the ability of the network to deal with dynamic information. The spatial equation of state of Elman neural network at k moment is:
where h(k), c(k) and z(k) respectively represent the output vectors of the hidden layer, the context layer and output layer at the moment k; u(k-1) is the input layer vector at the moment k-1; g(•) and f(•) are transfer functions of output layer and hidden layer respectively; ωi,j, ωj,m and ωj,q are connection weights between input layer and hidden layer, context layer and hidden layer, hidden layer and output layer respectively. The weights of the Elman network are adjusted by minimizing the mean square error (MSE), the minimum mean square error is adopted to adjust the weights of Elman network in this study. The formulation of MSE is listed as follows:
where z(k) is the actual value at time k, zt(k) is the predicted value at time k.
2.2.2 Particle Swarm Optimization Algorithm
Particle swarm optimization algorithm is an evolutionary computation technique proposed by Kenney and Eberhart in 1995 [28], which is derived from the behavior research of birds predation. The algorithm is a global optimization method based on swarm intelligence theory, guided by swarm intelligence generated by cooperation and competition among particles in the swarm. In PSO, the solution of each optimization problem is regarded as a flying particle in the search space. All particles enjoy a fitness value determined by the optimized objective function, and each particle has a velocity that determines the direction and distance of its flight. Particles adjust their velocity and position dynamically by integrating individual cognition and social cognition, searching in the solution space, and finding the optimal solution through iteration [29]. When the search space is D-dimensional and the size of the particle swarm is N, the velocity and position of the particle during each iteration (Figure 6) is updated by the following relation:
where i = 1,2…N; d = 1,2…D; t is the number of iterations; ω is the inertia weight; c1 and c2 are the learning factors; r1 and r2 are random numbers between 0 and 1, which are used to maintain the diversity of the population; vid(t) and xid(t) respectively represent the velocity and position in the d-dimensional space of the ith particle at iteration t; Pbestid(t) and Gbestid(t) denote the historical optimal positions of individual particle and group particles at iteration t, respectively.
According to Eq. 3, the update of particle velocity consists of three parts. The first part reflects the degree of the particle affected by the current velocity, which is related to the current state of the particle and balances exploitation (local search) and exploration (global search). The second part is the self-cognition of particles, reflecting the impact of their historical memory. The third part is the social cognition of particles, which reflects the information sharing and cooperation among particles. Under the joint action of these three parts, the particle adjusts its position and velocity continuously according to the historical experience and the information-sharing mechanism to find the optimal solution to the problem. From what has been discussed above, the inertia weigh ω and learning factors are essential parameters that affect the optimization performance of the algorithm [30, 31].
Although the PSO algorithm shows remarkable performance, it has disadvantages such as local convergence and prematurity when dealing with complex and high-dimensional optimization problems. In order to overcome the above shortcomings, this paper modifies the original algorithm from the aspects of inertia weight and learning factor, and introduces a simulated annealing method to ensure that the algorithm can jump out of the local optimal solution.
2.2.3 Adaptive Particle Swarm Optimization
2.2.3.1 Adaptive Adjusted Inertial Weight
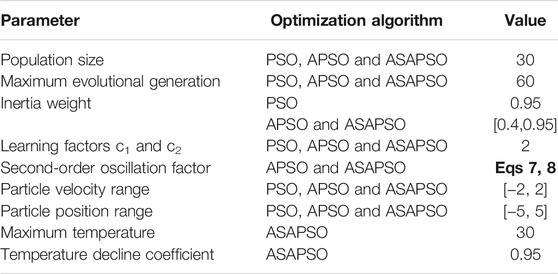
Inertia weight is a critical important parameter in PSO algorithm, which describes the impact of the velocity of the previous generation on the current generation. The appropriate value for the inertia weight can effectively balance the global and local optimization ability of PSO algorithm. Generally, the larger inertia weight is favorable to global exploration, while the smaller inertia weight tends to facilitate local exploration to fine-tune the current search area [32].The selection of inertia weight is proportional to the algorithm’s convergence speed and global search ability, and inversely proportional to the local search ability. In order to improve the optimization velocity of the particle swarm algorithm and avoid the algorithm from falling into the local optimal solution, this paper adopts the hyperbolic tangent function of the independent variable in the interval [-5, 5] to control the inertia weight coefficient for nonlinearly adaptive variation. The adaptive inertia weight formula defined in this paper is as follows:
where Tmax is the maximum iteration number; t is the current iteration number; ωmax and ωmin are the maximum and minimum inertia weighs respectively; A large number of experiments have proved that the algorithm performance will be greatly improved when ωmax = 0.95 and ωmin = 0.4 [33].
The adaptive inertia weight function shown in Figure 7 adopts a nonlinear control strategy. In the initial stage of the search, the inertia weight decreases slowly, and the particles have sufficient time to conduct a large range of global searches, which is beneficial to reduce the situation of falling into the local optimum. In the middle stage, the inertia weight is approximately linearly decreasing, which gradually enhances local search ability. While at a later period, the rate of change of inertia weight slowed down again, focusing on meticulous local search to accurately determine the global optimal solution.
2.2.3.2 Adaptive-Adjusted Learning Factors
Particle swarm optimization algorithm is a gradual convergence in the iterative process, and the diversity of the population will inevitably decrease during the entire iterative process, which is not conducive to the particle seeking the optimal solution. Based on the standard PSO algorithm, this paper performs second-order oscillation processing on the particle velocity update to further increase the diversity of the population and improve the global and local convergence balance performance of the algorithm. The improved optimization algorithm focuses on global search in the initial stage, emphasizes the self-cognition ability of particles, pays attention to the ergodicity of particle motion and reduces the probability of falling into a local optimal solution. With the increase of the number of iterations, the algorithm strengthens the communication between particles so that the position of the optimal solution of the population has a more significant impact on the search of each particle, and the local search is focused on the vicinity of Gbestid(t). The modified formula is as follows:
where the value of the second-order oscillation factor ξ1 and ξ2 are as follows [34]:
2.2.4 Adaptive Simulated Annealing Particle Swarm Optimization
A simulated annealing algorithm is a global search method based on a metal annealing mechanism, which can achieve the optimal objective function solution in the sense of probability. According to a certain probability in the process of finding the extreme value, it allows the objective function to deteriorate within a limited range to jump out of the local optimal solution and finally make the algorithm converge to the global optimal value. The simulated annealing algorithm is introduced into the APSO algorithm, accepting the deteriorating solution. When the temperature is higher, the probability of the algorithm accepting the deteriorating solution becomes higher. As the temperature decreases, the probability of the algorithm accepting the deteriorating solution decreases, which is convenient for the algorithm to break away from the restraint of the local extreme value and finally find the global optimal solution. For optimization problems, internal energy can be abstracted as the fitness function, and the solving process of the algorithm is as follows [35, 36]:
Step 1): Initialize the annealing temperature Tk, generate a random initial solution x0 and calculate the corresponding objective function value f(x0).
Step 2): Perturb the current solution x0 to generate a new feasible solution x’, calculate the corresponding objective function value f(x’), and get Δf = f(x’)- f(x0).
Step(3): According to the probability formula (min{1, exp(-Δf/Tk)} > random[0,1]) to receive x’, where random[0,1] is a random number within the range [0,1].
Step(4): Annealing operation: Tk+1 = αTk (where α is the temperature decline coefficient, α<1). If the convergence criterion is fulfilled, the annealing process ends. Otherwise, repeat Step 2) and Step 3) until the convergence conditions are fulfilled.
So far, the complete pseudo-code of ASAPSO algorithm is described in Algorithm 1.
2.3 Material Source Parameters Generation in Engineering Applications
The sand-gravel material consists of subrounded and rounded particles, which are not easy to break in the rolling construction process and have higher strength and deformation modulus after compaction [37]. The grading curve of the sand-gravel materials after rolling construction is close to the original grading curve of the material field [38]. This paper takes the asphalt concrete core sand-gravel dam filling material of the Dashimen water conservancy project as the research object. According to a large amount of geological exploration data in the early stage of the dam filling construction, the sand-gravel materials used to fill the dam shell are derived from the layers formed in the same geological period. The historical causes and geological movements experienced in the sand-gravel material accumulation are the same, so the physical characteristics of the sand-gravel materials in this layer are pretty similar. The particle composition has apparent regularity for the sand-gravel materials from the same layer. This regularity should be consistent in the whole stratum and obey a specific probability density distribution law.
In mathematical-statistical analysis, Weibull distribution has strong applicability to all types of test data. It can be applied to large sample data and has good applicability to small sample data. It can obtain a more accurate estimation of the gradation parameters distribution, which is a commonly used probability statistical method. The expression of the two-parameter Weibull distribution function and the corresponding density function can be expressed as [39]:
where F(x) is the distribution function; f(x) is the density function; x is the random variable; ξ is the shape parameter, and η is the scale parameter.
In order to determine the overall distribution of material source parameters more accurately, this paper firstly determines the distribution model with two-parameter Weibull distribution as the material source parameters through the goodness of fit test. Then 1000 groups of regenerated sub-samples were extracted from the above empirical distribution function by the Bootstrap sampling method. These regenerated sub-samples were fitted with Weibull distribution to obtain 1000 groups of shape parameters and scale parameters. The mean values of these shape and scale parameters were counted as parameter estimation of Weibull distribution of material source parameters. This paper’s parameterized Bootstrap sampling method is better than the traditional Bootstrap sampling method. With the continuous development of construction, the sample data of material source parameters will gradually increase. The statistics obtained using the parameterized Bootstrap method in this paper can effectively reflect the distribution of material source parameters.
3 Case Study on Compaction Density of Sand-Gravel Dam
3.1 Project Overview
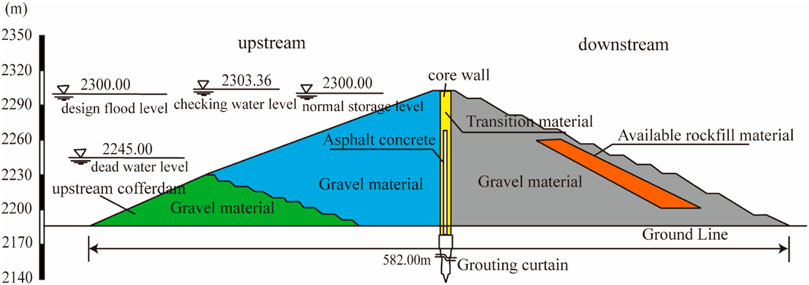
In this section, based on real-time monitoring data and pit testing data collected from the asphalt concrete core sand-gravel dam of the Dashimen water conservancy project in the Xinjiang Province of China, the compaction density of the dam surface is evaluated by using the method presented in this paper. The retaining dam of the Dashimen water conservancy project is a 128.8-meter-high sand-gravel dam with an asphalt concrete core wall, and its structural design is shown in Figure 8. The main engineering quantities of the dam filling materials include about 3.128 million cubic meters of sand-gravel materials, about 161,000 cubic meters of transition material, about 14,000 cubic meters of asphalt concrete, and about 185,000 cubic meters of available rockfill materials. Sand-gravel materials account for 90% of the total filling amount, thus this paper mainly analyzes and studies the compaction density control of sand-gravel materials.
3.2 Establishing the ASAPSO-ENN Model
This study collected and sorted out the 130 groups of quality inspection data of the sand-gravel material area from March 20, 2018 to November 4, 2019. The material source parameters in the quality inspection data include P5 content, maximal particle size, curvature coefficient, the material proportion with particle size less than 0.0075 mm(<0.0075 mm) and uneven coefficient. By matching the spatial coordinates of the pit testing data, rolling construction parameter data (vibration frequency, acceleration, rolling thickness, rolling velocity) at the test pit location can be readily retrieved from the real-time compaction quality monitoring system (RCMS). By integrating compaction parameters data, material source parameters data and compaction density data, a multi-source heterogeneous structure dataset was established for neural network learning, which contained nine input features and one target output.
The input features in the dataset are relatively comprehensive and may contain some redundant features or irrelevant features, which greatly increase the training time and computational complexity of the neural network learning algorithm and may reduce the accuracy of the model prediction. In this paper, the Pearson correlation coefficient is utilized to select correlation features and redundancy features from the aspects of correlation and redundancy. Firstly, correlation analysis between each feature and the compaction density is conducted to remove the features irrelevant to the predicted target, and the corresponding correlation coefficient is shown in Figure 9. In order to retain useful information as much as possible and avoid losing essential features for target prediction, features with correlation coefficients greater than 0.1 are selected for subsequent analysis. Then the features are sorted from largest to smallest according to the correlation coefficient, and the correlation coefficient between the features is calculated to eliminate redundant features. Suppose the correlation coefficient between any two features is greater than 0.75. In that case, it indicates a strong correlation between them, and the feature whose correlation coefficient ranks behind is eliminated. When one of the two features is eliminated, the remaining feature will retain unconditionally. After analysis, it is found that the correlation coefficient between excitation frequency and acceleration is higher than 0.75, so the acceleration is eliminated. Finally, six attributes, namely P5 content, maximum particle size, curvature coefficient, vibration frequency, rolling thickness, and rolling velocity, were chosen to evaluate the compaction density of sand-gravel material.
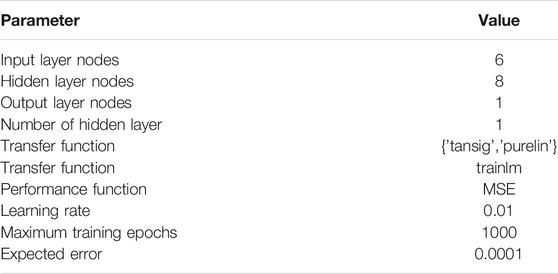
The data after the above feature selection is subjected to abnormal data cleaning and normalization operations. Then the author randomly selects 104 sets of data in the effective dataset after data processing as the training group, and 26 sets of data as the test group. In order to reflect the improvement in prediction accuracy of the proposed model, the authors compare the prediction results of the ASAPSO-ENN model with those of ENN, PSO-ENN and APSO-ENN on the test dataset. The parameters in Table 1 are used to establish a single ENN model. Then PSO, APSO and ASAPSO algorithms are respectively adopted to optimize the initial weights and thresholds of ENN. In this paper, PSO, APSO and ASAPSO have different adjustment strategies for particle motion, and the parameter settings of these three algorithms are shown in Table 2.
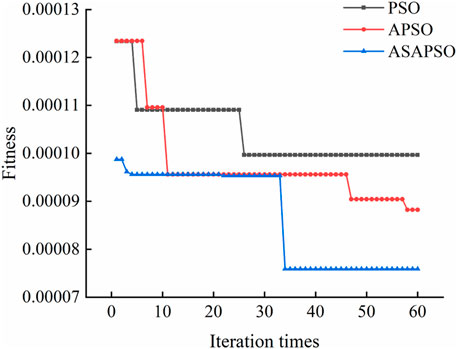
The particle swarm optimization algorithm uses the mean square error (MSE) as the fitness function. The algorithm is compared with the PSO and APSO algorithm to prove the effectiveness and accuracy of the ASAPSO algorithm in this paper. Figure 10 shows the evolution curve of these algorithms. As can be seen from the figure, APSO has made adaptive improvements to the algorithm’s inertia weight and learning factor on the traditional benchmark PSO, making the traditional benchmark PSO algorithm jump out of the local optimal solution to a certain extent. In this paper, the simulated annealing operation is introduced on the basis of APSO, which significantly enhances the ability to jump out of the local optimal solution and improves the accuracy of search results. In addition, the algorithm proposed in this paper also has certain advantages in convergence speed.
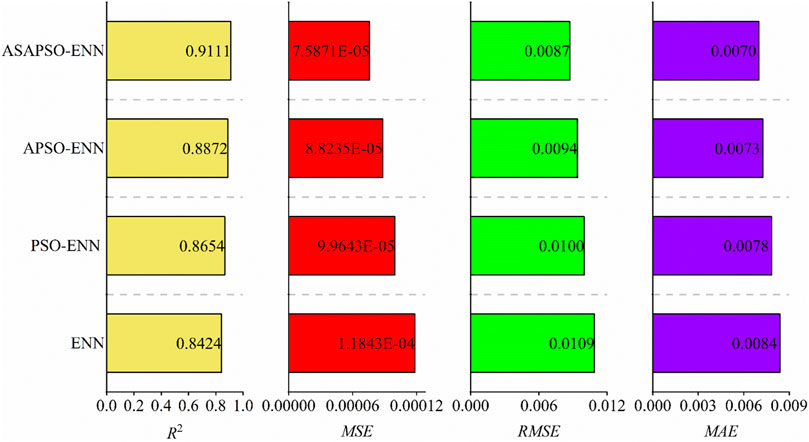
Then, to demonstrate the accuracy of the compaction density evaluation model constructed by the proposed algorithm in this research, four commonly applied error evaluation indicators are introduced, namely the determination coefficient R2 Eq. 10, the mean square error MSE Eq. 2, the root mean square error RMSE Eq. 11, and the mean absolute error MAE Eq. 12.
where z(k) is the actual value at time k; zt(k) is the predicted value at time k; zp(k) is the mean of the actual value at time k; and N is the total number of testing samples dataset.
The evaluation indicators of each prediction model are demonstrated in Figure 11. The figure indicates that the proposed model ASAPSO-ENN is the best performer. The ASAPSO-ENN model proposed in this paper can be effectively used to evaluate compaction density.
3.3 Compaction Density Assessment for the Entire Filling Construction Area
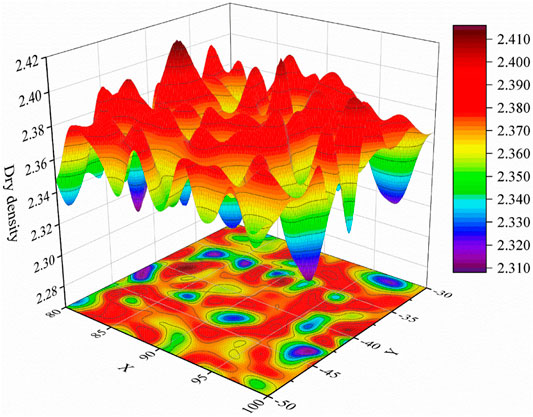
Based on the compaction density evaluation method of the entire filling construction area proposed in Section 3.2, we selected the filling unit DSMD52 of the asphalt concrete core sand-gravel dam of the Dashimen water conservancy project as the test area to evaluate the effectiveness of the compaction density evaluation method. The compaction work area was divided into 1 m ×1 m grids, and the compaction parameter data at the grid points can be obtained in the real-time compaction quality monitoring system. Then the Weibull distribution function of each material source parameter (Table 3) is calculated according to the method described in Section 2.3, which is used to generate the material source parameters at each grid point. Further, the rolling compaction and material source parameters are input into the trained ASAPSO-ENN model to predict dry density at grid points. After that, the compaction density covering 100% of the compaction area can be estimated by Kriging interpolation. According to the dam material design requirements, the overall passing rate of the dry density (ρd ≥ 2.282 g/cm3) of whole sand-gravel materials should be more than 97%. It can be seen from Figure 12 that the percentage of the compaction density exceeding 97% is 100%, indicating that the work area fulfills the construction design requirements and the compaction density reaches the corresponding standards.
Through the model proposed in this paper, the dry density of the entire working area can be predicted in real-time during the rolling construction process. In addition, the weak area of compaction density can be remedied on the spot, which effectively solves the problem that the post-evaluation method cannot remedy in time. At the same time, the model can perform a high-precision evaluation of the compaction density at any position of the entire working area based on considering the impact of the material source parameters, reducing the number of test pit tests.
4 Conclusion and Prospect
The compaction density of sand-gravel materials has a strong gradation correlation, which is mainly affected by some material characteristic parameters such as P5 content, maximum particle size and curvature coefficient. When evaluating the compaction density of sand-gravel materials, the existing compaction density evaluation models have poor robustness and adaptability because it does not fully consider the impact of material source parameters. Systematic research on the compaction density evaluation of sand-gravel materials is carried out based on the Dashimen water conservancy project in China to overcome the shortcomings of existing compaction density models. In this paper, the Elman neural network optimized by the adaptive simulated annealing particle swarm optimization algorithm is proposed to establish the compaction density evaluation model, which realizes the dynamic compaction density assessment of the construction layer. The major contributions of this research are summarized as follows:
1. This research collects and collates the detected data of test pits on filling units of different divisions after the rolling construction as well as the compaction parameters at test pit position obtained from the RCMS as the historical database, and a multi-source heterogeneous dataset was established by integrating rolling construction parameter data, material source parameter data and compaction density data. Realize the fusion of asymmetric data (material source and rolling parameters), providing data support for the comprehensive evaluation of the compaction density for the entire working area.
2. In order to improve the stability and reliability of the predicted output of ENN, the adaptive simulated annealing particle swarm optimization algorithm is used to optimize the internal parameters of ENN iteratively. It greatly enhances the ability of the algorithm to jump out of the local optimal solution and improves the accuracy of search results compared with the traditional benchmark algorithm.
3. The ASAPSO-ENN model proposed in this study can be effectively used to evaluate compaction density. Through the model proposed in this paper, the dry density of the entire working area can be predicted in real-time during the rolling construction process. The weak area of compaction density can be remedied on the spot in time. At the same time, the model can perform a high-precision evaluation of the compaction density at any position of the entire working area based on considering the impact of the material source parameters, reducing the number of test pit tests.
In this study, the bionic intelligent algorithm and the neural network model are combined to improve the neural network model’s prediction performance effectively. The model in this paper is suitable for detecting the compaction density of sand-gravel materials with large particle size distribution (0–400 mm). It should be noted that this research only collects and collates the test pit data of Dashimen water conservancy project. In the future, more field test pit data of different hydraulic engineering will be collected to establish multi-source heterogeneous historical datasets under different geological conditions to obtain a more accurate evaluation model of sand-gravel material.
Data Availability Statement
The original contributions presented in the study are included in the article/supplementary materials, further inquiries can be directed to the corresponding author.
Author Contributions
BL, YFZ, WBW, BWL proposed a compaction density evaluation model of sand-gravel dam based on Elman neural network with modified particle swarm optimization. BL analyzed the data, compiled the program, and wrote the initial draft of the article. YFZ reviewed software, formal analysis, and writing. WBW, BWL reviewed and contributed to the final article.
Funding
This research is supposed by the Basic Research Project of the China Institute of Water Resources and Hydropower Research (GE0145B022021).
Conflict of Interest
Author WW was employed by S. Bureau 6 Co., Ltd, and author BL was employed by S. Bureau 8 Co., Ltd., China.
The remaining authors declare that the research was conducted in the absence of any commercial or financial relationships that could be construed as a potential conflict of interest.
Publisher’s Note
All claims expressed in this article are solely those of the authors and do not necessarily represent those of their affiliated organizations, or those of the publisher, the editors, and the reviewers. Any product that may be evaluated in this article, or claim that may be made by its manufacturer, is not guaranteed or endorsed by the publisher.
Acknowledgments
The authors extend great gratitude the relevant departments of the Dashimen water conservancy project for providing the necessary data of this study.
References
1. Varadarajan A, Sharma KG, Venkatachalam K, Gupta AK. Testing and Modeling Two Rockfill Materials. J Geotech Geoenviron Eng (2003) 129(3):206–18. doi:10.1061/(asce)1090-0241(2003)129:3(206)
2. Zhong D, Li X, Cui B, Wu B, Liu Y. Technology and Application of Real-Time Compaction Quality Monitoring for Earth-Rockfill Dam Construction in Deep Narrow valley. Automation in Construction (2018) 90:23–38. doi:10.1016/j.autcon.2018.02.024
3.IWHR (Institute of Water Resources and Hydropower Research of China). DL/T5129-2013—Specifications for Rolled Earth-Rockfill Dam Construction. Beijing: China Electric Power Press (2014). (in Chinese).
4. Zhang Q, Liu T, Zhang Z, Huangfu Z, Li Q, An Z. Compaction Quality Assessment of Rockfill Materials Using Roller-Integrated Acoustic Wave Detection Technique. Automation in Construction (2019) 97:110–21. doi:10.1016/j.autcon.2018.11.003
5. Meehan CL, Cacciola DV, Tehrani FS, Baker WJ. Assessing Soil Compaction Using Continuous Compaction Control and Location-specific In Situ Tests. Automation in Construction (2017) 73:31–44. doi:10.1016/j.autcon.2016.08.017
6. Pistrol J, Villwock S, Völkel W, Kopf F, Adam D. Continuous Compaction Control (CCC) with Oscillating Rollers. Proced Eng (2016) 143:514–21. doi:10.1016/j.proeng.2016.06.065
7. Polaczyk P, Hu W, Gong H, Jia X, Huang B. Improving Asphalt Pavement Intelligent Compaction Based on Differentiated Compaction Curves. Construction Building Mater (2021) 301:124125. doi:10.1016/j.conbuildmat.2021.124125
8. Zhang Q, An Z, Liu T, Zhang Z, Huangfu Z, Li Q, et al. Intelligent Rolling Compaction System for Earth-Rock Dams. Automation in Construction (2020) 116:103246. doi:10.1016/j.autcon.2020.103246
9. White DJ, Vennapusa PK. A Review of Roller-Integrated Compaction Monitoring Technologies for Earthworks, Final Report ER10, 04. Ames, IA: Earthworks Engineering Research Center, Iowa State University (2010). https://intrans.iastate.edu/app/uploads/2018/03/White-and-Vennapusa-2010_FHWA-IC-Lit-Review.pdf.
10. White DJ, Vennapusa PKR, Gieselman HH. Field Assessment and Specification Review for Roller-Integrated Compaction Monitoring Technologies. Adv Civil Eng (2011) 2011(2):1783831–15. 783815. doi:10.1155/2011/783836
11. Xu T, Huang X. Investigation into Causes of In-Place Rutting in Asphalt Pavement. Construction Building Mater (2012) 28(1):525–30. doi:10.1016/j.conbuildmat.2011.09.007
12. Liu D, Li Z, Lian Z. Compaction Quality Assessment of Earth-Rock Dam Materials Using Roller-Integrated Compaction Monitoring Technology. Automation in Construction (2014) 44:234–46. doi:10.1016/j.autcon.2014.04.016
13. Zhong D, Liu D, Cui B. Real-time Compaction Quality Monitoring of High Core Rockfill Dam. Sci China Technol Sci (2011) 54(7):1906–13. doi:10.1007/s11431-011-4429-6
14. Zhong D, Cui B, Liu D, Tong D. Theoretical Research on Construction Quality Real-Time Monitoring and System Integration of Core Rockfill Dam. Sci China Ser E-technol Sci (2009) 52(11):3406–12. doi:10.1007/s11431-009-0343-6
15. Chen ZY, Zhao YF, Zhou B. Study and Application of Unmanned Driving Technology or Filling and Rolling Construction of Earth-Rockfill Dam. Water Resour Hydropower Eng (2019) 8:1–7. doi:10.13928/j.cnki.wrahe.2019.08.001
16. Huang S, Zhang W, Wu G. Research on Real-Time Supervisory System for Compaction Quality in Face Rockfill Dam Engineering. J Sensors (2018) 2018:1–11. doi:10.1155/2018/6487405
17. Zhang Q, Liu T, Zhang Z, Huangfu Z, Li Q, An Z. Unmanned Rolling Compaction System for Rockfill Materials. Automation in Construction (2019) 100:103–17. doi:10.1016/j.autcon.2019.01.004
18. Yang L, Shi JJ. Experimental Study on the Impact of Rainfall on RCC Construction. J Constr Eng Manage (2010) 136(5):477–83. doi:10.1061/(Asce)Co.1943-7862.0000156
19. Liu D, Sun J, Zhong D, Song L. Compaction Quality Control of Earth-Rock Dam Construction Using Real-Time Field Operation Data. J Constr Eng Manage (2012) 138(9):1085–94. doi:10.1061/(Asce)Co.1943-7862.0000510
20. Thompson MJ, White DJ. Estimating Compaction of Cohesive Soils from Machine Drive Power. J Geotech Geoenviron Eng (2008) 134(12):1771–7. doi:10.1061/(asce)1090-0241(2008)134:12(1771)
21. Wang JJ, Zhong DH, Wu BP, Shi MN. Evaluation of Compaction Quality Based on SVR with CFA: Case Study on Compaction Quality of Earth-Rock Dam. J Comput Civil Eng (2018) 32(3). doi:10.1061/(Asce)Cp.1943-5487.0000742
22. An ZZ, Liu TY, Huangfu ZH. Neural Network Model for Evaluating Compaction Quality of Rockfill Materials by Compaction Meter Value. J Hydroelectric Eng (2020) 39(4):110–20. (in Chinese). doi:10.11660/slfdxb.20200411
23. Yang L, Wang F, Zhang J, Ren W. Remaining Useful Life Prediction of Ultrasonic Motor Based on Elman Neural Network with Improved Particle Swarm Optimization. Measurement (2019) 143:27–38. doi:10.1016/j.measurement.2019.05.013
24. Elman JL. Finding Structure in Time. Cogn Sci (1990) 14(2):179–211. doi:10.1207/s15516709cog1402_1
25. Cai C, Qian Q, Fu Y. Application of BAS-Elman Neural Network in Prediction of Blasting Vibration Velocity. Proced Comp Sci (2020) 166:491–5. doi:10.1016/j.procs.2020.02.059
26. Mehr AD, Vaheddoost B, Mohammadi B. ENN-SA: A Novel Neuro-Annealing Model for Multi-Station Drought Prediction. Comput Geosciences (2020) 145. 104622. doi:10.1016/j.cageo.2020.104622
27. Cagcag Yolcu O, Aydın Temel F, Kuleyin A. New Hybrid Predictive Modeling Principles for Ammonium Adsorption: The Combination of Response Surface Methodology with Feed-Forward and Elman-Recurrent Neural Networks. J Clean Prod (2021) 311:127688. doi:10.1016/j.jclepro.2021.127688
28. Kennedy J, Eberhart R. Particle Swarm Optimization. In: Proc. 1995 IEEE Int. Conf. Neural Networks. Part 1 (of 6); Novemb. 27, 1995 – December 1. IEEE, Perth (1995). p. 1942–8.
29. Ab Aziz MF, Mostafa SA, Mohd. Foozy CF, Mohammed MA, Elhoseny M, Abualkishik AZ. Integrating Elman Recurrent Neural Network with Particle Swarm Optimization Algorithms for an Improved Hybrid Training of Multidisciplinary Datasets. Expert Syst Appl (2021) 183:115441. doi:10.1016/j.eswa.2021.115441
30. Das PK, Behera HS, Panigrahi BK. A Hybridization of an Improved Particle Swarm Optimization and Gravitational Search Algorithm for Multi-Robot Path Planning. Swarm Evol Comput (2016) 28:14–28. doi:10.1016/j.swevo.2015.10.011
31. Li HG, Zhang Q, Zhang Y. Improvement and Application of Particle Swarm Optimization Algorithm Based on the Parameters and the Strategy of Co-evolution. Appl Maths Inf Sci (2015) 9(3):1355–64. doi:10.12785/amis/090330
32. Ge H-W, Qian F, Liang Y-C, Du W-l., Wang L. Identification and Control of Nonlinear Systems by a Dissimilation Particle Swarm Optimization-Based Elman Neural Network. Nonlinear Anal Real World Appl (2008) 9(4):1345–60. doi:10.1016/j.nonrwa.2007.03.008
33. Shi Y, Eberhart R. A Modified Particle Swarm Optimizer. In: evolutionary computation Proceedings of the 1998 IEEE international conference on IEEE world congress on computational intelligence, 1998. IEEE (1998). p. 69–73.
34. Ma Q, Lei X, Zhang Q. Mobile Robot Path Planning with Complex Constraints Based on the Second-Order Oscillating Particle Swarm Optimization Algorithm. IEEE (2009) 5:244–8. doi:10.1109/CSIE.2009.124
35. Zhou S, Liu X, Hua Y, Zhou X, Yang S. Adaptive Model Parameter Identification for Lithium-Ion Batteries Based on Improved Coupling Hybrid Adaptive Particle Swarm Optimization- Simulated Annealing Method. J Power Sourc (2021) 482:228951. doi:10.1016/j.jpowsour.2020.228951
36. Hafez AA, Abdelaziz AY, Hendy MA, Ali AFM. Optimal Sizing of Off-Line Microgrid via Hybrid Multi-Objective Simulated Annealing Particle Swarm Optimizer. Comput Electr Eng (2021) 94:107294. doi:10.1016/j.compeleceng.2021.107294
37. Varadarajan A, Sharma KG, Abbas SM, Dhawan AK. Constitutive Model for Rockfill Materials and Determination of Material Constants. Int J Geomech (2006) 6(4):226–37. doi:10.1061/(asce)1532-3641(2006)6:4(226)
38. Fang XB, Guo K, (2018). Rolling Test and Result Analysis of Shell Material for Sand Gravel Dam of a Reservoir, s1. Available at: https://d.wanfangdata.com.cn/periodical/scsl2018z1005
Keywords: evaluation of compaction density, sand-gravel dam, material source parameter, Elman neural network, modified particle optimization algorithm
Citation: Liu B, Zhao Y, Wang W and Liu B (2022) Compaction Density Evaluation Model of Sand-Gravel Dam Based on Elman Neural Network With Modified Particle Swarm Optimization. Front. Phys. 9:806231. doi: 10.3389/fphy.2021.806231
Received: 31 October 2021; Accepted: 16 December 2021;
Published: 14 January 2022.
Edited by:
Qingxiang Meng, Hohai University, ChinaReviewed by:
Jiuchang Zhang, Yunnan Minzu University, ChinaXiaohu Zhang, Guizhou University of Engineering Science, China
Copyright © 2022 Liu, Zhao, Wang and Liu. This is an open-access article distributed under the terms of the Creative Commons Attribution License (CC BY). The use, distribution or reproduction in other forums is permitted, provided the original author(s) and the copyright owner(s) are credited and that the original publication in this journal is cited, in accordance with accepted academic practice. No use, distribution or reproduction is permitted which does not comply with these terms.
*Correspondence: Yufei Zhao, emhhb3lmQGl3aHIuY29t
 Biao Liu
 Yufei Zhao1,2*
 Wenbo Wang