Corrigendum: Correspondences Between Parameters in a Reaction-Diffusion Model and Connexin Function During Zebrafish Stripe Formation
 Akiko M. Nakamasu
- International Research Organization for Advanced Science and Technologies, Kumamoto University, Kumamoto, Japan
Different diffusivities among interacting substances actualize the potential instability of a system. When these elicited instabilities manifest as forms of spatial periodicity, they are called Turing patterns. Simulations using general reaction-diffusion (RD) models demonstrate that pigment patterns on the body trunk of growing fish follow a Turing pattern. Laser ablation experiments performed on zebrafish reveal apparent interactions among pigment cells, which allow for a three-component RD model to be derived. However, the underlying molecular mechanisms responsible for Turing pattern formation in this system remain unknown. A zebrafish mutant with a spotted pattern was found to have a defect in Connexin41.8 (Cx41.8) which, together with Cx39.4, exists in pigment cells and controls pattern formation. Here, molecular-level evidence derived from connexin analyses is linked to the interactions among pigment cells described in previous RD modeling. Channels on pigment cells are generalized as “gates,” and the effects of respective gates were deduced. The model uses partial differential equations (PDEs) to enable numerical and mathematical analyses of characteristics observed in the experiments. Furthermore, the improved PDE model, including nonlinear reaction terms, enables the consideration of the behavior of components realistically.
1 Introduction
In 1952, Alan Turing postulated that two substrates interacting with each other show instability when they diffuse at different speeds. He explained this diffusion-driven instability by utilizing a linear reaction-diffusion (RD) model. This model demonstrates that spatial inhomogeneity (i.e., the Turing pattern) could be generated by such conditions. This relationship is known to generate patterns though the components remain to be explored.
More than two decades ago, [1] reported that pigment stripes on the bodies of growing marine angel fish behave as a Turing pattern. The research focus then shifted mainly to zebrafish (Danio rerio) as a model organism for pattern-formation studies [2–4]. Zebrafish have a pattern of stripes on their body and fins (Figure 1A). The pattern is generated by three types of pigment cells: complementarily distributed black melanophores and yellow xanthophores (Figure 1C) plus iridescent iridophores. Numerous zebrafish pigment-pattern mutants were artificially generated [5], and the corresponding genes were identified. One of the most important mutants is leopard, which produces a spotted pattern that is representative of Turing patterns (Figure 1B) [6] identifies connexin41.8 (cx41.8) as the gene responsible for the leopard mutation [6]. Besides Cx41.8, other connexins, such as Cx39.4, exist in pigment cells and affect pigment-pattern formation. Six connexins form a hemi-channel (or “connexon”), which connects intracellular and extracellular spaces (Figure 1D). Docking of two hemi-channels from adjacent cells give rise to a gap junction, which mediates intercellular signal transfer [7]. The minimal connexin network required to originate a striped pattern was recently revealed by regulating connexin expression in each pigment cell [8]. Therefore, these channels are important for pigment-pattern formation.
FIGURE 1
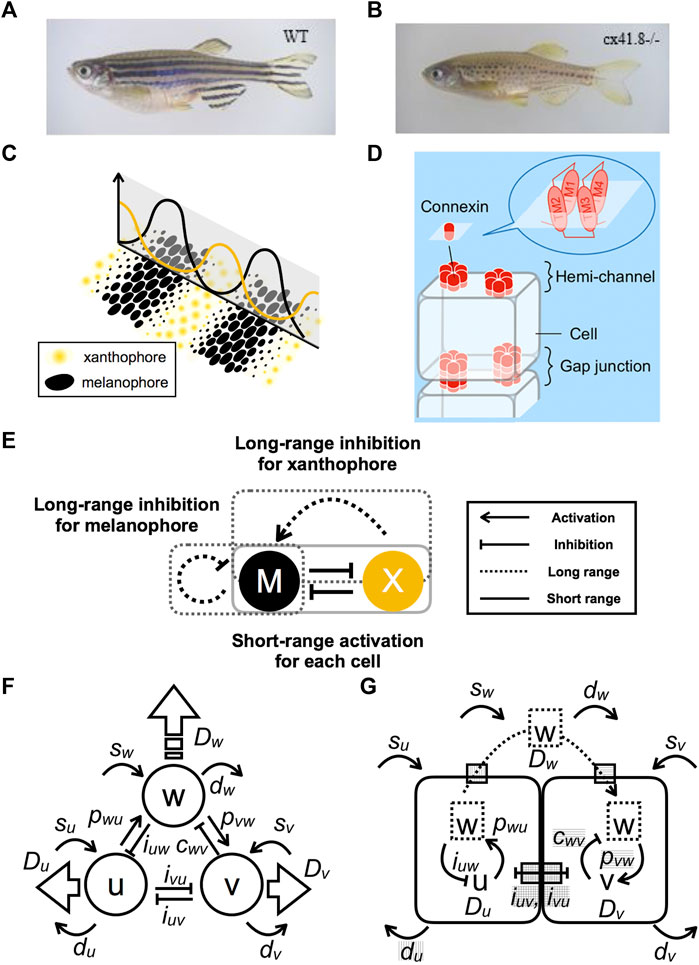
FIGURE 1. Model-based prediction of defects in channels and interactions. (A) Striped wild-type (WT) zebrafish. (B) Spotted leopard mutant zebrafish. (C) Schematic representation of the relationship between the distribution of pigment cells and the numerical result of the continuous model. (D) Schematic representation of channels composed of connexin complexes. Hemi-channels are open to the outside of a cell, whereas gap junctions form by the docking of hemi-channel connecting to adjacent cells. (E) Apparent interactions of pigment cells as revealed by laser ablation experiments. (F) Schematic diagram of a three-component PDE model composed of components
Interactions among pigment cells and their molecular mechanisms involved in pattern formation are summarized in [9]. However, the molecular mechanisms leading to Turing instability remain mostly unresolved. Mosaic fish experiments indicate that both leopard/cx41.8 and jaguar/obelix/kcnj13 genes are required for segregation of melanophores and xanthophores. Such segregation is proposed to involve local interactions between adjacent pigment cells [10]. Xanthophore ablation using a temperature-sensitive csf1ra allele led to the gradual death of melanophores in both the body trunk and fins of adult fish [11]. Accordingly, melanophore survival requires continuous signaling from xanthophores. Laser ablation of stripe and interstripe areas has revealed the mutual interactions between melanophores and xanthophores [12]. The interactions comply with the requirements for Turing pattern formation (Figure 1E). Specifically, both types of pigment cells activate their own types at a single-cell distance (short range) by inhibitions of other types and then inhibit their own types beyond the width of the stripe (long range). The difference in reaction distances achieves the “local activation and lateral inhibition” condition needed for pattern formations [13]. It should be noted, however, that the distinction between iridophores and xanthophores is sometimes unclear in those experiments.
To explain the opposing actions at long vs. short distance, a model that includes a highly diffusible molecule (i.e., long-range factor) and two cells (regarded as short-range factors with low diffusivity) was constructed [12]. This three-component RD model with its linear reaction terms and upper and lower limits describes the apparent interactions obtained experimentally. Then, the different diffusibilities and the interactions in the model achieved diffusion-driven instability (Turing instability).
Further investigations reveal that the interactions are mediated by cell projections [14]. The interaction mediated by gap junctions on the tip of the projection is considered to be a long-range effect observed in the previous experiments [15]. The researchers mention the possibility that the pattern formation might not require actual diffusion. Later, a Turing model based on an integral kernel was suggested [16] though the link between parameter and molecular function was ambiguous. Most other models for pigment-pattern formation are based on interactions at a cellular level. These models implement different effects depending on the distance from each pigment cell by agent-based models [17, 18] and by minimal lattice models [19, 20]. Several attempts were made to explain the observed patterns in zebrafish mutants by a general Turing model [21, 22]; however, they were not supported experimentally even though there are several paths to cause the expected pattern changes in mutants.
Here, the interactions in a three-component model, including a hypothetical highly diffusible factor, are developed to attempt to link the molecular functions of connexins in zebrafish. Channels thought to be important for pattern formation are generalized as “gates” of pigment cells. These gates enable transport of the diffusible molecule across the membrane. The parameters affected by each gate are deduced; then, the effects on pattern selection and size are analyzed. Finally, the model is improved to an analogous model with nonlinear terms. These models together enable reasonable explanations of detailed behavior of the components that relate to the pattern formation.
2 Materials and Methods
2.1 Numerical Simulations
For the linear model,
For the nonlinear improved model with nonlinear terms, the parameters
Calculations were performed in the language Full BASIC ver. 8.1 with no-diffusion boundary conditions with difference calculus; then, results are shown as density plots of
TABLE 1
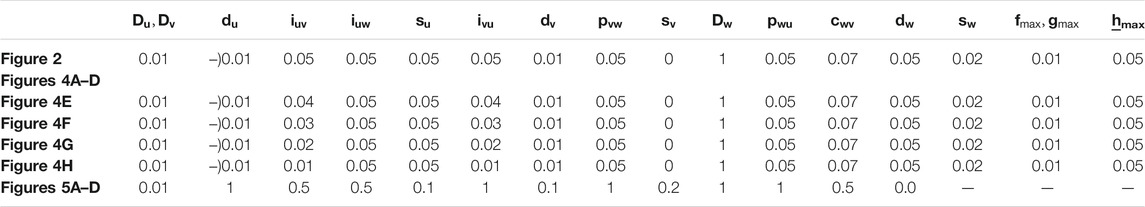
TABLE 1. Parameter set utilized in this paper.
2.2 Quantification of Simulated Color Patterns
Color pattern complexity and overall tone were quantified from binarized images using ImageJ as described in [24]. Briefly, the pattern simplicity score (PSS) is defined as the area weighted mean isoperimetric quotient of the contours extracted from each image. The overall color tone (OCT) of a pattern is defined and calculated as the ratio of white pixels in the binarized image. Analyzed images were prepared by the quaternary connection of a numerical result (
3 Results
3.1 Linear RD Model for Pigment-Pattern Formation
Previous laser ablation experiments reveal that the presence of mutual interactions between two types of pigment cells are necessary to generate Turing patterns (Figure 1E). Briefly, the density of melanophore existing and newly generated in a stripe decreases when the xanthophores in adjacent interstripes are ablated. On the other hand, that of xanthophore was not drastically changed. Then, two types of pigment cell inhibit each other at a one-cell distance even though the inhibition from xanthophore is inapparent until melanophores in adjacent stripes are eliminated. A mathematical model is derived from these apparent interactions in [12] although the details of the relationship between the experimental results and the model are not described. This model is based on the following set of RD equations:
Here the alternative distribution of two types of pigment cells (Figure 1C) is expressed by two factors
FIGURE 2
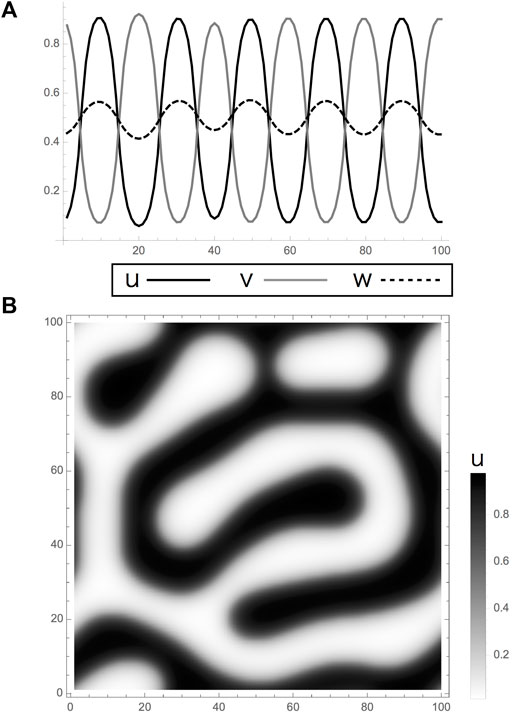
FIGURE 2. Turing pattern obtained by a reaction-diffusion model in Eqs 1, 2. (A,B). Calculation results of the model had linear terms with limits. (A) One and (B) two dimensions. Results indicate Turing patterns in which the variables
In the reaction, rather than it should be called an interaction, formulae, the dimension-less parameters are chosen arbitrarily from the sets that bring diffusion-driven instability. They are positive constants as shown in Table 1. Each formula is composed of a set of linear terms with upper and lower limits as utilized in the two-component system mentioned by [1] as follows:
These equations simply indicate negative or positive interactions among two cells and molecules by the coefficients with different signs. They are derived from the interaction network obtained by the experimental results in [12]. The cells are assumed to be inhibiting mutually
The three-component model in (1) is somewhat complex though it can be roughly regarded as a combination of two-component systems originally suggested by [33] as follows. For ease of mathematical analyses, I use the following two-component system that shares a component with high-diffusivity.
There are two different cases that bring diffusion-driven instabilities, i.e., activator–inhibitor type (Figure 3A) or activator–substrate–depletion type (Figure 3B), characterized by different signs of the parameters [34, 35]. Both conditions are included in the three-component model sharing with the high-diffusible component (Figure 3C). Therefore, each parameter in the model can be regarded as part of a two-component system. The first and second reaction Eq. 2 include mutual inhibitions
FIGURE 3
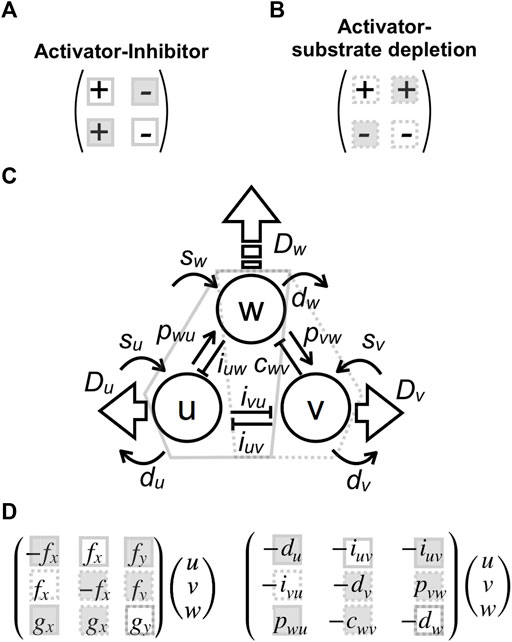
FIGURE 3. Parameter correspondences to two-component systems and effects on pattern size. (A,B) Two conditions that generate a Turing pattern: activator–inhibitor type (A) or activator–substrate–depletion type (B) with different signs of reaction parameters. (C) Correspondence between parameters in the present tree-component model and the two-component systems. Interactions included in conditions (A) and (B) are enclosed by solid and dashed polygons, respectively. (D) Matrix forms of reaction terms corresponding to the two-component system: the filled squares indicate the parameter that increases pattern size when the absolute value is decreased, and the open squares denote the opposite; the solid squares correspond to condition (A), and the dashed ones correspond to condition (B).
3.2 Effects of the Parameters on the Component Proportion and the Characteristic Wavelength of a Pattern.
Variation in patterns observed in most zebrafish mutants is explained by changes in the types and sizes of patterns. The former is defined by pattern selection [23, 36] and manifests as a general variation of the Turing pattern from spots to stripes to reverse spots. The latter is dictated by the characteristic wavelength of the pattern [37]. The following sections analytically describe the effect of parameters in the model (1)–(2) on these characteristics.
3.2.1 Effects of Parameter on Pattern Size
The characteristic wavelength of a pattern can be analytically obtained from the dispersion relation of linear stability [37]. The wavelength of a two-component RD system in (3) is given by the following equations of which derivation was mentioned in detail in [37]:
3.2.2 Effects of Parameter on Pattern Selection
In zebrafish, pattern selection is determined mainly by the proportion of two types of pigment cells with complementary distribution. The relative position of the equilibrium from the limits of the reaction terms provides an index for pattern selection [23] as that is the origin of diffusion-driven instability.
Considering the differential equations, the decrease in each absolute value of parameter (i.e., the decline of each interaction) with a positive effect decreases the population volume of respective cells; then that of the parameter with a negative effect increases the population of the respective cells. Here, the component
3.3 Correspondence Between the Mathematical Model and Connexin Defects in Zebrafish Estimated from Molecular Function
Next, correspondence between this model and molecular functions is assumed (Figure 1G). In zebrafish, leopard mutants are known to have an aberrant pigment pattern, whereby stripes are changed to spots [6] (Figures 1A,B). The gene responsible for the leopard mutation is a connexin cx41.8, which encodes a four trans-membrane connexin protein. Additionally, mutation of connexin cx39.4 results in wavy stripes. Recent analyses of connexin activity reveal different functions associated with hemi-channels and gap junctions [30, 31]. Hemi-channels are open to the extracellular environment, whereas gap junctions form connections between cells to allow the exchange of small molecules (Figure 1D). Accordingly, connexins may be involved in both long- and short-range interactions. These channels may function as gates for the transport of molecule
3.4 Comparisons of Results Obtained by Simulation and Experiments.
First, the independent effects of the gate on each cell were analyzed numerically. When an arbitrary stripe is set as a starting point, only gates that open to the outside on
FIGURE 4
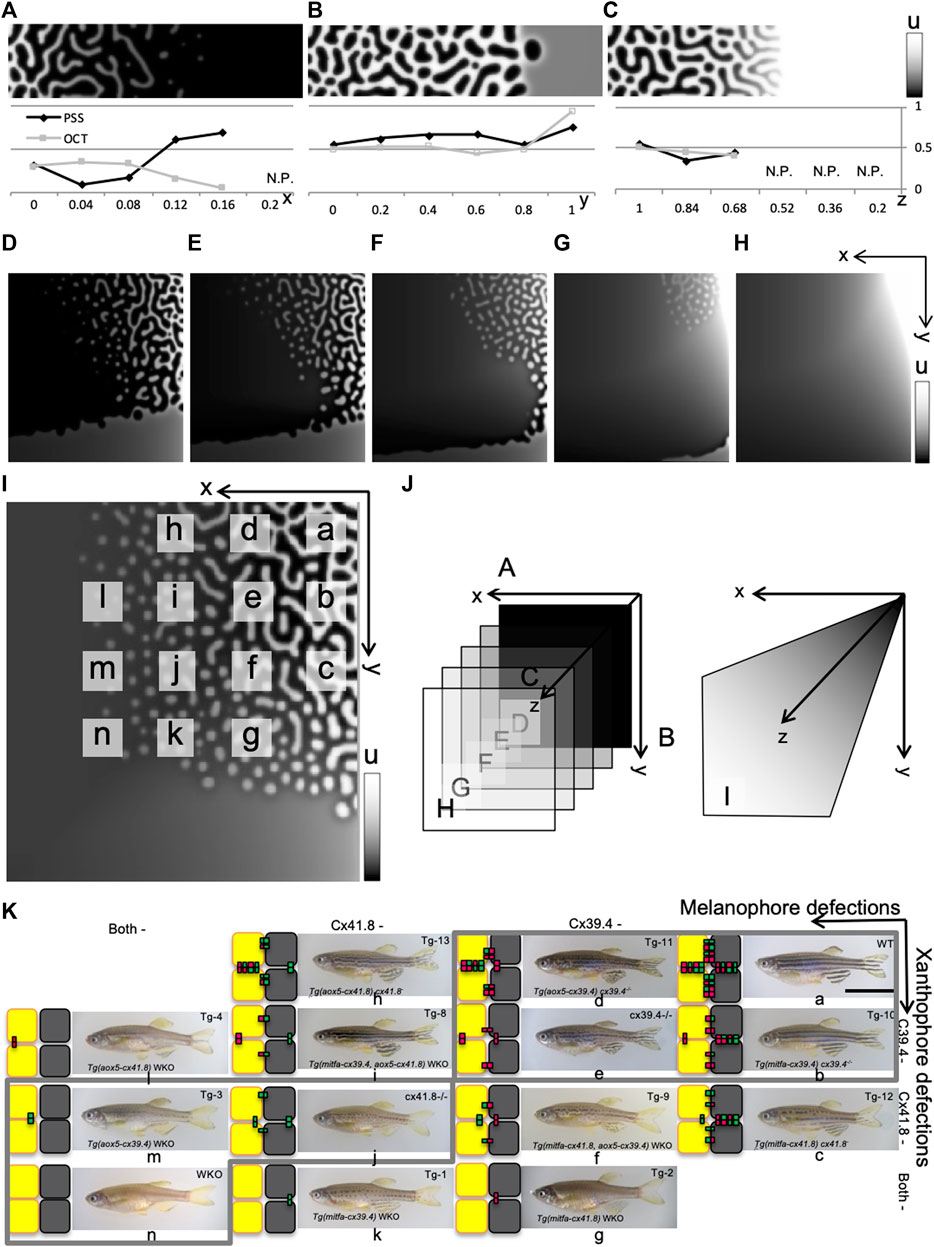
FIGURE 4. Numerical results of gate effects and comparison with experiments. (A–I) Numerical results obtained from a model of linear reaction terms with limits. Pattern shifts were observed when the effects of gate defects on both cells were changed. Defects of gates on
Defects on short-range inhibition do not have drastic effects on pattern selection though the pattern does finally disappear (Figure 4C). On the 2-D plane, the stripe region is recessive together with the defect in short-range effects by gap junctions (Figures 4D–H,J) though the tendency to shift the pattern selection is not changed. In Figure 4I, short-range effects are simultaneously decreased by respective
The results mostly consist of the positive effects of connexin additions to WKO that increase the respective pigment cells [8]. However, experimental eliminations of the gate on each wild-type pigment cell lead to an increase in the rate of respective pigment cells; melanophore defects generate net (or rather wavy stripe) patterns of melanophores, and the xanthophore defects result in dot patterns of melanophores (i.e., net patterns of xanthophore). Therefore, the simulation results are partly inconsistent with experimental results in [8] in which the effects of connexins on each or both pigment cells are investigated in detail (Figure 4K).
From the electro-physiological experiments in [30]; each type of connexin can be considered to have different strengths of the (hemi-) channel functions on the two types of cells. Deduced patterns of respective transgenic fish are indicated by small letters on the phase plane in Figure 4I. Even though the differences in the strengths of channels are taken into account, the removal of hemi-channels on wild-type xanthophores tends to increase the proportion of xanthophores; then a faint increase of proportion in melanophore is brought in the case of connexin on melanophores (Figure 4K). If cell
From the analyses of wavelength mentioned above, defects to the gates on cell
3.5 Improvements to the Model with Nonlinear Terms.
To describe the detailed behavior of the components in the system, the model is changed to a model including nonlinear terms as shown in (5).
The qualitative relationships for pattern formation shown in Figure 1F are not changed from model (1) and (2). That is, mutual inhibitions between
FIGURE 5
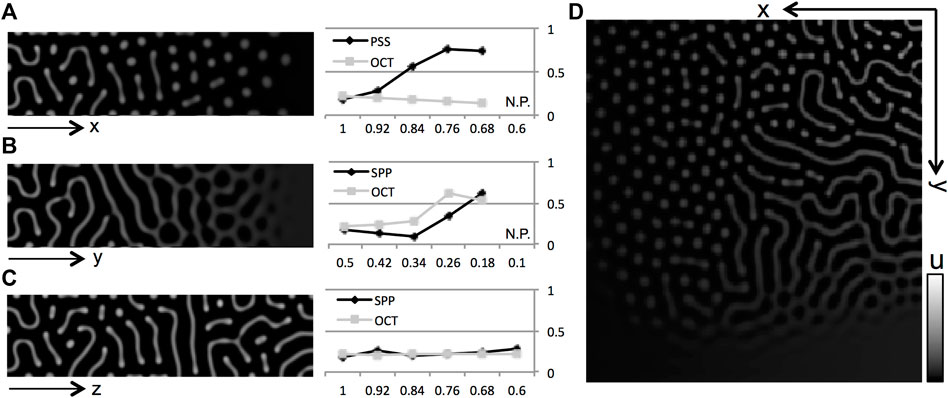
FIGURE 5. Numerical results of gate effects by nonlinear model. (A–D) Numerical results obtained from a model with nonlinear reaction terms. Pattern shifts were observed when the effects of gate defects on both cells were changed. (A) U defect, (B)
Next, numerical calculations of the nonlinear model are performed to consider the condition in which respective gates on
4 Discussion
In the present study, to confirm the potency of diffusion-driven instability in determining fish pigmentation patterns, channels on pigment cells are generalized as gates (Figure 1). The three-component RD model (1) is shown to be composed of two-component RD systems bringing diffusion-driven instabilities (Figures 2, 3). The proposed qualitative models help to understand the relationship between pigment cells as well as between cells and molecules even when their identity is unknown. The terms of the theoretical model are connected with the functions of each channel on different cells. Parameters affected by the gate defects were deduced (Figure 1G); then, the effects of such defects are simulated from a parameter set that generates an arbitrary stripe as a benchmark (Figures 4, 5). Then, dots and thinning of the
The determination of the signs of self-reaction terms for
Connexins are related to both hemi-channels and gap junctions. Hemi-channels are considered less important in physiology although it was recently revealed that the aberrant activity of hemi-channels can change the proportion of vertebrae [31] and are related to the pigment-pattern formation in zebrafish [30, 32]. Laser ablation experiments show that the interactions between xanthophores and melanophores differ depending on the distance. In the present model, the highly diffusible molecule
FIGURE 6
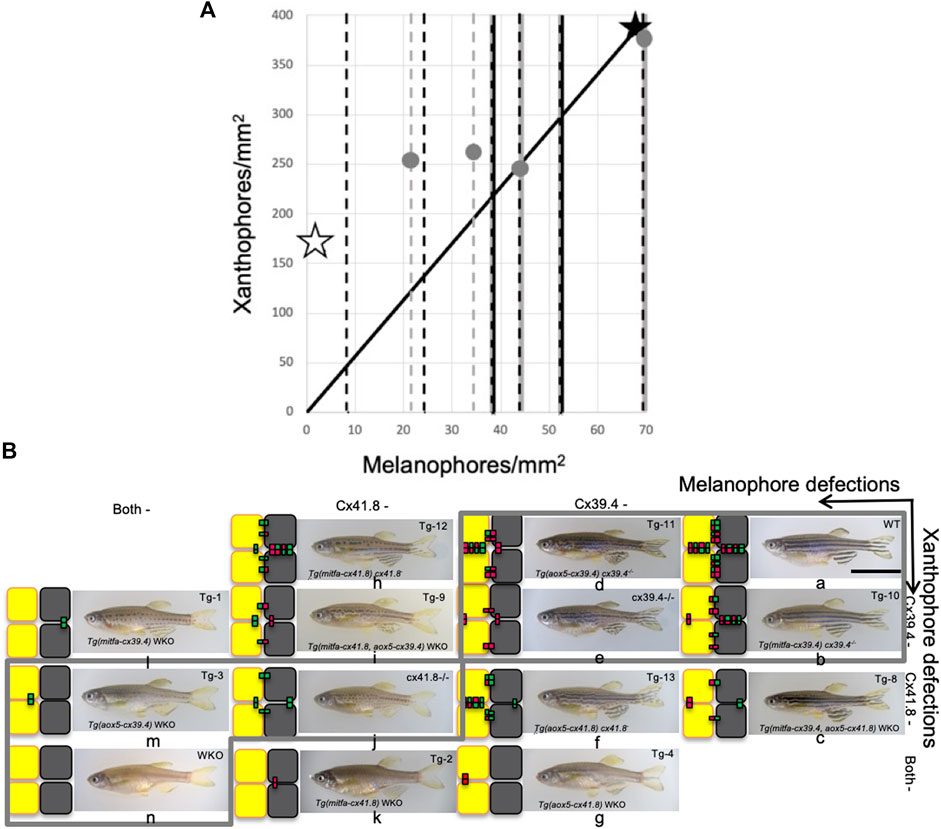
FIGURE 6. Shuffle of mutant fish that gives accordance with numerical results. (A) A scatterplot of two types of pigment cells. Stars and dots indicate shifts of proportion of pigment cells caused by experimental manipulations of connexin by [8]. However, most data can be obtained only about melanophores, so changes in melanophore number are indicated by broken lines. Simple broken lines indicate the addition of connexins to double knockout (WKO); black ones are “on melanophore,” and gray ones are “on xanthophore,” and broken lines with solid lines on the back denote deletion of connexon from WT; black dot on gray corresponds to “from melanophore” and gray dot on black “from xanthophore.” Solid lines indicate the proportion of WT. Open stars and filled ones indicate the values of WKO and WT, respectively. (B) Mutant fish are shuffled for accordance with numerical results in Figure 3I. Each small letter indicates the corresponding fish with simulation in the aspect of pattern selection.
Similar effects of connexin mutations (i.e., shift from stripe to dots) can be observed on both the body and fins. Because the fins lack iridophores, the effect on the pigment pattern formation depends on the relationship between melanophores and xanthophores. Even though pattern formation is achieved by the two types of cells, details on the role of iridophores in cellular interactions are revealed [10]. The evaluation of the iridophore function in similar modeling is also possible and should be attempted.
Using such a model with PDEs will lead to various mathematical analyses. For example, pattern size was mathematically analyzed with regard the model as combination of two-component systems here. This method cannot yet describe the independent pattern sizes of each type of pigment cell that are observed experimentally [22] and predicted numerically in this paper. Therefore, more sophisticated analyses are required in the future.
Data Availability Statement
The raw data supporting the conclusion of this article will be made available by the authors, without undue reservation.
Author Contributions
The author confirms being the sole contributor of this work and has approved it for publication.
Funding
This research was supported from Grant-in-Aid for Scientific Research on Innovative Areas (The Japan Society for the Promotion of Science), Periodicity and its modulation in plant No. 20H05421 and Research grant from Shimadzu Science Foundation.
Conflict of Interest
The authors declare that the research was conducted in the absence of any commercial or financial relationships that could be construed as a potential conflict of interest.
Publisher’s Note
All claims expressed in this article are solely those of the authors and do not necessarily represent those of their affiliated organizations, or those of the publisher, the editors and the reviewers. Any product that may be evaluated in this article, or claim that may be made by its manufacturer, is not guaranteed or endorsed by the publisher.
Acknowledgments
The author thanks Masakatsu Watanabe and Masafumi Inaba for stimulating discussions and important comments as well as members of the Higaki lab for providing a suitable environment to concentrate on this investigation. I also thank Editage (www.editage.com) for English language editing and the IROAST Proofreading/Publication Support Program. I would like to thank to S. Kondo.
References
1. Kondo S, Asai R. A Reaction-Diffusion Wave on the Skin of the marine Angelfish Pomacanthus. Nature (1995) 376:765–8. doi:10.1038/376765a0
2. Johnson SL, Africa D, Horne S, Postlethwait JH. Half-tetrad Analysis in Zebrafish: Mapping the Ros Mutation and the Centromere of Linkage Group I. Genetics (1995) 139:1727–35. doi:10.1093/genetics/139.4.1727
3. Johnson SL, Africa D, Walker C, Weston JA. Genetic Control of Adult Pigment Stripe Development in Zebrafish. Develop Biol (1995) 167:27–33. doi:10.1006/dbio.1995.1004
4. Kelsh RN. Genetics and Evolution of Pigment Patterns in Fish. Pigment Cel Res (2004) 17:326–36. doi:10.1111/j.1600-0749.2004.00174.x
5. Haffter P, Granato M, Brand M, Mullins MC, Hammerschmidt M, Kane DA, et al. The Identification of Genes with Unique and Essential Functions in the Development of the Zebrafish, Danio rerio. Development (1996) 123:1–36. doi:10.1242/dev.123.1.1
6. Watanabe M, Iwashita M, Ishii M, Kurachi Y, Kawakami A, Kondo S, et al. Spot Pattern Ofleopard Daniois Caused by Mutation in the zebrafishconnexin41.8gene. EMBO Rep (2006) 7:893–7. doi:10.1038/sj.embor.7400757
7. Kumar NM, Gilula NB. The gap junction Communication Channel. Cell (1996) 84:381–8. doi:10.1016/s0092-8674(00)81282-9
8. Usui Y, Aramaki T, Kondo S, Watanabe M. The Minimal gap-junction Network Among Melanophores and Xanthophores Required for Stripe Pattern Formation in Zebrafish. Development (2019) 146:dev181065. doi:10.1242/dev.181065
9. Volkening A. Linking Genotype, Cell Behavior, and Phenotype: Multidisciplinary Perspectives with a Basis in Zebrafish Patterns. Curr Opin Genet Develop (2020) 63:78–85. doi:10.1016/j.gde.2020.05.010
10. Maderspacher F, Nüsslein-Volhard C. Formation of the Adult Pigment Pattern in Zebrafish Requiresleopardandobelixdependent Cell Interactions. Development (2003) 130:3447–57. doi:10.1242/dev.00519
11. Parichy DM, Turner JM. Temporal and Cellular Requirements for Fms Signaling during Zebrafish Adult Pigment Pattern Development. Development (2003) 130:817–33. doi:10.1242/dev.00307
12. Nakamasu A, Takahashi G, Kanbe A, Kondo S. Interactions between Zebrafish Pigment Cells Responsible for the Generation of Turing Patterns. Proc Natl Acad Sci (2009) 106:8429–34. doi:10.1073/pnas.0808622106
13. Meinhardt H, Gierer A. Application of a Theory of Biological Pattern Formation Based on Lateral Inhibition. J Cel Sci. (1974) 15:132–46. doi:10.1242/jcs.15.2.321
14. Hamada H, Watanabe M, Lau HE, Nishida T, Hasegawa T, Parichy DM, et al. Involvement of Delta/Notch Signaling in Zebrafish Adult Pigment Stripe Patterning. Development (2014) 141:318–24. doi:10.1242/dev.099804
15. Watanabe M, Kondo S. Comment on "Local Reorganization of Xanthophores fine-tunes and Colors the Striped Pattern of Zebrafish". Science (2015) 348:297. doi:10.1126/science.1261947
16. Kondo S. An Updated Kernel-Based Turing Model for Studying the Mechanisms of Biological Pattern Formation. J Theor Biol (2017) 414:120–7. doi:10.1016/j.jtbi.2016.11.003
17. Volkening A, Sandstede B. Iridophores as a Source of Robustness in Zebrafish Stripes and Variability in Danio Patterns. Nat Commun (2018) 9:3231. doi:10.1038/s41467-018-05629-z
18. Owen JP, Kelsh RN, Yates CA. A Quantitative Modelling Approach to Zebrafish Pigment Pattern Formation. eLife (2020) 9:E52998. doi:10.7554/eLife.52998
19. Bullara D, De Decker Y. Pigment Cell Movement Is Not Required for Generation of Turing Patterns in Zebrafish Skin. Nat Commun (2015) 6:6971. doi:10.1038/ncomms7971
20. Konow C, Li Z, Shepherd S, Bullara D, Epstein IR. Influence of Survival, Promotion, and Growth on Pattern Formation in Zebrafish Skin. Sci Rep (2021) 11:9864. doi:10.1038/s41598-021-89116-4
21. Asai R, Taguchi E, Kume Y, Saito M, Kondo S. Zebrafish Leopard Gene as a Component of the Putative Reaction-Diffusion System. Mech Develop (1999) 89:87–92. doi:10.1016/s0925-4773(99)00211-7
22. Watanabe M, Kondo S. Changing Clothes Easily: connexin41.8 Regulates Skin Pattern Variation. Pigment Cel Melanoma Res (2012) 25:326–30. doi:10.1111/j.1755-148x.2012.00984.x
23. Shoji H, Iwasa Y, Kondo S. Stripes, Spots, or Reversed Spots in Two-Dimensional Turing Systems. J Theor Biol (2003) 224:339–50. doi:10.1016/s0022-5193(03)00170-x
24. Miyazawa S, Okamoto M, Kondo S. Blending of Animal Colour Patterns by Hybridization. Nat Commun (2010) 1:66–6. doi:10.1038/ncomms1071
25. Takahashi G, Kondo S. Melanophores in the Stripes of Adult Zebrafish Do Not Have the Nature to Gather, but Disperse when They Have the Space to Move. Pigment Cel Melanoma Res (2008) 21:677–86. doi:10.1111/j.1755-148x.2008.00504.x
26. Sawada R, Aramaki T, Kondo S. Flexibility of Pigment Cell Behavior Permits the Robustness of Skin Pattern Formation. Genes Cells (2018) 23:537–45. doi:10.1111/gtc.12596
27. Hirata M, Nakamura K-i., Kanemaru T, Shibata Y, Kondo S. Pigment Cell Organization in the Hypodermis of Zebrafish. Dev Dyn (2003) 227:497–503. doi:10.1002/dvdy.10334
28. Hirata M, Nakamura K-I, Kondo S. Pigment Cell Distributions in Different Tissues of the Zebrafish, with Special Reference to the Striped Pigment Pattern. Dev Dyn (2005) 234:293–300. doi:10.1002/dvdy.20513
29. Mahalwar P, Walderich B, Singh AP, Nüsslein-Volhard C. Local Reorganization of Xanthophores fine-tunes and Colors the Striped Pattern of Zebrafish. Science (2014) 345:1362–4. doi:10.1126/science.1254837
30. Watanabe M, Sawada R, Aramaki T, Skerrett IM, Kondo S. The Physiological Characterization of connexin41.8 and connexin39.4, Which Are Involved in the Striped Pattern Formation of Zebrafish. J Biol Chem (2016) 291:1053–63. doi:10.1074/jbc.m115.673129
31. Misu A, Yamanaka H, Aramaki T, Kondo S, Skerrett IM, Iovine MK, et al. Two Different Functions of Connexin43 Confer Two Different Bone Phenotypes in Zebrafish. J Biol Chem (2016) 291:12601–11. doi:10.1074/jbc.m116.720110
32. Watanabe M. Gap junction in the Teleost Fish Lineage: Duplicated Connexins May Contribute to Skin Pattern Formation and Body Shape Determination. Front Cel Dev. Biol. (2017) 5:13. doi:10.3389/fcell.2017.00013
34. Gierer A, Meinhardt H. A Theory of Biological Pattern Formation. Kybernetik (1972) 12:30–9. doi:10.1007/bf00289234
35. Murray JD. Mathematical Biology II – Spatial Models and Biomedical Applications. Seattle, WA: University of Washington (2003).
36. Ermentrout B. Stripes or Spots? Nonlinear Effects in Bifurcation of Reaction-Diffusion Equations on the Square. Proc R Soc A (1991) 434(1891). doi:10.1098/rspa.1991.0100
37. Miura T, Maini PK. Speed of Pattern Appearance in Reaction-Diffusion Models: Implications in the Pattern Formation of Limb Bud Mesenchyme Cells. Bull Math Biol (2004) 66(4):627–49. doi:10.1016/j.bulm.2003.09.009
38. Yamanaka H, Kondo S. In Vitro analysis Suggests that Difference in Cell Movement during Direct Interaction Can Generate Various Pigment Patterns In Vivo. Proc Natl Acad Sci U S A (2013) 111:1867–72. doi:10.1073/pnas.1315416111
39. Meinhardt H. Chapter 11. Cell Determination. In: PK Maini, and HG Othmer, editors. Models of Biological Pattern Formation. London: Academic Press (1982). p. 107–17.
40. Yamaguchi M, Yoshimoto E, Kondo S. Pattern Regulation in the Stripe of Zebrafish Suggests an Underlying Dynamic and Autonomous Mechanism. Proc Natl Acad Sci (2007) 104(12):4790–3. doi:10.1073/pnas.0607790104
41. Usui Y, Watanabe M. Role of the Connexin C-Terminus in Skin Pattern Formation of Zebrafish. BBA Adv (2021) 1:100006. doi:10.1016/j.bbadva.2021.100006
42. Inaba M, Yamanaka H, Kondo S. Pigment Pattern Formation by Contact-dependent Depolarization. Science (2012) 335:677. doi:10.1126/science.1212821
Keywords: pattern formation, turing pattern, mathematical model, reaction-diffusion system, connexin, fish pigmentation
Citation: Nakamasu AM (2022) Correspondences Between Parameters in a Reaction-Diffusion Model and Connexin Functions During Zebrafish Stripe Formation. Front. Phys. 9:805659. doi: 10.3389/fphy.2021.805659
Received: 30 October 2021; Accepted: 25 November 2021;
Published: 18 January 2022.
Edited by:
Istvan Lagzi, Budapest University of Technology and Economics, HungaryReviewed by:
Daishin Ueyama, Musashino University, JapanQingyu Gao, China University of Mining and Technology, China
István Szalai, Eötvös Loránd University, Hungary
Copyright © 2022 Nakamasu. This is an open-access article distributed under the terms of the Creative Commons Attribution License (CC BY). The use, distribution or reproduction in other forums is permitted, provided the original author(s) and the copyright owner(s) are credited and that the original publication in this journal is cited, in accordance with accepted academic practice. No use, distribution or reproduction is permitted which does not comply with these terms.
*Correspondence: Akiko M. Nakamasu, nakamasu@kumamoto-u.ac.jp