 Ze Wang
 Siyao Liu3,4
 Xiangyun Gao
 Zengru Di
94% of researchers rate our articles as excellent or good
Learn more about the work of our research integrity team to safeguard the quality of each article we publish.
Find out more
ORIGINAL RESEARCH article
Front. Phys., 31 January 2022
Sec. Social Physics
Volume 9 - 2021 | https://doi.org/10.3389/fphy.2021.800860
This article is part of the Research TopicNetwork Resilience and Robustness: Theory and ApplicationsView all 21 articles
Financial crisis, rooted in a lack of system resilience and robustness, is a particular type of critical transition that may cause grievous economic and social losses and should be warned against as early as possible. Regarding the financial system as a time-varying network, researchers have identified early warning signals from the changing dynamics of network motifs. In addition, network motifs have many different morphologies that unveil high-order correlation patterns of a financial system, whose synchronous change represents the dramatic shift in the financial system’s functionality and may indicate a financial crisis; however, it is less studied. This paper proposes motif transition intensity as a novel method that quantifies the synchronous change of network motifs in detail. Applying this method to stock networks, we developed three early warning indicators. Empirically, we conducted a horse race to predict ten global crises during 1991–2020. The results show evidence that the proposed indicators are more efficient than the VIX and the other 39 network-based indicators. In a detailed analysis, the proposed indicators send sensitive and comprehensible warning signals, especially for the U.S. subprime mortgage crisis and the European sovereign debt crisis. Furthermore, the proposed method provides a new perspective to detect critical signals and may be extended to predict other crisis events in natural and social systems.
Critical transition is a ubiquitous phenomenon in social-ecological fields [1, 2]. In financial markets, critical transition appears as financial crises [3, 4]. Considering that the outbreak of financial crises accompanies catastrophic system collapses and brings grievous economic and social losses, developing a precise early warning indicator is of great significance [5, 6]. With the finding that the interconnectedness of the financial system increased dramatically before financial crises, researchers have focused on detecting early warning signals by analyzing the interactions in a financial system [7–9]. Based on network theory, all system components can be linked by their interactions to form a network; exploring global network topologies helps quantify their interconnectedness to build early warning indicators [10]. Various studies of bank, guarantee, and stock networks have found empirical evidence that global network topologies can reveal financial crises [11–14]. However, a small portion of research has emphasized that more informative signals may hide in tiny changes of local network topologies [15] because networks in similar global topologies may differ noticeably at a local level [16]. Inspired by this phenomenon, we aim to propose a novel early warning indicator by analyzing local network topologies.
Network motif is a local network topology regarded as fundamental to a network [17, 18]. It shows intrinsic correlations with network resilience and robustness and can influence network functionality [16, 19]; thus is identified as a determinant of critical transition [20]. Considering that a financial crisis is rooted in a lack of system resilience and robustness, analyzing the evolution of the financial network motif deepens the understanding of financial stability and helps predict financial crises [15, 21]. Empirical studies have found that network motifs, in different morphologies, may change abruptly ahead of financial crises [22, 23]. However, it is difficult to robustly predict all financial crises by relying on one network motif with a specific morphology. To tackle this problem, simultaneously analyzing several network motifs in different morphologies is helpful. As each morphology of network motifs unveils a high-order correlation pattern of a financial network [24], their synchronous change represents the dramatic shift in the financial system’s functionality and may indicate a financial crisis [25]. In recent studies, researchers have found predictive signals by investigating network motifs distributions [21] and flickering behaviors [25]. This finding enlightens us to propose a better early warning indicator by describing more network motifs’ synchronous change in more detail.
According to the above idea, we propose motif transition intensity (MTI) as a novel early warning indicator for financial crises. It relies on directed triadic motifs (DTMs) that are node triplets with 13 morphologies [26]. By investigating all node triplets’ changing dynamics, MTI statistics show how many node triplets change from one morphology to another at different evolution times (shown in Figure 1). The result is defined as motif transition, capturing the change of DTMs in all 13 morphologies in more detail. When motif transition is intense, the network motifs are changed synchronously, which indicates the dramatic shift of a financial system’s correlation pattern and provides early warning signals for financial crises. Therefore, we quantify the intensity of motif transitions to build the MTI indicator. Compared to other methods, MTI has two advantages. 1) If the motif transition is calculated under different evolution times with ultrashort intervals, MTI can describe the marginal change of a financial system to unveil the leading force of the financial system’s integral evolution trend [27]. 2) From a bottom-up point of view, a motif is built by node/edge, and many motifs may share one node/edge, so a financial network can be considered established by overlapping and splicing a mass of motifs [28]. Thus, a slight change in nodes/edges may result in intricate and abundant changes in different motif morphologies. With these two advantages, MTI could be considered a sensitive signal amplifier to achieve more precise predictions of financial crises.
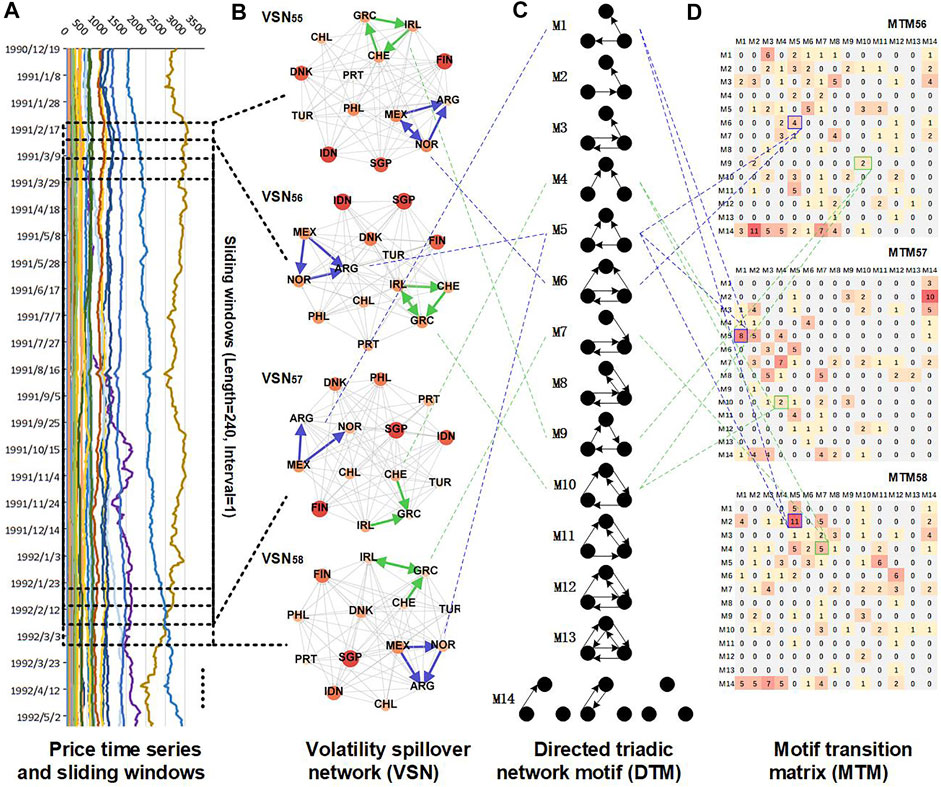
FIGURE 1. Flowchart of the main methodology. (A) The price data are divided into subsets using sliding windows. Four time-related windows are illustrated. (B) The VSN of each window is established. Two different node triplets are illustrated, i.e., {Argentina, Mexico, Norway} marked in blue and {Greece, Ireland, Switzerland} marked in green. Their motifs are identified and linked to the corresponding morphology in (C). (D) The statistics of motif transitions by analyzing the marginal change of each node triplet.
This paper computes the MTI indicator based on the volatility spillover network (VSN), which uncovers more financial crisis information [29, 30]. Furthermore, we use the sliding window method to explore the changing dynamics of DTMs of the VSN [31, 32]. Moreover, to fully exhibit the performance of the proposed method, three intensity measurements are used to quantify the MTI indicator: quantity, density, and uniformity. Empirically, we conducted a horse race of the MTI indicators and 39 other widely used network-based indicators to predict ten influential global financial crises to demonstrate their efficiency. Methodologically, our novel approach contributes to designing more sensitive and reliable network-based early warning indicators, which can serve as a component in hybrid data-driven warning systems [33]. In term of applications, our indicators can extend applications to other vital socioeconomic crises, such as climate change, political conflicts, and pandemic influenza [1].
This paper is organized as follows: Materials and Methods describes the material and methods, Results and Discussion discusses empirical results, and Conclusion concludes the significant findings.
This paper focuses on the early warning of financial crises in the global financial system. We use the closing price of 73 MSCI country/region indices as proxies for country-level financial markets and build a VSN to represent the global financial system. Moreover, we choose the Chicago Board Options Exchange Volatility Index (VIX) as a benchmark. All data are accessed from the WIND database and span from 1990.12.19 to 2020.9.8 (7267 total trading days). In this period, we summarized ten influential financial crises, as shown in Table 1.
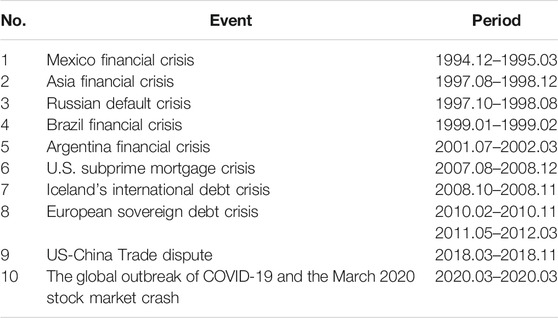
TABLE 1. Ten influential global financial crises from 1991 to 2020.
Names and abbreviations of the indices are Argentina (ARG), United Arab Emirates (United Arab Emirates), Oman (Oman), Egypt, Arab Rep. (EGY), Ireland (IRL), Estonia (EST), Austria (AUT), Australia (AUS), Pakistan (PAK), Bahrain (BHR), Brazil (BRA), Bulgaria (BGR), Belgium (BEL), Poland (POL), Botswana (BWA), Denmark (DNK), Germany (DEU), Russian Federation (RUS), France (FRA), Philippines (PHL), Finland (FIN), Colombia (COL), Kazakhstan (KAZ), Korea, Rep. (KOR), Netherlands (NLD), Canada (CAN), Ghana (GHA), Czech Republic (CZE), Qatar (QAT), Kuwait (KWT), Croatia (HRV), Kenya (KEN), Lebanon (LBN), Lithuania (LTU), Romania (ROU), Malaysia (MYS), Mauritius (MUS), United States (USA), Peru (PER), Morocco (MAR), Mexico (MEX), South Africa (ZAF), Nigeria (NGA), Norway (NOR), Portugal (PRT), Japan (JPN), Sweden (SWE), Switzerland (CHE), Saudi Arabia (SAU), Sri Lanka (LKA), Slovenia (SVN), Thailand (THA), Trinidad and Tobago (TTO), Tunisia (TUN), Turkey (TUR), Ukraine (UKR), Spain (ESP), Greece (GRC), Singapore (SGP), New Zealand (NZL), Hungary (HUN), Jamaica (JAM), Israel (ISR), Italy (ITA), India (IND), Indonesia (IDN), United Kingdom (GBR), Jordan (JOR), Vietnam (VNM), Chile (CHL), China (CHN), Taiwan, China (TWN), Hong Kong, China (HKG).
We propose five steps to quantify the motif transition intensity and build novel early warning indicators. These steps are shown in Figure 1 and listed below.
Step 1: Data preparations and the sliding window method.This paper computes the return of each price time-series for analysis and uses the sliding window method to analyze the changing dynamics of the financial system. The sliding window method divides the full price return data into time-related subsets, as shown in Figure 1A. The length and ultrashort intervals of the window are 240 and 1 trading day, respectively. This helps us obtain 7028 data subsets, each of which is used to build a financial network.
For the price return under each sliding window, each should pass a stationary, normality, and ARCH effect test to provide statistically rigorous results. Moreover, if a price return is 24 (10% of the sliding window’s length) or more consecutive days of the trading suspension, it will be abandoned due to possible high noise.
Step 2: Volatility spillover network establishment.This paper builds a financial network based on investigating volatility spillover correlations among all components in a financial system. The volatility spillover correlation measures the co-movement interactions of financial entities, which helps capture risk contagion paths and is widely used in financial crisis studies. Examining the volatility spillover correlation relies on econometric models that provide more rigorous results to reveal more financial crisis information than other causal inference methods. Among them, the BEKK-GARCH model has the advantages of less information loss and more flexibility. Therefore, we adopt the bivariate BEKK-GARCH model of order one and lay one to build financial networks.
We run the BEKK-GARCH model on the return of two financial markets
Step 3: Network motif identifications.Our work focuses on DTMs, whose 13 morphologies are defined as
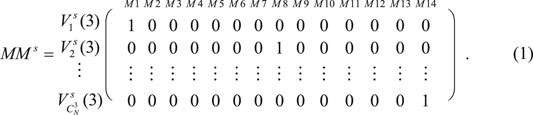
Step 4: Motif transition statistics.Motif transition describes the number of changed motif morphologies of all node triplets between two time steps, providing more detailed information on network motif changes than the evolution of the network motif distribution. As mentioned in Step 1, the step size of the sliding windows is 1 day, which is sufficiently short of describing a financial system’s marginal change. For every two time-adjacent windows, the motifs are identified and recorded in
Then, by operating matrix multiplication, motif transitions can be captured by a
Step 5: Early warning indicator development.Intuitively, if motif transitions are intense, more network motifs are changed synchronously; this indicates the dramatic shift of a financial system’s correlation pattern and provides early warning signals for financial crises. Based on this idea, we propose the motif transition intensity (MTI) indicator by using three intensity measures on
First, MT.S measures the quantity of motif transition. It is a simple indicator that quantifies the total number of the changed motifs by summarizing all elements in
Second, MT.D measures the diversity of motif transitions. Specifically, MT. D quantifies how many network motif morphologies are involved in the change of network motifs. As mentioned in the Introduction, network motif morphologies represent different financial correlation patterns, and a higher MT.D indicates a significant change in a financial system’s functionality and may indicate a financial crisis. In
Third, MT.E measures the uniformity of the motif transition, which is a comprehensive indicator that considers both the quantity and diversity of the motif transition. Imagining a situation where the motif transition involves many motif morphologies with a similar quantity, all network motifs change synchronously and indicate a financial crisis. MT.E aims to measure whether the network motifs in all 14 morphologies are changed equally by using an entropy measurement. In particular, we adopt the negative generalized entropy index [35, 36] to quantify the uniformity of
In Eq. 5, to eliminate the influence of motifs’ prior distribution, we scale
In our research, the global financial system is assumed to have two actual states, i.e., crisis and safe, which could be labeled according to the crisis events in Table 1. The proposed early warning indicators predict a crisis state of the global financial system if it exceeds a certain threshold; otherwise, they predict a safe state. If the predicted states exactly meet the actual states, the early warning indicator is regarded as good performance. To judge quantitatively, we selected five criteria: area under the receiver operating characteristic curve (AUC), accuracy (A), coverage rate (CR), F1 score, and F2 score. Among them, A is the ratio of the correct crisis predictions to the actual crisis states; CR is the ratio of the correct crisis predictions to the predicted crisis states; F1 and F2 are comprehensive measurements of A and CR, where F1 emphasizes A and F2 emphasizes CR; AUC measures whether a randomly chosen crisis state is risker than that of a safe state, which unveils the early warning signal’s credibility. The descriptions and formulations of the five metrics have been comprehensively introduced in the related Ref. [37, 38].
In Figure 2, we plot the three proposed MTI indicators and the benchmark indicator VIX for comparisons. All four indicators can successfully predict the financial crisis, yet our indicators perform better in three aspects. First, our indicators could send efficient warning signals for the U.S. subprime mortgage crisis and the European sovereign debt crisis (the periods are marked in red in Figure 2). Remarkably, the proposed indicators are at least 6 months ahead of VIX to the sent warning signals.
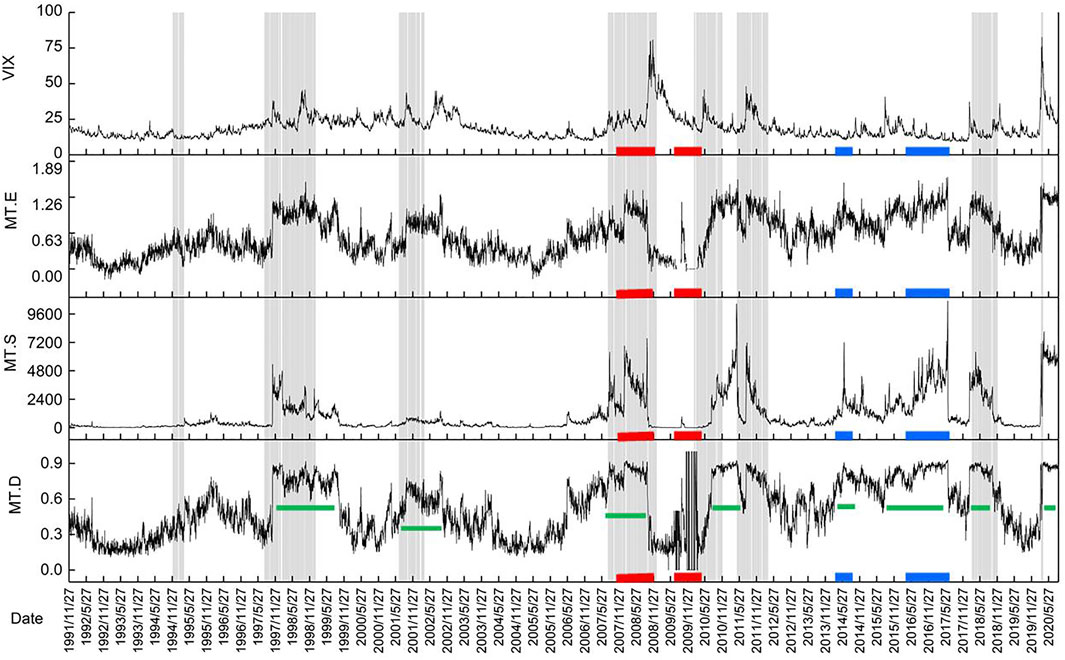
FIGURE 2. Time series of the three novel early warning indicators and the VIX index. Four panels in this figure show the evolution of the global financial system’s status. The x-axis of all panels is aligned. The background of the ten influential financial crises is marked in gray.
Second, our indicators are sensitive to early warning. Compared to VIX, they reveal three additional impactive events, i.e., the Crimea crisis, the United States withdrawal from the Trans-Pacific Partnership, and the United Kingdom’s official launch of Brexit negotiations (all periods are marked in blue in Figure 2). The Crimea crisis shows deepening geographical and political conflict, and the other two events demonstrate that the development pattern of the global economy is reaching a tipping point [39]. They are external financial system shocks whose influence is not secondary to financial crises.
Third, our indicators send more comprehensible warning signals than VIX. Mainly, MT.D persistently obtains high values before and during financial crisis periods, similar to step signals. In contrast, VIX obtains short-lived high values before financial crises, such as pulse signals (the periods are marked in green in panel 4 of Figure 2). Noticeably, step signals can indicate financial crises without ambiguity compared to pulse signals.
In summary, the three proposed MTI indicators perform more efficiently, sensitively, and comprehensibly than VIX. That is especially true for MT.D. These results prove that the changing dynamics of motif transition intensity can validly capture the marginal change of the financial system to reveal financial crises, which provides a new perspective to detect early warning signals.
To quantitatively analyze the early warning abilities of the three proposed MTI indicators in detail, we conducted a horse race for the ten financial crises during 1991–2020. We choose both statistics-based indices and network topology-based indices as comparative variables to make a comprehensive comparison. The statistics-based indices includes VIX and the total variance of the global financial system (denoted as TV, computed by the sum of the variance and covariance of all indices’ return of each sliding window). They are set as benchmarks of our study.
The network topology-based index includes 39 widely used indices. Among these, six indices quantify the global features of the VSN: edge number (EN), node number (NN), average distance (AD), density (DEN), diameter (DIA), and assortativity (ASO). Seven indices quantify the partial features of the VSN by averaging the network centralities of each node: indegree (AID), outdegree (AOD), closeness centrality (ACLO), betweenness centrality (ABTW), clustering coefficient (ACLU), eigenvector centrality (AEGV), and PageRank (APAG). The other 26 indices include the statistical quantity of the 13 motifs, denoted as M1-M13, and the z-score2 of the 13 motifs, denoted as M1. Z-M13.Z. The descriptions and formulations of the indices have been comprehensively introduced in the related Ref. [40–43].
We conducted two tests to investigate the early warning ability of all indices. In Test 1, we use data from January 1, 1996 to December 31, 2013 to make predictions. In Test 2, we use complete sample data to make predictions of all the ten influential financial crises. Considering that Test 1 involves an important period that includes the most destructive financial crises, e.g., the 1997 Asian financial crisis, the 2007 subprime crisis, and the 2010 European sovereign debt crisis, a better early warning indicator should have better performance in Test 1. More importantly, a robust indicator should obtain similar performance in both tests. As mentioned in Early Warning Performance Evaluation, we selected five criteria to fully express the early warning ability: area under the receiver operating characteristic curve (AUC), accuracy (A), coverage rate (CR), F1 score, and F2 score [37, 38]. We examine the early warning ability with a lead time of 0–400 trading days for each index and record the highest score and corresponding time (denoted as AUC.t, A.t, CR.t, F1.t, and F2.t). To provide a more intuitive presentation, we drew a color bubble chart to visualize the results, as shown in Figure 3; the detailed results are in the Supplementary Material.
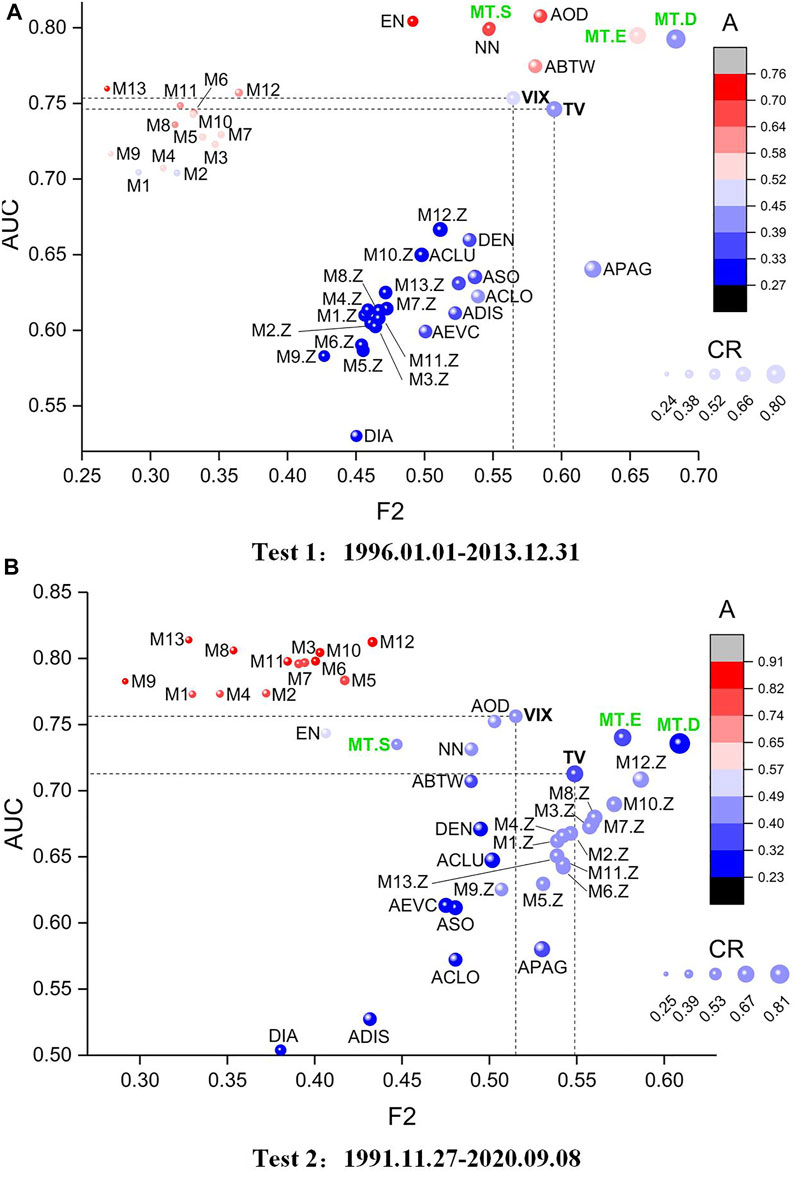
FIGURE 3. Visualization of the results of the horse race. We use AUC and F2 as the y- and x-axes and CR and A for auxiliary analysis. The drop lines highlight the AUC and F2 of the two benchmarks. The labels of the three proposed MTI indicators (MT.S, MT.E, MT.D) are marked in green. (A) Test 1:1996.01.01-2013.12.31. (B) Test 2:1991.11.27-2020.09.08.
When evaluating an early warning indicator, it is difficult to strike a balance between A and CR. Our purpose is to predict the influential financial crises that may result in grievous economic and social losses if underreported, so we think CR weighs higher than A and pay more attention to F2. Moreover, it is well known that a better early warning indicator should have a higher AUC. Therefore, we pay more attention to AUC and F2. As shown in Figure 3, the indices in the upper right corner of the plots perform better than the others. In Test 1, MT.D, MT.E, and AOD have higher AUC and F2 than other indicators. In addition, the lead times of MT. D and MT.E are longer than AOD. This observation indicates that our MTI indicators have better performance than others. In Test 2, the performance of all early warning indicators is changed more or less compared to Test 1. Among them, M1-M13 had the highest AUC in Test 2 but had a median AUC in Test 1. Considering that their performance is quite different between Test 1 and Test 2, such quantity measurements have less robustness. Moreover, their F2 and CR are relatively low, reducing their efficiency in early warning financial crises. Therefore, they are not the best early warning indicators. For the other indicators, VIX had the highest AUC, and TV had a higher CR. Among the network-based indices, AOD, EN, and NN have comparable AUCs with VIX; however, their CR is lower than those of VIX and TV. In contrast, MT. D and MT.E have close AUC with VIX and still have the highest F2. All results prove that our MTI indicators perform better than the benchmarks and other network-based indices.
This study introduces motif transition intensity as a novel network-based approach to provide an early warning against financial crises. It provides a new perspective to detect early warning signals by analyzing the microstructure and marginal change of the volatility spillover network. We adopt three intensity measures to develop three indicators: MT.S, MT.D, MT.E. By conducting a horse race, the proposed indicators are shown to have better early warning abilities than VIX and the other 39 network-based indicators. More specifically, the proposed indicators can provide efficient and comprehensible warning signals for influential global financial crises and even impactive socioeconomic events, which serve as a component in hybrid data-driven warning systems. Furthermore, the application of the proposed indicators can be extended beyond financial systems. Since crisis signals may embed in the time series of many other vital socioeconomic areas, the applications may reach climate and social systems, e.g., climate change, political conflicts, and pandemic influenza.
Publicly available datasets were analyzed in this study. This data can be found here: https://www.wind.com.cn/.
ZW, XG, and ZD designed the research. ZW, CH, SH, and SL performed the computations. SL compiled the dataset. ZW and SL prepared the figures and tables. ZW and RT analyzed the results. ZW, SL, CH, and ZD wrote the manuscript. All authors have read and approved the manuscript.
This research is supported by the China Postdoctoral Science Foundation (Grant No. 2020M680435), the National Natural Science Foundation of China (Grant Nos 71731002, 41801106, 71991485, 71991481, and 71991480), the Fundamental Research Funds for the Central Universities (Grant Nos 2652018247 and 2652019085), and the German Ministry for Education and Research (BMBF Grant No. 03EK3055B).
The authors declare that the research was conducted in the absence of any commercial or financial relationships that could be construed as a potential conflict of interest.
All claims expressed in this article are solely those of the authors and do not necessarily represent those of their affiliated organizations, or those of the publisher, the editors and the reviewers. Any product that may be evaluated in this article, or claim that may be made by its manufacturer, is not guaranteed or endorsed by the publisher.
The authors would like to express their gratitude to Prof. Ying Fan, Dr. Bowen Sun, Dr. Qingru Sun, and Dr. Xueyong Liu, who provided valuable suggestions.
The Supplementary Material for this article can be found online at: https://www.frontiersin.org/articles/10.3389/fphy.2021.800860/full#supplementary-material
1The null model in this research is constructed by randomly reshuffling network links, while keeping the node and edge numbers the same as in the original networks. This could highlight the uniqueness of a network’s structure property by comparing it to its corresponding null model.
2Network motif’s z-score is computed to quantify the significance of a motif by comparing it to null models. It has been proven that the abrupt change of a network’s z-score can help in early warning of the great financial crisis in 2008. In addition, we construct 10 null models for each VSN to compute each network motif’s z-score.
1. Scheffer M, Carpenter SR, Lenton TM, Bascompte J, Brock W, Dakos V, et al. Anticipating Critical Transitions. Science (2012) 338(6105):344–8. doi:10.1126/science.1225244
2. Shai S, Kenett DY, Kenett YN, Faust M, Dobson S, Havlin S Critical Tipping point Distinguishing Two Types of Transitions in Modular Network Structures. Phys Rev E (2015) 92(6):062805. doi:10.1103/PhysRevE.92.062805
3. Jurczyk J, Rehberg T, Eckrot A, Morgenstern I Measuring Critical Transitions in Financial Markets. Sci Rep (2017) 7(1):11564. doi:10.1038/s41598-017-11854-1
4. Diks C, Hommes C, Wang J Critical Slowing Down as an Early Warning Signal for Financial Crises. Empir Econ (2019) 57(4):1201–28. doi:10.1007/s00181-018-1527-3
5. Billio M, Getmansky M, Lo AW, Pelizzon L Econometric Measures of Connectedness and Systemic Risk in the Finance and Insurance Sectors. J Financial Econ (2012) 104(3):535–59. doi:10.1016/j.jfineco.2011.12.010
6. Sandhu RS, Georgiou TT, Tannenbaum AR Ricci Curvature: An Economic Indicator for Market Fragility and Systemic Risk. Sci Adv (2016) 2(5):e1501495. doi:10.1126/sciadv.1501495
7. Gai P, Kapadia S Networks and Systemic Risk in the Financial System. Oxford Rev Econ Pol (2019) 35(4):586–613. doi:10.1093/oxrep/grz023
8. Martinez-Jaramillo S, Carmona CU, Kenett DY Interconnectedness and Financial Stability. J Risk Manag Financial Institutions (2019) 12:168–83.
9. Samal A, Kumar S, Yadav Y, Chakraborti A Network-centric Indicators for Fragility in Global Financial Indices. Front Phys (2021) 8:624373. doi:10.3389/fphy.2020.624373
10. Li Y, Zhuang X, Wang J, Zhang W Analysis of the Impact of Sino-US Trade Friction on China's Stock Market Based on Complex Networks. North Am J Econ Finance (2020) 52:101185. doi:10.1016/j.najef.2020.101185
11. Gao Y-C, Wei Z-W, Wang B-H Dynamic Evolution of Financial Network and its Relation to Economic Crises. Int J Mod Phys C (2013) 24(2):1350005–10. doi:10.1142/S0129183113500058
12. Kuyyamudi C, Chakrabarti AS, Sinha S Emergence of Frustration Signals Systemic Risk. Phys Rev E (2019) 99(5):052306. doi:10.1103/PhysRevE.99.052306
13. Kukreti V, Pharasi HK, Gupta P, Kumar S A Perspective on Correlation-Based Financial Networks and Entropy Measures. Front Phys (2020) 8:00323. doi:10.3389/fphy.2020.00323
14. Yang M-Y, Ren F, Li S-P Stock Network Stability after Crashes Based on Entropy Method. Front Phys (2020) 8:00163. doi:10.3389/fphy.2020.00163
15. Bardoscia M, Battiston S, Caccioli F, Caldarelli G Pathways towards Instability in Financial Networks. Nat Commun (2017) 8:14416. doi:10.1038/ncomms14416
16. Dey AK, Gel YR, Poor HV What Network Motifs Tell Us about Resilience and Reliability of Complex Networks. Proc Natl Acad Sci USA (2019) 116(39):19368–73. doi:10.1073/pnas.1819529116
17. Yu S, Feng Y.-F., Zhang D, Bedru HD, Xu B, Xia F Motif Discovery in Networks: A Survey. Comp Sci Rev (2020) 37:100267. doi:10.1016/j.cosrev.2020.100267
18. Mursa B-E -M, Dioşan L, Andreica A Network Motifs: A Key Variable in the Equation of Dynamic Flow between Macro and Micro Layers in Complex Networks. Knowledge-Based Syst (2021) 213:106648. doi:10.1016/j.knosys.2020.106648
19. Angulo MT, Liu Y-Y, Slotine J-J Network Motifs Emerge from Interconnections that Favour Stability. Nat Phys (2015) 11(10):848–52. doi:10.1038/nphys3402
20. Wunderling N, Stumpf B, Krönke J, Staal A, Tuinenburg OA, Winkelmann R, et al. How Motifs Condition Critical Thresholds for Tipping Cascades in Complex Networks: Linking Micro- to Macro-Scales. Chaos (2020) 30(4):043129. doi:10.1063/1.5142827
21. Xie W-J, Yong Y, Wei N, Yue P, Zhou W-X Identifying States of Global Financial Market Based on Information Flow Network Motifs. North Am J Econ Finance (2021) 58:101459. doi:10.1016/j.najef.2021.101459
22. Squartini T, van Lelyveld I, Garlaschelli D Early-warning Signals of Topological Collapse in Interbank Networks. Sci Rep (2013) 3:3357. doi:10.1038/srep03357
23. Chen D.-D., Guo X.-C., Wang J.-J., Liu J.-T., Zhang Z.-H., Hancock ER Thermodynamic Motif Analysis for Directed Stock Market Networks. Pattern Recognition (2021) 114:107872. doi:10.1016/j.patcog.2021.107872
24. Benson AR, Gleich DF, Leskovec J Higher-order Organization of Complex Networks. Science (2016) 353(6295):163–6. doi:10.1126/science.aad9029
25. Gatfaoui H, de Peretti P Flickering in Information Spreading Precedes Critical Transitions in Financial Markets. Sci Rep (2019) 9:5671. doi:10.1038/s41598-019-42223-9
26. Milo R, Shen-Orr S, Itzkovitz S, Kashtan N, Chklovskii D, Alon U Network Motifs: Simple Building Blocks of Complex Networks. Science (2002) 298(5594):824–7. doi:10.1126/science.298.5594.824
27. Filatova T, Polhill JG, van Ewijk S Regime Shifts in Coupled Socio-Environmental Systems: Review of Modelling Challenges and Approaches. Environ Model Softw (2016) 75:333–47. doi:10.1016/j.envsoft.2015.04.003
28. Liu S.-Y., Huang S.-P., Chi Y.-X., Feng S.-D., Li Y, Sun Q.-R. Three-level Network Analysis of the North American Natural Gas price: A Multiscale Perspective. Int Rev Financial Anal (2020) 67:101420. doi:10.1016/j.irfa.2019.101420
29. Li W.-W., Hommel U, Paterlini S Network Topology and Systemic Risk: Evidence from the Euro Stoxx Market. Finance Res Lett (2018) 27:105–12. doi:10.1016/j.frl.2018.02.016
30. Mensi W, Boubaker FZ, Al-Yahyaee KH, Kang SH Dynamic Volatility Spillovers and Connectedness between Global, Regional, and GIPSI Stock Markets. Finance Res Lett (2018) 25:230–8. doi:10.1016/j.frl.2017.10.032
31. Silva TC, de Souza SRS, Tabak BM Structure and Dynamics of the Global Financial Network. Chaos, Solitons & Fractals (2016) 88:218–34. doi:10.1016/j.chaos.2016.01.023
32. Lee TK, Cho JH, Kwon DS, Sohn SY Global Stock Market Investment Strategies Based on Financial Network Indicators Using Machine Learning Techniques. Expert Syst Appl (2019) 117:228–42. doi:10.1016/j.eswa.2018.09.005
33. Samitas A, Kampouris E, Kenourgios D Machine Learning as an Early Warning System to Predict Financial Crisis. Int Rev Financial Anal (2020) 71:101507. doi:10.1016/j.irfa.2020.101507
34. Wang Z, Gao X.-Y., An H.-Z., Tang R.-W., Sun Q.-R. Identifying Influential Energy Stocks Based on Spillover Network. Int Rev Financial Anal (2020) 68:101277. doi:10.1016/j.irfa.2018.11.004
35. Kauê Dal’Maso Peron T, da Fontoura Costa L, Rodrigues FA The Structure and Resilience of Financial Market Networks. Chaos (2012) 22(1):013117. doi:10.1063/1.3683467
36. Zhou R.-X., Cai R, Tong G.-Q. Applications of Entropy in Finance: A Review. Entropy (2013) 15(11):4909–31. doi:10.3390/e15114909
37. Shao Z, Zheng Q.-R., Yang S.-L., Gao F, Cheng M.-L., Zhang Q, et al. Modeling and Forecasting the Electricity Clearing price: A Novel BELM Based Pattern Classification Framework and a Comparative Analytic Study on Multi-Layer BELM and LSTM. Energ Econ (2020) 86:104648. doi:10.1016/j.eneco.2019.104648
38. Spelta A, Flori A, Pecora N, Pammolli F Financial Crises: Uncovering Self-Organized Patterns and Predicting Stock Markets Instability. J Business Res (2021) 129:736–56. doi:10.1016/j.jbusres.2019.10.043
39. Womack B International Crises and China's Rise: Comparing the 2008 Global Financial Crisis and the 2017 Global Political Crisis. Chin J Int Polit (2017) 10(4):383–401. doi:10.1093/cjip/pox015
40. Lü L.-Y., Chen D.-B., Ren X-L, Zhang Q-M, Zhang Y-C, Zhou T Vital Nodes Identification in Complex Networks. Phys Rep (2016) 650:1–63. doi:10.1016/j.physrep.2016.06.007
41. León C, Machado C, Sarmiento M Identifying central Bank Liquidity Super-spreaders in Interbank Funds Networks. J Financial Stab (2018) 35:75–92. doi:10.1016/j.jfs.2016.10.008
42. Huang C.-X., Wen S.-G., Li M.-G., Wen F.-H., Yang X An Empirical Evaluation of the Influential Nodes for Stock Market Network: Chinese A-Shares Case. Finance Res Lett (2021) 38:101517. doi:10.1016/j.frl.2020.101517
Keywords: early warning signal, critical transition, financial crisis, volatility spillover, network motif
Citation: Wang Z, Liu S, Han C, Huang S, Gao X, Tang R and Di Z (2022) Motif Transition Intensity: A Novel Network-Based Early Warning Indicator for Financial Crises. Front. Phys. 9:800860. doi: 10.3389/fphy.2021.800860
Received: 24 October 2021; Accepted: 10 December 2021;
Published: 31 January 2022.
Edited by:
Gaogao Dong, Jiangsu University, ChinaReviewed by:
Xiaoke Xu, Dalian Nationalities University, ChinaCopyright © 2022 Wang, Liu, Han, Huang, Gao, Tang and Di. This is an open-access article distributed under the terms of the Creative Commons Attribution License (CC BY). The use, distribution or reproduction in other forums is permitted, provided the original author(s) and the copyright owner(s) are credited and that the original publication in this journal is cited, in accordance with accepted academic practice. No use, distribution or reproduction is permitted which does not comply with these terms.
*Correspondence: Zengru Di, emRpQGJudS5lZHUuY24=
Disclaimer: All claims expressed in this article are solely those of the authors and do not necessarily represent those of their affiliated organizations, or those of the publisher, the editors and the reviewers. Any product that may be evaluated in this article or claim that may be made by its manufacturer is not guaranteed or endorsed by the publisher.
Research integrity at Frontiers
Learn more about the work of our research integrity team to safeguard the quality of each article we publish.