- 1Department of Physics, Fudan University, Shanghai, China
- 2Department of Human and Engineered Environmental Studies, Graduate School of Frontier Science, The University of Tokyo, Kashiwa, Japan
This paper initiates the analysis of the relation between evacuation time and group size by applying an extended floor-field cellular automaton model. Multi-speed-agents, a group structure containing leaders and followers, and a local-density-dependent dynamic field are implemented all together in the model. Most importantly, a complete binding mechanism which includes leaders waiting for followers is brought up for the first time. A counterintuitive negative relation between evacuation time and group size is discovered in one-group-type simulations, which corresponds to a previous experimental finding. An entropy-like quantity, namely the mixing index, is constructed to analyze the cause of that relation. It is found that under the binding mechanism, the higher degree of group mixing, the longer the evacuation time will be. Moreover, through a constant scale transformation, it is shown that the mixing index can be a key indicator that contains useful information about the evacuation system.
1 Introduction
Pedestrian and evacuation dynamics (PED) is a topic that stems from practical situations in human society as well as from non-equilibrium physics [1, 2], which is attracting more and more interests from sociologists, computer scientists and physicists. Various models have been applied to simulation studies of PED [3], including the social force model [4–7], the centrifugal force model [8–11], the Reciprocal Velocity Obstacles model [12] and the cellular automaton (CA) model [13–16], etc., among which the CA model stands out not only for its computational efficiency but also for its higher extendibility [17].
Group structure has been an important issue in PED [18–20] yet not fully understood through present studies. In most cases of evacuation, instead of acting like independent individuals, people tend to make their efforts to evacuate with their family, close friends, or even acquaintances at the site. Such action would lead to the formation of a number of small groups on the evacuation spot. Regarding the evacuating behavior, agents belonging to the same group would be more likely to stay together, a conceivable phenomenon that we categorize as the effects of binding in this article. Lili Lu et al. employed a floor-field-based CA model including the group structure by exploiting the extendibility of the CA model [14, 16]. Through both numerical and field experiments in their study, the authors found that basically evacuation time has no relation with group size. However, we want to point out that this observation needs to be investigated carefully since only one part of the binding effects, that is, group members following their leaders, is considered in Lili Lus model. Another part of the binding effects, namely leaders waiting for the followers, should also be taken into account.
In this study, we aim to conduct a detailed study on the binding effects in a group-structured PED with an extended floor-field CA model. The construction of floor-field and efficiency function for agents to decide their motion is based on the work of Lili Lu et al [14], though we also made a series of extensions including the implementation of diverse walking abilities for agents [13] and the adoption of a local-density-dependent dynamic floor field. The latter extension can be justified by considering the necessary condition for the occurrence of herding behavior in the evacuation. Most importantly, while the mechanism of following is kept unchanged, we added a waiting mechanism among the group members such that group leaders would not move forward until they could find their followers within a predetermined distance.
Based on qualitative and quantitative analyses, we find, from a large number of simulations of the one-group-type evacuation, an unexpected negative dependence of evacuation time on group size. Since intuitively we would presume a tightly bound larger blocks would take longer time to excavate compared with smaller ones. An intuitional limit case would be that sand can be poured out of the same sand glass faster than stones. We show that such a negative dependence actually originates from the binding mechanism. As the binding weakens, the negative dependence gets weaker. To explain the deviation from our intuition (that the evacuation time of larger groups should be longer than that of small groups under the binding mechanism), we proposed an entropy-like quantity, namely the mixing index, by applying a transformation of representation [21] from agents to grids. We reveal that the mixing index will decrease as the group size gets larger, which can serve as the cause of the negative dependence of evacuation time on group size.
The body of the paper is organized as follows. Section 2 is devoted to the construction of the extended floor-field based CA model with the complete binding mechanism. The validation of our model is also shown in the same section. Section 3 exhibits the simulation results from which the relation between evacuation time and group size is found. The definition of mixing index is introduced in Section 4, with which the cause of negative dependence of evacuation time on group size is explained. Finally, the conclusion of the whole study is given in Section 5.
2 Model
2.1 General Description
Basic components of our model include the evacuating agents and floors of the evacuation area. The floor is discretized into (L + 2) (L + 2) grids of an equal size. The evacuating agents can only move in the central L × L area. Boundaries of the whole area are denoted as (0, k), (L + 1, k), (k, 0) (k, L + 1) with k = 0, 1, … , L, L + 1. Two exits, each of which has a width of l grids, are symmetrically positioned on the right boundary with the distance of l grids from upper (lower) boundary, as shown in Figure 1A.
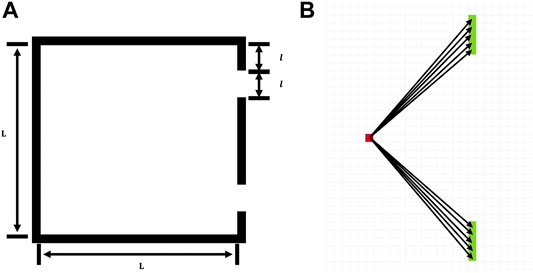
FIGURE 1. Configuration of evacuation area (A) and Distance evaluation of evacuation paths (from top to bottom are labelled sequentially from 1 to 10) (B).
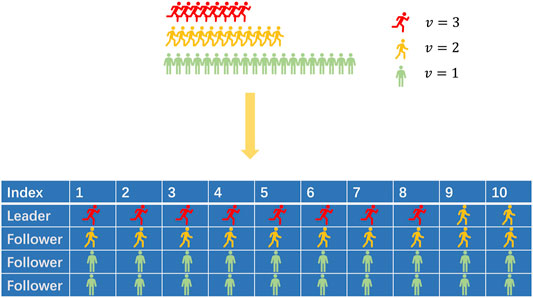
There exist three types of evacuating agents, assigned with different moving speeds: v = 1, 2, 3 grids per time-step. Agents with multiple moving speeds (multi-speed-agents hereafter) stand and move on the floor, with their locations labeled by the coordinates of the grids which they are occupying. Note that every agent can occupy only one grid and each grid can accommodate only one agent at a given moment. Hence the existence of an agent on a given grid can be denoted as a binary variable
2.2 Static and Dynamic Floor-Fields
By analogy with the electric and magnetic fields in physical space, it is assumed that there are floor-fields that will affect the movement of agents through the working of the efficiency function. We assume that the floor-fields have two components: the static floor-field and the dynamic floor-field [14].
The strength of static floor-field on grid (i, j) is denoted as Si,j, which is determined by the distance from the grid to the nearest exit. The purpose for the introduction of such a static field is to model the behavior of a perfectly rational and fully informed evacuating agent, who takes the direct distance to the exit as the only consideration in making decisions during the evacuation. To be more specific, the static floor field is set by following three steps [14]: 1) Select a grid and evaluate the distances di (i = 1, … , n) from the current grid to the two exits through all the n possible direct paths, in reference with Figure 1B. 2) Select the shortest path dmin from d1 … dn, and set the reciprocal of this distance as the static floor-field strength of the grid, i.e.
The strength of dynamic floor-field on grid (i, j) is denoted as Di,j. In contrast with the static floor-field, dynamic floor-field varies with time, which may instantly trigger the herding of agents during the evacuation process. Dynamic floor-field is initialized with a ground value of zero for all the grids, and updated subsequently through the evacuation process by following the scheme below [14]: 1) For a given empty grid, its dynamic floor-field strength will increase with a unit value if it is occupied by an agent at the following time-step, i.e.,
2.3 Group Structure
2.3.1 Basic Group Setting
Groups of different sizes are differentiated as the 2-agent groups, 3-agent groups, 4-agent groups and 5-agent groups in this study. Only one leader exists in a group, and the rest agents in the group are called followers. Leaders and followers have different types of efficiency functions. For leaders, the efficiency function has the same form as that of the non-grouped individuals. Followers are defined to have more limited rationality and they are less influenced by the static floor-field so that they mainly follow the leaders motion under the basic configuration. Lastly, leaders and followers are mutually constrained by the binding mechanism which will be described in detail in Section 2.5.
2.3.2 Diverse Mobility
We couple the agents diverse mobility to the group structure in order to see its role played in the evacuation dynamics. We approximate the population of agents with different speeds as N3: N2: N1 = 2 : 3: 5, with
2.4 Decision Making
2.4.1 Efficiency Function
At each time-step, agents shall decide which grid to move into with the use of efficiency functions. Inspired by the no back step assumption made by Weng et al in their study of pedestrian flow [22], candidates of the goal grids for an agent to locate are always in or at the front of its current grid, along the direction of evacuation. For an agent staying in grid (i, j) (the grid in blue in Figure 3), the three grids in the Von Neumann neighborhood {i′, j′} = {(i + 1, j) (i, j + 1), (i, j − 1)} (the grids in orange in Figure 3) are the possible goals. Therefore, the agent shall calculate the efficiency function Fi′j′ for all the neighboring grids.
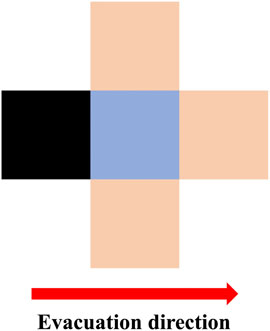
FIGURE 3. Candidates of target orange grids for an evacuation agent staying in the central blue grid. Under no-back-step assumption, entrance into the black grid is forbidden for the agent.
For the leaders and the individual agents, the efficiency function is formulated as the following [14],
For the followers, the efficiency function reads as follows,
In Eqs 1, 2 above, constant C stands for the normalization factor, and a set of positive parameters
The remaining two binary variables in Eqs 1, 2 are defined respectively as a flag for the occupation of a grid
In boundary grids, efficiency functions are set as zero except for those on the exits. In the exit grids, efficiency functions are set to be infinite. With such a disposal of boundary conditions, agents are not able to move out of the evacuation area unless they get evacuated from one of the exits.
2.4.2 Decision of Movement
By completing the calculation of efficiency functions, the evacuating agent can make his or her decisions by choosing a goal grid with the largest efficiency function for the next movement.
In Eq. 3, t′ is the index of the current pseudo time step, and E0 as the error-free position decision function based on the evaluation of efficiency function. With the consideration of agents irrationality, a panic-induced error in the decision making process can be modeled through the following two steps. At each time-step, after an agent has decided which grid to move into, a random number uniformly distributed in [0, 1] is generated. Decision of the agent will be adjusted with the following formula
in which E1 is defined as the error-included decision function, θerr is the criteria of making mistake, and (i′,j′)Rand is a goal grid randomly chosen from all the unoccupied grids in (i − 1, j), (i + 1, j), (i, j + 1), (i, j − 1). The scheme for decision making above can be easily generalized to multi-speed-agents, namely
In Eq. 6,
The possible conflicts of deciding the movement in each sub-step are resolved as follows:
1) The top priority is that leaders will choose prior to followers;
2) The second priority is that agents closer to the wall where the gates are located (equivalently with larger x coordinates) will choose prior to others;
3) If there are leaders or followers with the same x coordinates, the sequence of them making choices will be randomly decided.
2.4.3 Binding Mechanism
As is described in Section 1, we define the empirically observed tendency, that agents of the same group are more likely to cluster together, as the binding mechanism in this model. There are two core effects for the binding, which state that followers always try to follow the leaders of the same groups and leaders will wait for the followers if they are too far behind. The following mechanism is implemented via efficiency function Fi′j′ for the followers, in reference to Eq. 2. Following is enabled by kd term related to the relative distance with the leader and the kp term related to the direction of the leaders motion in the efficiency function. Followers are more likely to move into grids that are closer to the leaders or to move in directions aligned with those of the leaders. The waiting mechanism is implemented for the leaders in the decision of moving directions. In particular, the direction for the next movement of agents are defined by an error-included decision function,
For leaders,
with
For followers,
In Eqs 8, 9, d0 is the critical waiting distance, {dk} records distances from the group leader to each follower for a given group. The characteristic of decision function E is whenever the longest distance from the leader to a follower surpasses d0, the leader should stay put. Note that in the previous study of Lili Lu et al, only a part of the binding effects, namely the following process, is implemented. Hence we may not find the clustering of the group members in the first place under the multi-speed-agents extension. Nevertheless, in our point of view, the interaction between the leader and follower is of fundamental importance, and we expect the clustered structure would have non-trivial influence on the whole PED dynamics.
2.5 Model Validation
2.5.1 Simulation Procedure and Initial Conditions
The model used in the current study has been extended in the following aspects: 1) the realization of the full binding effects between group leaders and followers; 2) the inclusion of multi-speed-agents; as well as 3) the remedy of the locking problem. Therefore, we need to validate the updated model by showing that the overall PED has not been altered, so that we can provide a solid foundation for the specific study on the influence coming from the group structure on the evacuation. The basic procedures in the simulation code are as follows:
1. Initialize the population of evacuating agents, the static and dynamic floor-fields.
2. In each time-step:
1) Calculate efficiency functions attached to each agent by sweeping the grids from right to left.
2) Make decisions on movements for all the agents and update their positions.
3) Repeat (1) and (2) for the whole three pseudo sub-steps.
3. Update the dynamic floor-field and the number of the remaining agents.
4. Repeat 1, 2, 3, till there are no agents left in the evacuation area.
To be more specific about the initialization of population, locations of the agents in the same group are set to stick together [14]. From each agents view, there must be another agent from the same group in the Miller neighborhood. The group leader is randomly chosen. For simulations shown in the following sections, the population is set as N (t = 0) = 480 agents and the configuration of grids as L = 40 and l = 5. Statistics are obtained by repeating each simulation 100 times and taking the average of the counted numbers.
2.5.2 Condition I: Group Structure Without Multi-Speed-Agents
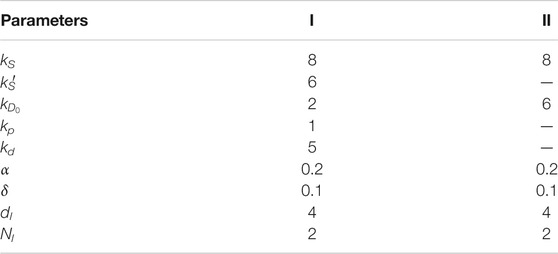
Lili Lu et al. found that there is no evident correlation between group size and evacuation time [14]. This result can be reproduced when we only take the following process in the binding mechanism into account and exclude the diversity in the moving speeds. We conduct simulations for the evacuation of individuals, 2-agent groups and 3-agent groups, counting the number of agents (indicated by N(t)) left in the room as time evolved. Our results agree with Lili Lus finding with parameters shown in row I of Table 1.
In the results shown in Figure 4A, obviously, the total evacuation times for the 2-agent groups and the 3-agent groups are close, both of which are longer than the total evacuation time of individuals. The corresponding results can be found in the study of Lili Lu et al (see Figure 8 in [14]). Although there are differences attributing to the intrinsic different setting of models, such as the way movement is decided and the different settings of sensitivities to the dynamic floor-field, etc., the weak correlation between group size and evacuation time has been reproduced.
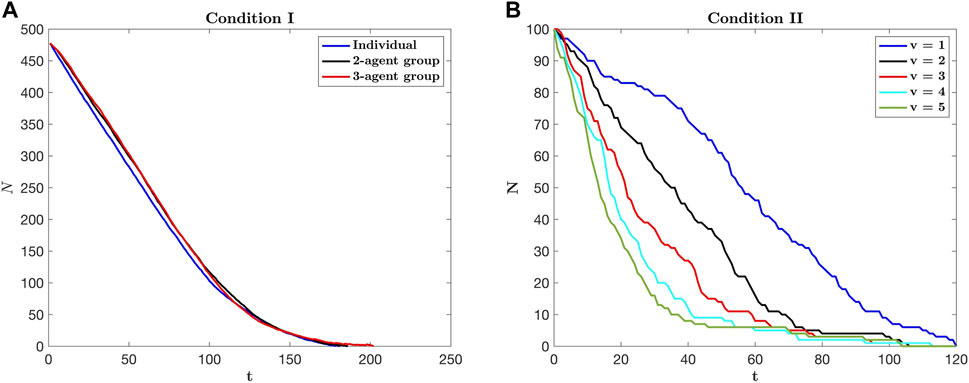
FIGURE 4. Time evolution of the number of agents remained in the room in condition I (A) and II (B).
2.5.3 Condition II: Multi-Speed-Agents Without Group Structure
The second validation concerns with the evacuation of individuals with different walking abilities. It is shown in the work of Zhijian Fu et al that the concavity of the evacuation evolution curves differs for agents of different walking speeds. Specifically, the convex curves for low-speed agents will change into concave curves for the high-speed agents [14]. We conduct similar evacuation simulations including agents who are uniformly assigned with speed v of 1–5 grids per time-step. Parameters are listed in row II of Table 1 and simulation results are shown in Figure 4B. In a statistical sense, our results agree with that of Fus study (see Figure 2B in [14]). The differences between the two models may be caused by the facts that Fu et al use Moore instead of Von Neumann neighborhood in the decision of the next movement, and that they implement the movement of multi-speed-agents with floor-fields instead of the pseudo sub-step algorithm.
3 Simulation Experiments
3.1 Evacuation Pattern and Traffic Analysis
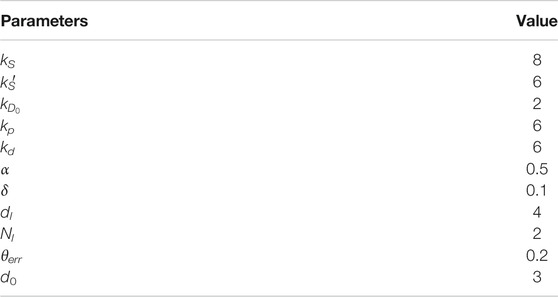
We conduct one-group-type simulations for individuals, 2-agent groups, 3-agent groups, 4-agent groups and 5-agent groups separately with a fixed total number of agents (N (t = 0) = 480). Initially, all agents are randomly distributed in the evacuation area as shown in Figure 1. To study how the group structure affects PED when the full binding effects are included, we start with qualitative and quantitative analyses of the overall evacuation pattern. Since the waiting process is activated and multi-speed-agents are employed, parameters used in the simulation experiments, as shown in Table 2, are different from those shown in Table 1.
Typical snapshots of the distribution of evacuating agents are shown in Figure 5, from which three phases can be identified from the evacuation processes: 1) a movable phase shortly after the beginning when most agents can move in a relatively smooth manner; 2) a jammed phase following the movable phase when the most agents are getting obstructed; 3) and a rarefied phase in the end after the crowding has been released. As one can see, the emergence of three phases is universal among three simulation experiments with different group types, though the details of each are different.
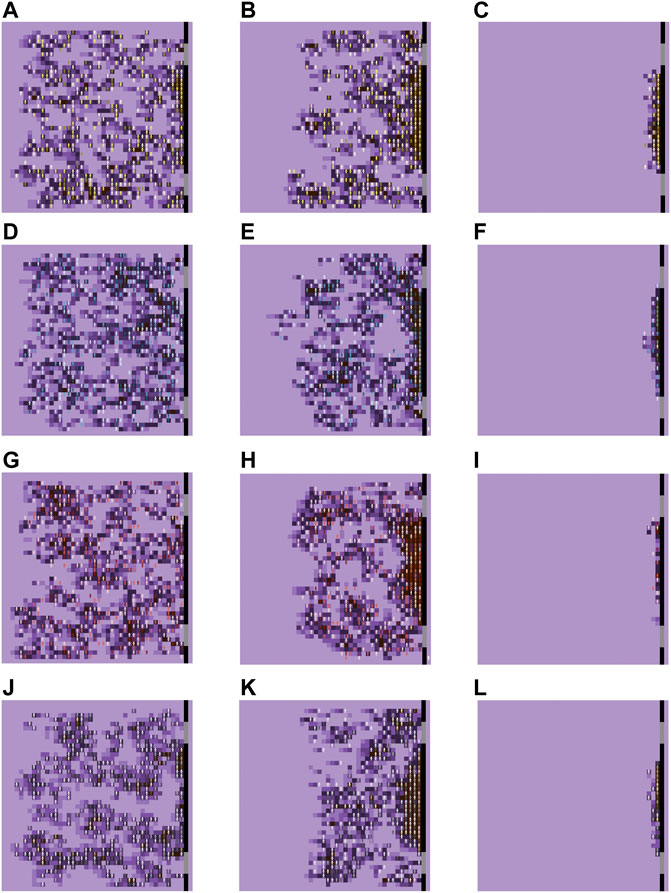
FIGURE 5. Evacuation patterns for 2-agent groups (A–C), 3-agent groups (D–F), 4-agent groups (G–I) and 5-agent groups (J–L). Different patterns for the movable, jammed and rarefied phases are exhibited from left to right. The gradient of purple color in the background indicates the strength of the dynamic floor field. In the jammed phase, the dynamic floor-field dominates.
To quantify the level of jamming, we define a quantity of traffic to be the ratio of the number of moving agents moving to the total number of agents in the evacuation area at a given time step. Time evolutions of traffic are shown in Figure 6, with which one can clearly measure the duration of the three phases. The monotonically decreasing green line in the earlier stage represents the traffic change in the movable phase; as the jammed phase is reached, the almost horizontal red line shows that the traffic has been trapped in a very low level; whereas the monotonically increasing green line represents the entering into the rarefied phase where the jamming is gradually lifted and the evacuation is becoming smooth again. Note that, contrary to our intuition, the duration of jamming decreases monotonically with the increasing group size.
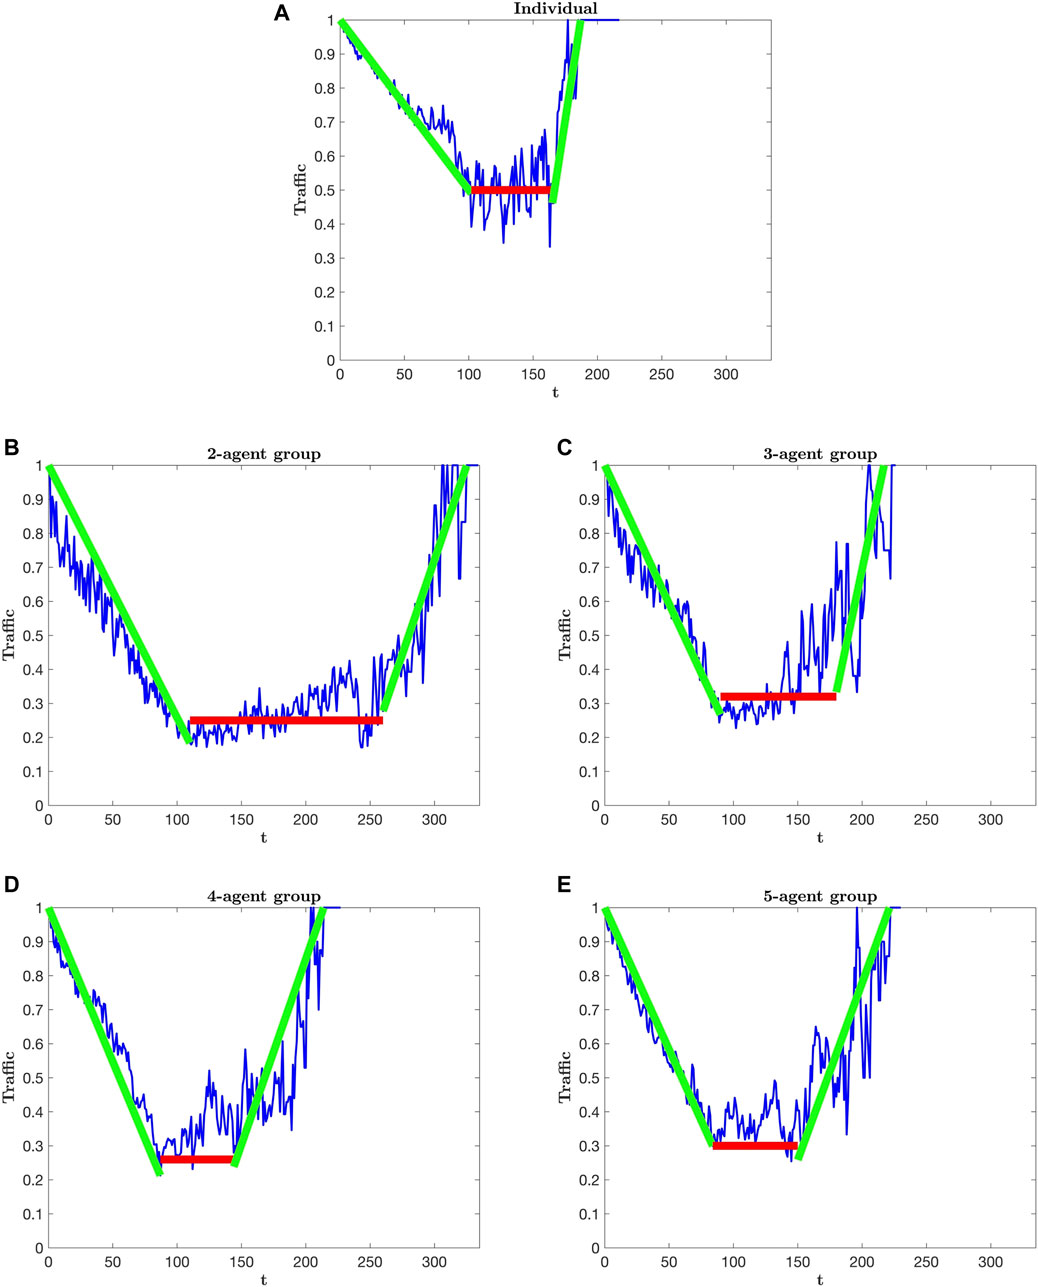
FIGURE 6. Time evolutions of traffic. For each type of group (A–E), durations of the movable (time span of the left green line), jammed (time span of the middle red line) and rarefied phases (time span of the right green line) can be identified through drawing approximately the gradient of traffic changes.
3.1.1 Negative Dependence of Evacuation Time on Group Size
Here we conduct three case studies, namely the complete binding case, the incomplete binding case and the no-binding case, about the total evacuation time (Ttot) and average evacuation time (
As the results shown in Figure 7, while both the total and the average evacuation time become longer in the complete binding case, the correlation of these two quantities on the group size is negative. For the incomplete binding case, such a negative dependence turns into a weakly positive one. If the binding effects are completely removed (as shown in the no binding case), the correlation between the evacuation time and the group size is gone.
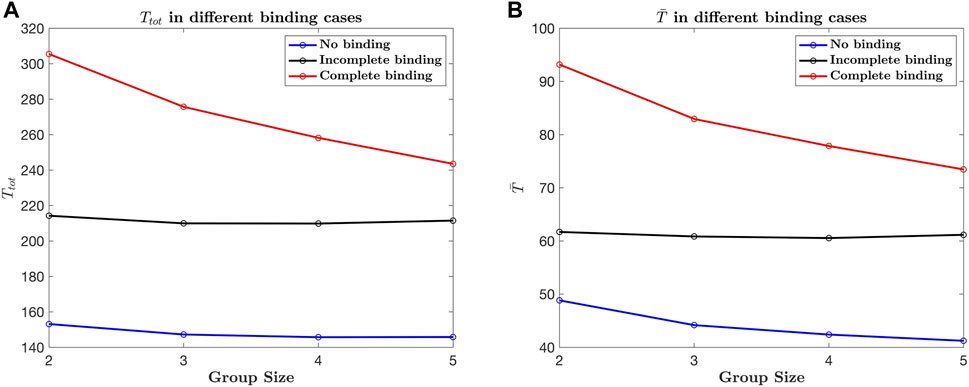
FIGURE 7. Total and average evacuation times versus group sizes. For three different binding cases, results of total evacuation time are shown in (A), and results of average evacuation time in (B).
In reference to the no-binding case, the waiting mechanism in the complete binding makes it necessary for leaders, who have the highest mobility, to stop frequently and wait for other group members, a behavior that certainly leads to an increase in the overall evacuation time. As the binding become incomplete, the evacuation time generally decreases, since there are no waiting mechanism that would delay the leaders. When binding is completely removed, the evacuation time also generally decreases. And the significant negative dependence doesn’t show in the latter cases.
A similar negative dependence was observed in an experiment conducted by Cornelia von Krüchten and Andreas Schadschneider [23].In their experiments, the setup of “fixed bonded group members” which constrained the agents in the same group to always keep in physical contact with each other can be considered as an analogous implementation of the complete binding. Other than binding, leaders would make decisions regardless of followers, while followers would likely to stay close to their leaders, which corresponds to the efficiency function by which the incomplete binding is achieved. And the variance of moving abilities was considered in the different age classes.
Thus, it is worth further investigating the negative dependence of evacuation time on group size found in the case of complete binding. To this end, we adjust the strength of complete binding in the following ways: 1) Set the probability for making irrational decisions to be Pe, such that agents would randomly choose to move in a non-occupied adjacent cell, including the back-step cell. By increasing Pe, more followers would be likely to step back, so more likely to trigger the binding mechanism. 2) Increasing the critical distance d0 for the waiting mechanism decreases the binding strength. Note that even we change the values of Pe and d0, the mechanisms of waiting and following still work together so that the binding is still complete, though the strength of binding is modulated. The results of adjusting the binding strength by changing Pe are shown in Figures 8A,B, and the results of adjusting the binding strength by changing d0 are shown in Figures 8C,D. The negative dependence of evacuation time on group size diminishes as the binding strength is reduced. The overall decrease in evacuation time as either Pe decreases or d0 increases can be attributed to agents being less likely to move backward or wait.
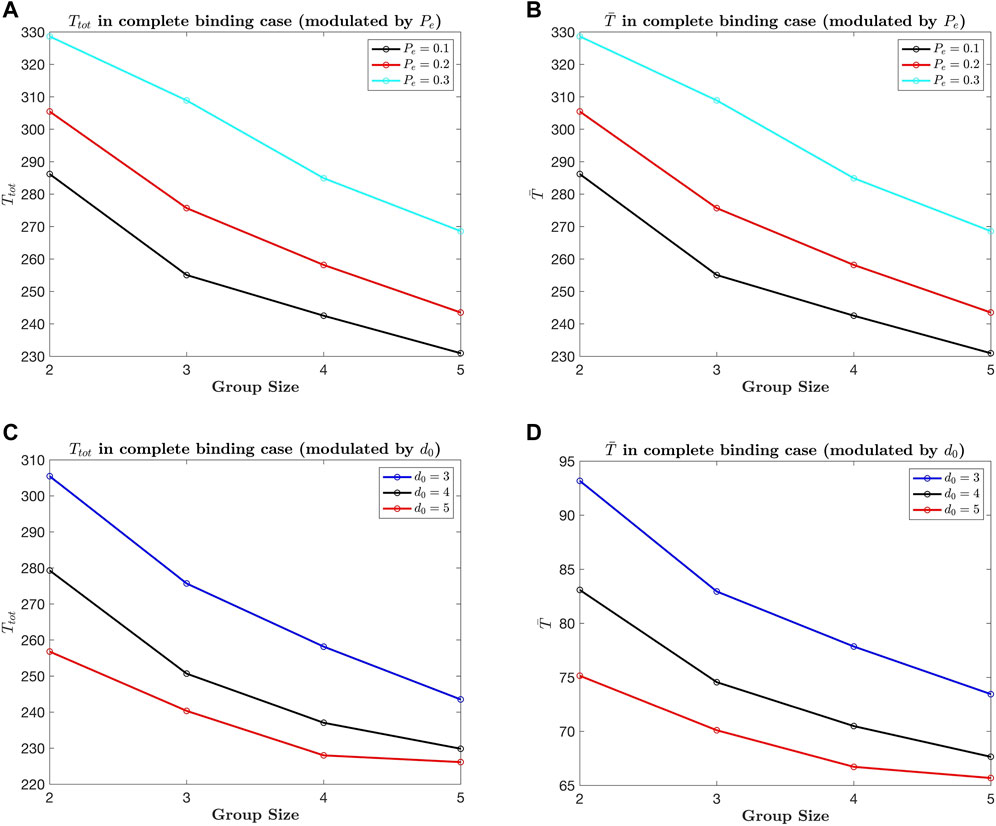
FIGURE 8. Total and average evacuation time versus group size under different strengths (modulated by Pe in (A,B) and by d0 in (C,D) of complete binding.
4 Mixing Index
By far we have made a qualitative argument that the negative dependence of evacuation time on group size emerges only when the complete binding effects are included. And we have observed that the more the strength of complete binding is reduced the weaker the negative dependence is. However, we need to have a quantitative understanding about how the complete binding contributes to such a negative dependence.
4.1 Definition of the Mixing Index
As shown in Section 3.1, we find that the duration of the jammed phase differs for different group sizes. Thus we may propose an ansatz that the mixing of members from different groups could be the main reason for such differences. In the model design, there is a critical distance d0 over which the leader must stop and wait until the rest of the group members get closer under the influence of the following mechanism. However, if the system resides in a state where different group members are highly mixed, grids next to a group member would be occupied by members from other groups with a high probability, making it difficult for this agent to get close to his/her leader. On a larger scale, the mixing of different group members can make the distances between leaders and their farthest group members more likely to exceed d0, hence triggering the waiting more frequently. The reasoning on the elongation of duration for the jammed phase in a highly mixed state under the complete binding mechanism inspires us to construct an entropy-like quantity to describe the degree of mixing. Before defining, we need to make a representation transformation from agents to grids. When constructing the model, it is a natural choice for us to focus on the agents. However, it would be more convenient to take an Eulerian view when constructing a spatially local state variable. We define a unit cell, which, as shown Figure 9, consists of 9 Moore neighboring grids. In the center grid i of this unit cell, by analogy with the definition of entropy in statistical mechanics, we define a local quantity Mi, called the local mixing index hereafter.
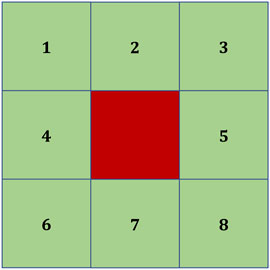
FIGURE 9. A unit cell for the calculation of mixing index. The center grid is colored in red and the periphery grids are colored in green. For the evacuation area configured in Section 2.1, there are 1,600 such unit cells in total.
For a unit cell with centring grid i and neighboring grids j = 1, … , 8, the mixing index is defined as,
where binary variables ni and nj indicate the existence or absence of agents in the grids, and i is a coefficient for the alignment of group indices for the existing agents,
where gi and gj are the group indices for agents staying in the center and in the neighbors. The prime on the factorial operator
The mixing index for the whole evacuation system can be obtained by summing the local mixing indices,
As the system mixing index M will increase monotonically as the local mixing level of different groups increases, together with the distribution of local mixing indices, it can pave the road for the upcoming quantitative analysis of the negative dependence of evacuation time on the group size.
4.2 Analysis With the Mixing Index
Firstly, time evolution of the system mixing index is shown in Figure 10A for a 2-agent group evacuation simulation with complete binding (parameters are set to be the same as those shown in Section 3.2). We may observe that the system stays in a highly mixed state in the initial stage. As the degree of mixing decreases almost monotonically along with the evolving evacuation process, the total evacuation time should have a dependence on the maximum value of the mixing index. Hereafter, we use Mmax to be the maximal system mixing index during one run of the evacuation simulation.
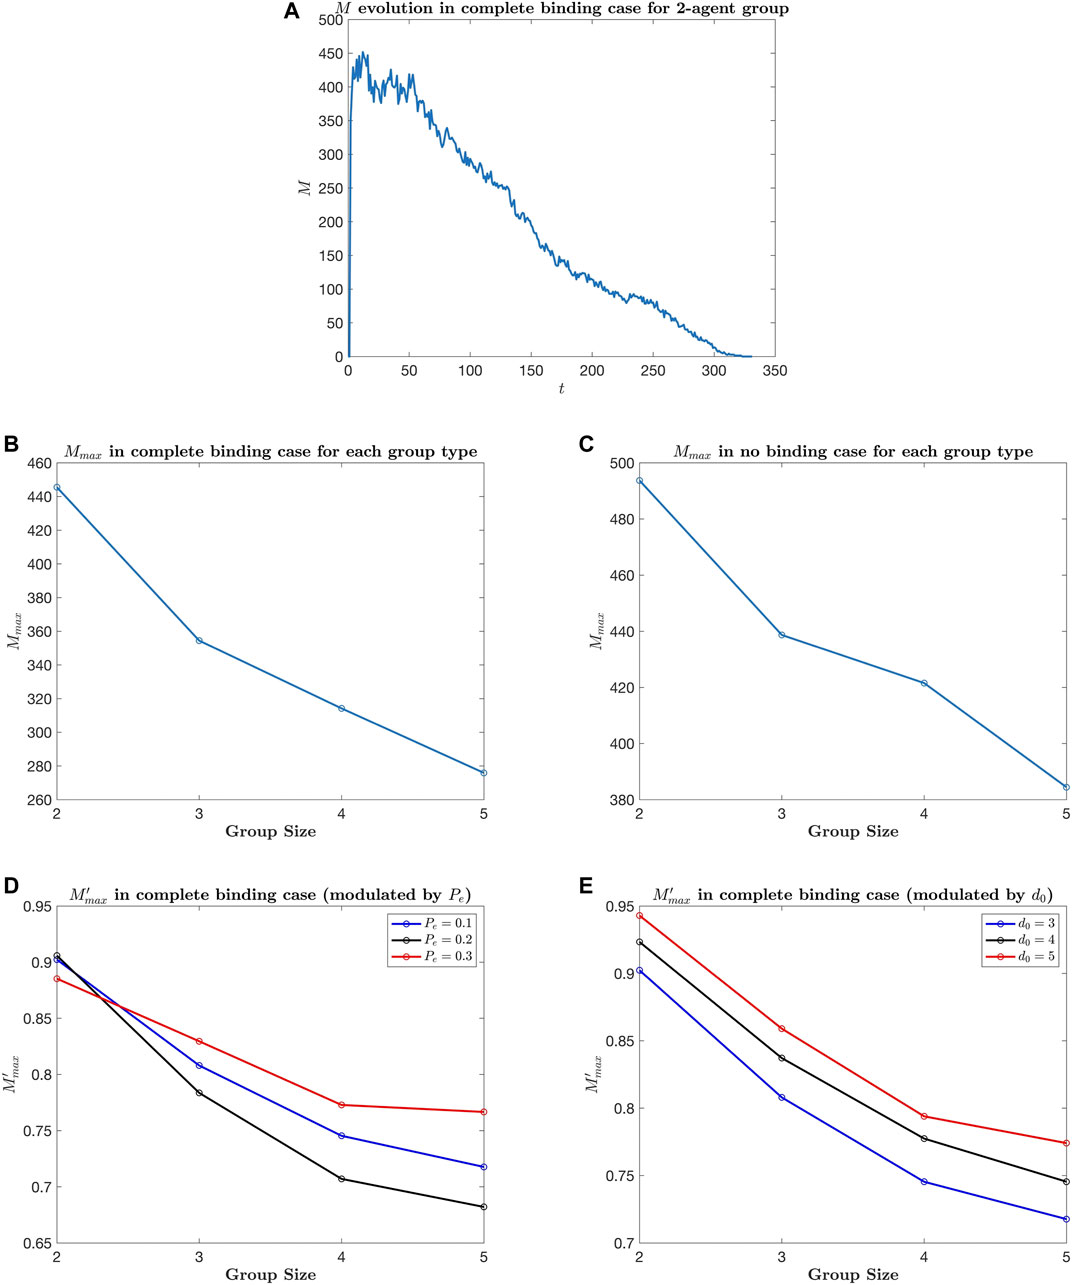
FIGURE 10. Time evolution of M for the simulation of 2-agent group evacuation in the complete binding case is shown in (A). The maximum of the system mixing index Mmax versus group size in both complete binding and no binding cases are shown in (B,C). The relation between the normalized mixing index
The dependence of Mmax on the group size under the complete binding is shown In Figure 10B. What we can see is that the mixing of different group members is weakened to a greater extent as the group size increases. The essential reason for this observation lies in the fact that the larger the size of each group, the less number of groups there will be, if the total number of agents is fixed. To get a more intuitional picture, we can analyze the spatial distribution of local mixing index at the moment when M = Mmax. As shown Figure 11, there are more grids of larger local mixing index with smaller group sizes. Indeed, it is less likely for agents from other groups to invade the area congregated by a larger group, under the setting of complete binding which drives agents of the same group to cluster together.
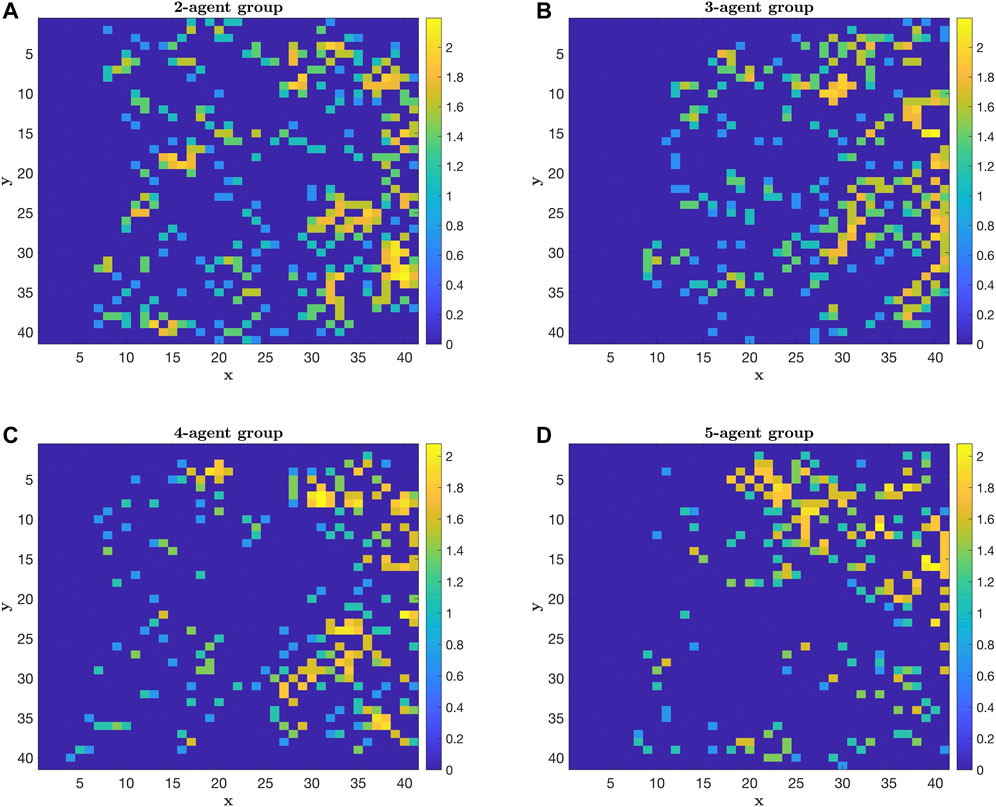
FIGURE 11. Spatial distribution of the local mixing index for 2-agent group (A), 3-agent group (B), 4-agent group (C), and 5-agent group (D) at the moment when the system mixing index reaches its maximum.
Knowing that M decreases as the group size increases, the answer to the negative dependence of evacuation time on group size lies in the relationship between the evacuation time and the system mixing index. When groups are highly mixed, it would be harder for followers to follow the leader since agents from other groups are more likely to be standing in their way. Then leaders will wait longer since group members are more likely to be left far behind. Consequently, intermittent jams would more likely to happen. The occurrence of intermittent jams can be confirmed with the velocity evolution of a specific agent in each type of groups. And we choose the leaders with the highest speed for that, as shown in the Appendix. The overall intermittent jams condition can be efficiently described by mixing index under the complete binding mechanism, since agents are likely to stop as they are surrounded by those from different groups. Thus, the dependence of intermittent jams on group types should be effectively demonstrated with the mixing index. Yet mixing without the inclusion of complete binding cannot elongate the evacuation time. Evidence for this argument can be presented if we remove the binding completely. In this situation, the correlation between evacuation time and group size would be gone even though the inherent negative relation between M and group size still exists, see Figures 7, 10C. Consequently, we may conclude that the evacuation time is positively correlated with the mixing index only if the influence of complete binding exists. Additionally, the negative dependence of the mixing index on group size strengthens as the strength of complete binding is increased. This argument may be demonstrated by investing the relation between the normalized system mixing index (M′ = M/Mnobinding) with the group size, see Figures 10D,E. Note that we can change the strength of complete binding either by tuning the critical distance d0 or by changing the probability of malfunction of the waiting mechanism.
4.3 Evacuation Rate and the Mixing Index
Having exploited the mixing index in the previous section, we try to find what more we can reveal the dynamics of evacuation with or without group structures from the mixing index. We define the rate of evacuation R as the decrease in the number of agents in the evacuation area at a given time step. Intuitively we attempt to apply a constant scaling transformation to M and to check if there would be a similarity between the time evolution pattern of the scaled M and that of R. The constant scaling factors are found through trial-and-error to be in the range of 0.01–0.018 for the evacuation of individuals and all kinds of groups. As shown in Figure 12, we find that the evolution patterns of scaled M and R are similar regardless some large fluctuations in R. It suggests that the mixing index should contain useful information about the evacuation rate, which supports our optimistic envision about M, that it may serve as a powerful indicator for the dynamics of the evacuation system.
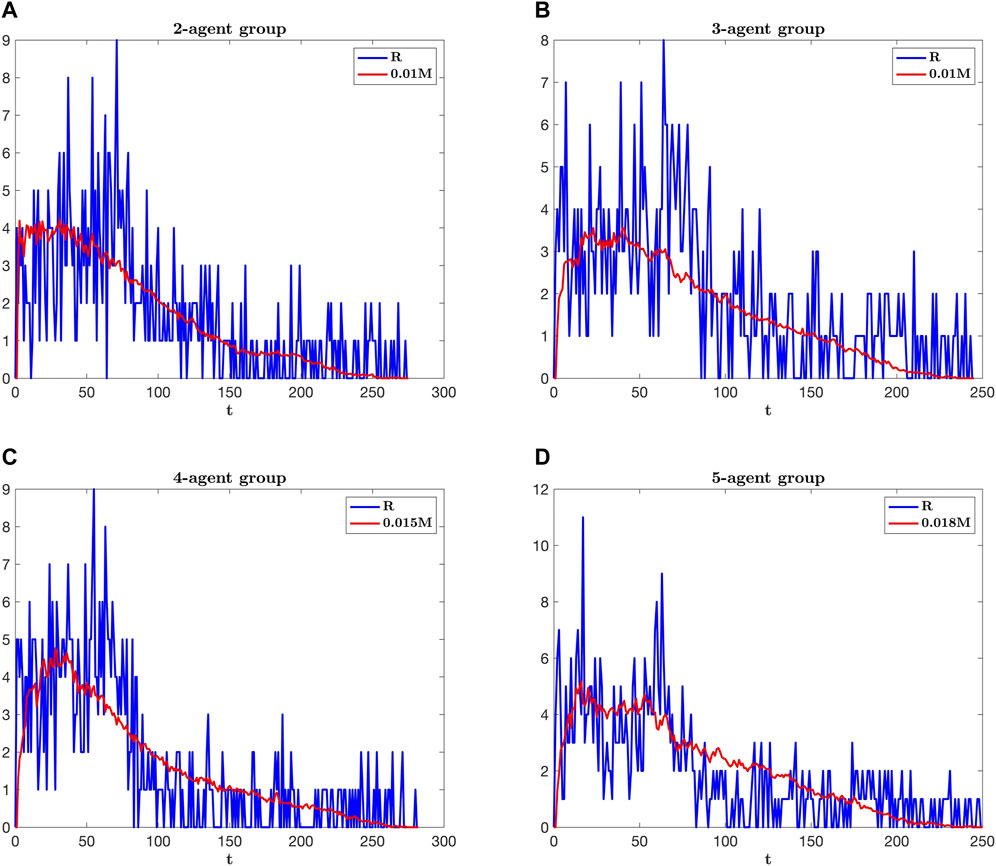
FIGURE 12. Comparison of R-t (blue) pattern with cM-t (red) pattern (c being the constant scaling factor) for the evacuation of 2-agent group (A), 3-agent group (B), 4-agent group (C), and 5-agent group (D).
5 Conclusion
In this paper, an extended floor-field cellular automaton with group structure, multi-speed-agents and local density-dependent dynamic field is constructed for the study of binding effects on evacuation systems. In particular, group structure is implemented by distinguishing between leaders and followers and by setting up a mutually binding mechanism. Our model is validated by calibration to the acknowledged results [14, 18]. Simulations show that when complete binding is taken into account, a negative dependence of evacuation time on the group size emerges. Whereas if the binding is incomplete or removed, there is no such dependence. To quantitatively analyze the cause for such a negative correlation, we proposed an entropy-like quantity, the local and system mixing index. The decrease of mixing index as the group size increases can be explained with a relatively more clear picture for the evacuation dynamics. In the meantime, we find that a higher level of mixing can give rise to a longer evacuation time if the complete binding works. Based on these two arguments, we are able to clarify the reason behind the negative dependence of evacuation time on the group size. The experimental verification from [23] indeed shed light on the study of this negative dependence. However, experiments closely employing the specific mechanisms of grouping and complete binding are still in need to further verify our argument and its potential application in practical evacuations. Moreover, with a constant scaling transformation we find the similarity between the evolution pattern of evacuation rate and that of the mixing index, which suggests this entropy-like quantity can be an informative indicator for the evacuation system. Thus, we think a thorough study about the mixing index M as an indicator of the evacuation system is of great significance considering that it is a concept rooted in statistical physics and can be used to explain complex phenomena occurring in social systems.
Data Availability Statement
The original contributions presented in the study are included in the article/Supplementary Material, further inquiries can be directed to the corresponding authors.
Author Contributions
TW and YC contributed to the conception of the study; TW performed the coding and data analyses; TW and YC jointly wrote the article; YC helped perform the general analysis with constructive discussions.
Conflict of Interest
The authors declare that the research was conducted in the absence of any commercial or financial relationships that could be construed as a potential conflict of interest.
Publisher’s Note
All claims expressed in this article are solely those of the authors and do not necessarily represent those of their affiliated organizations, or those of the publisher, the editors, and the reviewers. Any product that may be evaluated in this article, or claim that may be made by its manufacturer, is not guaranteed or endorsed by the publisher.
Acknowledgments
We wish to acknowledge the support of the Graduate School of Frontier Science at the University of Tokyo for holding the UTSIP Program, and the support of the Department of Physics at Fudan University. And we would like to thank the reviewers of Frontier in Physics for the helpful suggestions on the sequence of sub-steps and intermittent jams.
Supplementary Material
The Supplementary Material for this article can be found online at: https://www.frontiersin.org/articles/10.3389/fphy.2021.798423/full#supplementary-material
Appendix A:
As shown in the figure below, intermittent jams generally occur in the evacuation. And the duration and the occurrence frequency of intermittent jams during evacuations experienced by those 5 agents we specifically chose are quite different. For example, for the leader in the 2-agent group, the duration of jams are much longer than others, and take place more frequently. However, it is worth noticing that there are rather large number of groups in the evacuation even though they are all of the same kind. With the results below we want to emphasize the existence and the variance of intermittent jams. And we consider that for the overall intermittent jams occurring in the evacuation, the analysis based on mixing index would be more representative.
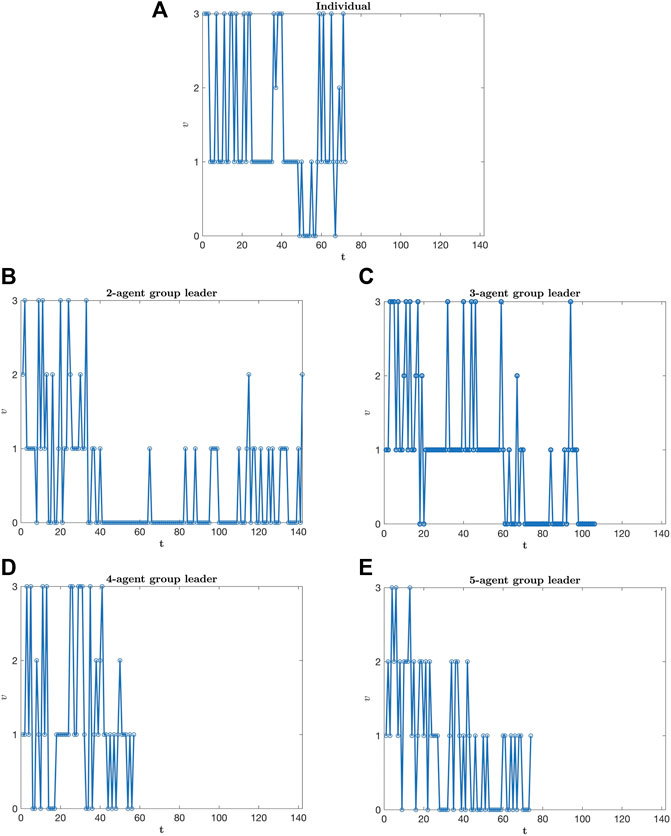
FIGURE A1. Intermittent jams during evacuation for a specific agent [individual with v = 3 (A), 2-agent group leader with v = 3 (B), 3-agent group leader with v = 3 (C), 4-agent group leader with v = 3 (D), 5-agent group leader with v = 3 (E)].
References
1. Kirchner A, Schadschneider A. Simulation of Evacuation Processes Using a Bionics-Inspired Cellular Automaton Model for Pedestrian Dynamics. Physica A: Stat Mech its Appl (2002) 312(1):260–76. doi:10.1016/s0378-4371(02)00857-9
2. Luo L, Fu Z, Cheng H, Yang L. Update Schemes of Multi-Velocity Floor Field Cellular Automaton for Pedestrian Dynamics. Physica A: Stat Mech its Appl (2018) 491:946–63. ADS Bibcode: 2018PhyA. 491. 946L. doi:10.1016/j.physa.2017.09.049
3. Li Y, Chen M, Dou Z, Zheng X, Cheng Y, Mebarki A. A Review of Cellular Automata Models for Crowd Evacuation. Physica A: Stat Mech its Appl (2019) 526:120752. Publisher: Elsevier. doi:10.1016/j.physa.2019.03.117
4. Helbing D, Molnár P. Social Force Model for Pedestrian Dynamics. Phys Rev E (1995) 51(5):4282–6. doi:10.1103/physreve.51.4282
5. Mehran R, Oyama A, Shah M. Abnormal Crowd Behavior Detection Using Social Force Model. In: Proceedings of the 2009 IEEE Conference on Computer Vision and Pattern Recognition; June 2009; Miami, FL, USA. p. 935–42. ISSN: 1063-6919.
6. Anvari B, Bell MGH, Sivakumar A, Ochieng WY. Modelling Shared Space Users via Rule-Based Social Force Model. Transportation Res C: Emerging Tech (2015) 51:83–103. doi:10.1016/j.trc.2014.10.012
7. Hou L, Liu J-G, Pan X, Wang B-H. A Social Force Evacuation Model with the Leadership Effect. Physica A: Stat Mech its Appl (2014) 400:93–99. doi:10.1016/j.physa.2013.12.049
8. Yu WJ, Chen R, Dong LY, Dai SQ. Centrifugal Force Model for Pedestrian Dynamics. Phys Rev E Stat Nonlin Soft Matter Phys (2005) 72(2):026112. doi:10.1103/PhysRevE.72.026112
9. Chraibi M, Seyfried A, Schadschneider A. Generalized Centrifugal-Force Model for Pedestrian Dynamics. Phys Rev E Stat Nonlin Soft Matter Phys (2010) 82:046111. doi:10.1103/PhysRevE.82.046111
10. Chraibi M, Kemloh U, Kemloh U, Schadschneider A, Seyfried A. Force-based Models of Pedestrian Dynamics. Networks & Heterogeneous Media (2011) 6(3):425–42. Company: Networks & Heterogeneous Media Distributor: Networks & Heterogeneous Media Institution: Networks & Heterogeneous Media Label: Networks & Heterogeneous Media Publisher: American Institute of Mathematical Sciences. doi:10.3934/nhm.2011.6.425
11. Chraibi M, Freialdenhoven M, Schadschneider A, Seyfried A. Modeling the Desired Direction in a Force-Based Model for Pedestrian Dynamics. Traffic and Granular Flow 2011 (2012) 263–275. doi:10.1007/978-3-642-39669-4__25
12. van der Berg J, Lin M, Manocha D. Reciprocal Velocity Obstacles for Real-Time Multi-Agent Navigation. In: Proceedings of the 2008 IEEE International Conference on Robotics and Automation; May 2008; Pasadena, CA. p. 1928–35. ISSN: 1050-4729.
13. Fu Z, Zhou X, Zhu K, Chen Y, Zhuang Y, Hu Y, et al. A Floor Field Cellular Automaton for Crowd Evacuation Considering Different Walking Abilities. Physica A: Stat Mech its Appl (2015) 420:294–303. doi:10.1016/j.physa.2014.11.006
14. Lu L, Chan C-Y, Wang J, Wang W. A Study of Pedestrian Group Behaviors in Crowd Evacuation Based on an Extended Floor Field Cellular Automaton Model. Transportation Res Part C: Emerging Tech (2017) 81:317–29. doi:10.1016/j.trc.2016.08.018
15. Pereira LA, Burgarelli D, Duczmal LH, Cruz FRB. Emergency Evacuation Models Based on Cellular Automata with Route Changes and Group fields. Physica A: Stat Mech its Appl (2017) 473:97–110. doi:10.1016/j.physa.2017.01.048
16. Lu L-L, Ren G, Wang W, Wang Y. Modeling Walking Behavior of Pedestrian Groups with Floor Field Cellular Automaton Approach. Chin Phys. B (2014) 23(8):088901. doi:10.1088/1674-1056/23/8/088901
17. Wei-Guo S, Yan-Fei Y, Bing-Hong W, Wei-Cheng F. Evacuation Behaviors at Exit in CA Model with Force Essentials: A Comparison with Social Force Model. Physica A: Stat Mech its Appl (2006) 371(2):658–66. Publisher: Elsevier. doi:10.1016/j.physa.2006.03.027
18. James J. The Distribution of Free-Forming Small Group Size. Am Sociological Rev (1953) 18:569–70. Place: US Publisher: American Sociological Assn. doi:10.2307/2087444
19. Fang J, El-Tawil S, Aguirre B. Leader-follower Model for Agent Based Simulation of Social Collective Behavior during Egress. Saf Sci (2016) 83:40–7. doi:10.1016/j.ssci.2015.11.015
20. Müller F, Wohak O, Schadschneider A. Study of Influence of Groups on Evacuation Dynamics Using a Cellular Automaton Model. Transportation Res Proced (2014) 2:168–176. doi:10.1016/j.trpro.2014.09.022
21. Nazarov YV, Danon J. Advanced Quantum Mechanics: A Practical Guide. Cambridge, United Kingdom: Cambridge University Press (2013). OCLC: 825767614.
22. Weng WG, Chen T, Yuan HY, Fan WC. Cellular Automaton Simulation of Pedestrian Counter Flow with Different Walk Velocities. Phys Rev E Stat Nonlin Soft Matter Phys (2006) 74(3):036102. Publisher: American Physical Society. doi:10.1103/PhysRevE.74.036102
Keywords: floor-field, cellular automation, evacuation, group, mixing index
Citation: Wang T and Chen Y (2022) The Negative Dependence of Evacuation Time on Group Size Under a Binding Mechanism. Front. Phys. 9:798423. doi: 10.3389/fphy.2021.798423
Received: 20 October 2021; Accepted: 08 December 2021;
Published: 18 January 2022.
Edited by:
Mahdi Jalili, RMIT University, AustraliaReviewed by:
M. N. Kuperman, Bariloche Atomic Centre (CNEA), ArgentinaCharles Reichhardt, Los Alamos National Laboratory (DOE), United States
Copyright © 2022 Wang and Chen. This is an open-access article distributed under the terms of the Creative Commons Attribution License (CC BY). The use, distribution or reproduction in other forums is permitted, provided the original author(s) and the copyright owner(s) are credited and that the original publication in this journal is cited, in accordance with accepted academic practice. No use, distribution or reproduction is permitted which does not comply with these terms.
*Correspondence: Tianyi Wang, d2FuZ3R5NjM3MUBnbWFpbC5jb20=; Yu Chen, Y2hlbkBlZHUuay51LXRva3lvLmFjLmpw
 Tianyi Wang
 Yu Chen