 Junyu Chai1,2,3†
 Wenguang Liu1,2,3†
 Jiangbin Zhang1,2,3*
 Kun Xie4Yao Lu1,2,3Changjin Li1,2,3Pengfei Liu1,2,3Qiong Zhou1,2,3Zongfu Jiang1,2,3Guomin Zhao1,2,3
- 1College of Advanced Interdisciplinary Studies, National University of Defense Technology, Changsha, China
- 2State Key Laboratory of Pulsed Power Laser Technology, Changsha, China
- 3Hunan Provincial Key Laboratory of High Energy Laser Technology, Changsha, China
- 4Xi’an Satellite Control Center, Xi’an, China
Understanding the mode components is of great importance to manipulate the optical modes and to improve the optical system performance. However, various forms of aberrations, stemming from misalignment and imperfect optical components and system design, degrade the performance of the modal decomposition (MD) system. Here we analyze the influence of various Zernike aberrations on MD performance in large-mode-area fiber laser systems. Using computer-generated optical correlation filter together with angular multiplexing technique, we can simultaneously measure multi-modal contents. Among the common aberrations, we find that the MD results are least sensitive to vertical astigmatism aberration. However, the vertical coma aberration and horizontal coma aberration have a large impact on MD results under the same aberration strength, which show a rather large change in modal weight and intermodal phase. Our analysis is useful to construct a precise MD system applicable for high-power optical fiber modal analysis and mode control.
Introduction
High-power fiber lasers have shown wide applications in industrial processing, fundamental science, and national defense [1]. In recent years, the output power of fiber lasers has rapidly increased compared to other solid-state lasers, reaching above 10 kW from a single-mode fiber [2, 3]. To increase the output power of the fiber laser, enlarging the diameter of the fiber core is usually adopted, which suppresses the nonlinear effect and increases the damage threshold of the fiber end face [4, 5]. Step-index large-mode-area (LMA) fibers, also called few-mode fibers, with a low numerical aperture (NA) are then selected to keep a relatively good beam quality at high powers. The core diameters of common LMA fibers usually range from 15 to 50 μm. However, the enlarged fiber core, compared with single-mode fibers, supports more eigenmodes, allowing such to be transmitted in the fiber. With more high-order modes transmitted in the fiber, the beam quality of the laser output degrades. Under high-power and intense pumping conditions, the thermal optical modulation intensifies the inter-mode coupling between the transverse modes, which causes the transverse mode instability (TMI) [6]. This phenomenon leads to degradation of the beam quality and more heat generation, making the power scaling difficult to continue.
After TMI is commonly observed in the experiment, researchers have delivered huge efforts to mitigate this effect, for example, by modifying the fiber parameter [7–9], using different-linewidth seed lasers [10, 11], and optimizing the pump direction or its wavelength [12–14]. These methods mainly focus on passive optical devices, but they cannot change the inherent mechanism which causes TMI. Taking the idea from the field of adaptive optics, active beam control may stabilize the output beam and help to mitigate TMI [15]. In order to combat the mode instability, the key is to control the optical mode of the laser output. Therefore, understanding the fiber mode is of great importance. To this end, mode decomposition is a necessary technique. The existing modal decomposition (MD) techniques mainly include spatially spectrally resolved imaging technique [16], ring-resonators method [17, 18], wavefront analysis method [19, 20], numerical analysis method [21, 22], and optical correlation filter (OCF) method [23, 24]. As the frequency of mode coupling can be as high as several kilohertz, the OCF method is most suitable for such high-speed modal analysis [25]. Using the modal content coefficient as the evaluation function, the active mode control is possible in a closed-loop, high-power fiber laser system.
Researchers have also found that the MD results may be affected by aberrations in the actual mode decomposition [26], but there is a lack of quantitative research. Therefore, we use numerical simulation methods to carry out a detailed analysis of aberration on MD results. In this work, we first develop a fiber laser MD model based on OCF method. Then, possible aberrations under different strengths are induced on the optical field of the fiber laser. Finally, their influences on the MD results (including modal weights and intermodal phases) are analyzed.
Theory of MD and Aberrations
Spatial Mode Properties in Fibers
When the refractive index difference between the core and the cladding of the step-index fiber (SIF) is small, it can be treated as weakly guiding fibers. In the case of weakly guiding approximation, it is considered that the rays in the fiber are completely transmitted along the fiber axis. Therefore, electromagnetic fields are solved via the transverse component, while the longitudinal component can be ignored. The transverse component of the optical field can be decomposed into linear polarization component in the horizontal and vertical directions, which are described by a linear polarization (LP) mode. The optical field of each polarization component is expressed in terms of modes, which constitute orthogonal basis functions as follows:
with
where
In SIF, the number of modes N is usually determined by the normalized cutoff frequency value V. In general, the number of modes that the optical fiber can support for transmission increases as the value of the normalized cutoff frequency increases, such that:
where
Fiber Laser MD Using the OCF Method
Fiber laser MD using the OCF method based on computer-generated hologram (CGH) is a powerful tool for the detailed investigation of laser fields [27, 28]. The OCF that we mention here is transmission functions by design. The transmission functions consist of amplitudes and conjugate phase information related to the eigenmodes of LMA fiber laser, which can be converted into a phase-only CGH. This phase-only CGH is loaded into a liquid crystal spatial light modulator (LC-SLM). When the incident beam illuminates the LC-SLM, the beam is diffracted according to the pattern on the LC-SLM. In this way, we realize the superimposition of the designed transmission functions and the incident beam. Only those light containing the same mode information as the filter can be diffracted and converge at the far-field optical axis (r = 0). Hence, the far-field intensity signal (grayscale value in the simulation)
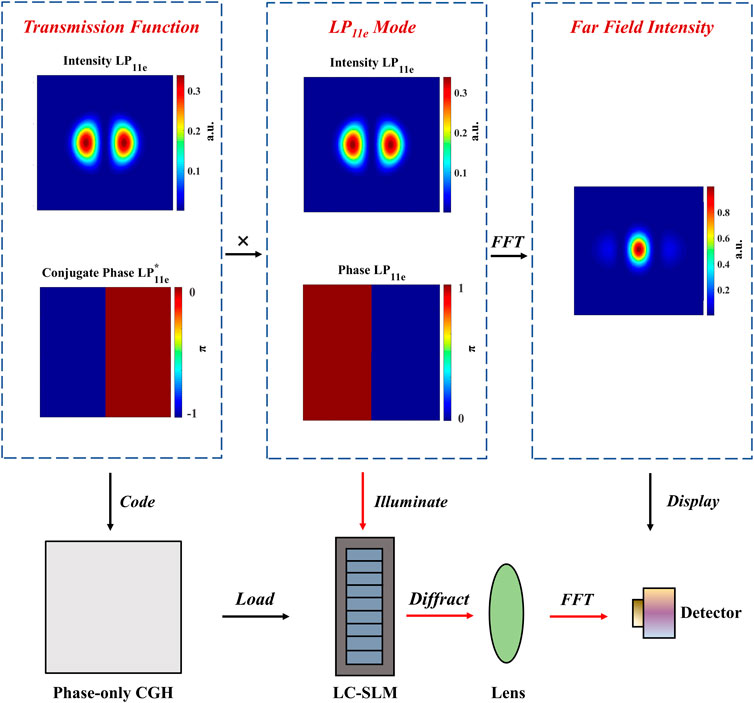
FIGURE 1. A matched filter process for LP11e mode via OCF method. For an ideal LP11e mode, the peak intensity passes through the x-axis, and the image is perfectly symmetrical along the x = 0 coordinate axis. The phase of the LP11e mode is a 0-π step. When a LP11e mode passes through a computer-generated hologram containing its conjugate phase (0--π step), the light intensity in the far-field Fourier plane will present the maximum value. FFT, fast Fourier transform.
To measure the amplitudes of a variety of modes simultaneously, it is essential to use angular multiplexing technique. The detailed design of the transmission function can be found elsewhere [29]. The final transmission functions for fiber laser MD are as follows:
where
To evaluate the accuracy of the MD, the cross-correlation function evaluates the agreement between the actual optical field and the reconstructed optical field as follows:
where
Demonstration of the Influence of Aberration on the MD Results
In order to analyze the influence of the aberrations on the MD results, a phase distortion is usually imposed on the initial field
where
Figure 2 shows a comparison of the MD result of an ideal fundamental Gaussian beam with and without defocus aberration. When the fundamental beam is superimposed with a plane wavefront, the modal weight of LP01 is analyzed to be 1. However, when it is superimposed with the defocus aberration, the MD result may no longer be the pure fundamental mode but the superposition of the fundamental mode and other high-order modes. This demonstration shows that the MD results can be greatly deteriorated by the existing aberrations in the optical path.
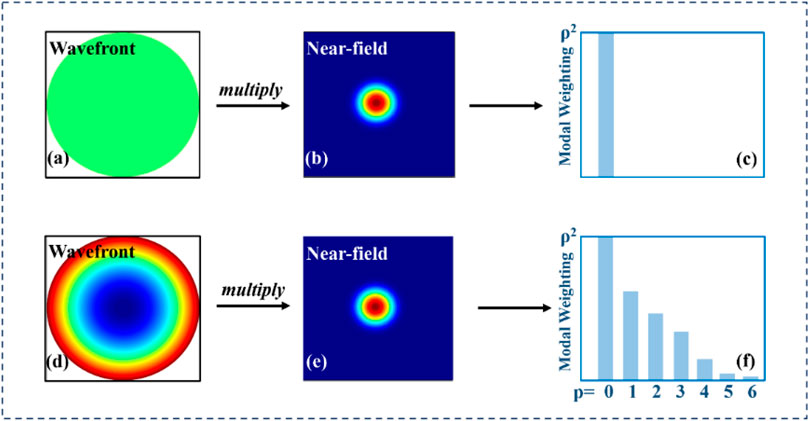
FIGURE 2. Mode decomposition result of an ideal fundamental Guassian beam with and without defocus aberration. (A) A plane wavefront, (B) near-field intensity of an ideal fundamental Guassian beam, (C) the modal decomposition (MD) result of a pure fundamental Guassian beam without aberration influence, (D) a defocus wavefront, (E) near-field intensity of an ideal fundamental Guassian beam, and (F) MD result of a distorted beam by the defocus aberration where the MD result changes into a superposition of several modes. [26].
Simulation and Results
Simulation of MD for Scalar Beam
In the simulation, we use a 25/250 (NA = 0.065) step-index LMA fiber. The supported eigenmodes in this LMA fiber at an operating wavelength λ of 1,064 nm are LP01, LP11e, LP11o, LP02, LP21e, and LP21o. Table 1 shows the initial fiber optical field, which consists of these six modes. The selection of modal weights refers to a common modal ratio of transverse mode transmission in the fiber. The modal phase of LP01 is set as 0 as a reference, and the intermodal phases of the other five modes are set as–π/2, π/2, –π/2, π/2, and –π/2, respectively.
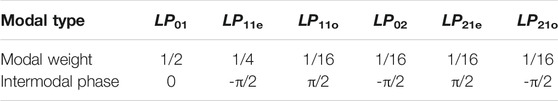
TABLE 1. Preset mode components in 25/250 (NA = 0.065) large-mode-area fiber laser.
A CGH serves as a filter made up of a number of angular multiplexing transmission functions, as depicted in Figure 3A. The CGH is usually loaded on the phase-only LC-SLM. The far-field spatial coordinate
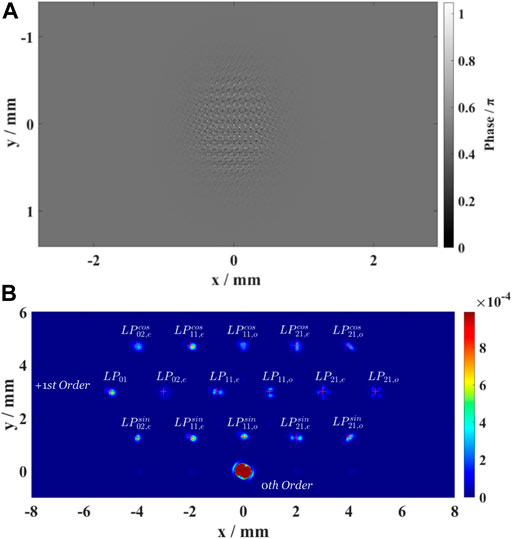
FIGURE 3. (A) An angular multiplexing computer-generated hologram involving 16 transmission functions, which are the complex conjugates of
After superimposing the CGH phase on the preset multimode light field, the near-field beam is now modulated by CGH. Figure 3B depicts the correlation signals in the far-field Fourier plane. The far-field intensity distribution involves undiffracted light (0th diffraction order) and diffracted light (+1st diffraction order) spots. Then, the grayscale value at one pixel of each centroid of the +1st diffraction order spot is acquired to calculate the modal weight and intermodal phase.
Influence of Aberration on the MD Results
To research the impact of various Zernike aberrations on the correlation coefficients and MD results, we individually superimpose the first fifteen Zernike terms on the preset fiber laser optical field. We then estimate the correlation coefficients by comparing the similarity between the original near-field and far-field optical fields and reconstructed optical fields from the MD results. In order to better compare the sensitivity of the correlation coefficient to the aberration strength, we take 90% as the threshold—when one of the near-field correlation coefficient (NFCC) and far-field correlation coefficient (FFCC) is lower than 90%, we define that the MD method is not accurate. Figure 4A shows a comparison of the original optical field and the reconstructed optical field under various defocus aberration strengths. When the defocus aberration strength increases from 1.1 to 1.2, the FFCC drops from 90.90 to 89.37%. Although the correlation coefficient is less than 90%, since the numerical value is relatively close, it seems that the far-field intensity graph does not change too much intuitively, and when the defocus aberration strength increases from 2.6 to 2.7, the NFCC drops from 92.99 to 77.40% due to a drastic change of the near-field intensity. The far-field intensity also presents a large distortion compared to the set far-field optical field with a FFCC of 43.94%. Hence, we define the tolerance of MD to a certain aberration, when one of the correlation coefficients falls below the threshold.
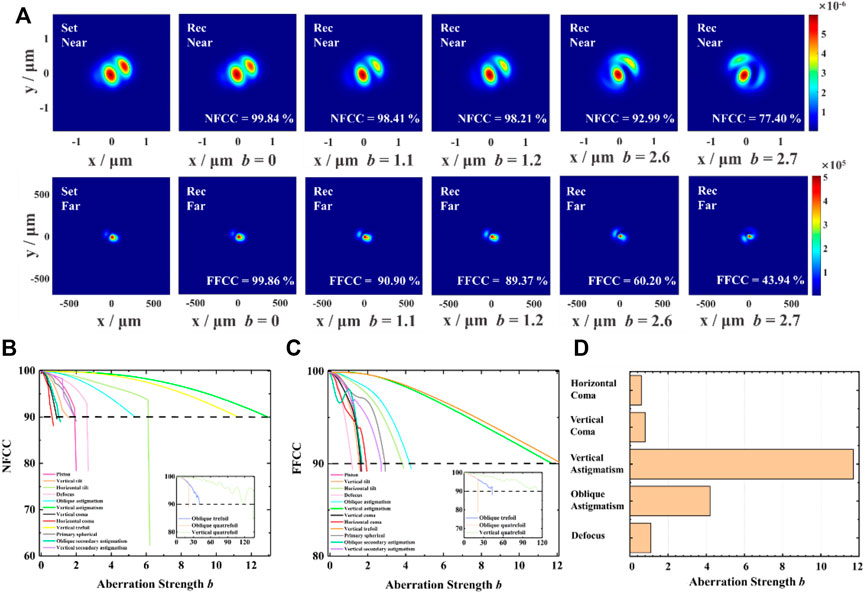
FIGURE 4. (A) Comparison of the set near/far optical field and reconstructed near/far optical field under various defocus aberration strengths. The curve of (B) NFCC and (C) FFCC with the aberration strength of the first fifteen Zernike terms. (D) The tolerance of modal decomposition (MD) to five kinds of aberrations. A valid MD has large tolerance to vertical astigmatism and oblique astigmatism and is strongly deteriorated by horizontal coma, vertical coma, and defocus. Set Near/Far, set near/far optical field intensity; Rec Near/Far, reconstructed near/far optical field intensity; NFCC, near-field cross-correlation coefficient; FFCC, far-field cross-correlation coefficient.
Figures 4B, C show the change of NFCC and FFCC under the first fifteen Zernike aberrations, respectively. We find that some aberrations have a greater impact on the optical field, e.g., defocus, horizontal coma, vertical coma, etc. When the aberration strength b increases, either NFCC or FFCC influenced by the above-mentioned three aberrations drop steeply. However, some aberrations have a relatively weak influence on the optical field, e.g., oblique trefoil, oblique quatrefoil, vertical quatrefoil, etc. Considering the actual needs in MD equipment, Figure 4D shows a summary of the tolerance of aberration strength of five common aberrations in optical systems, and Table 2 provides wavefront deformation, including wavefront PV and wavefront RMS corresponding to each aberration strength. It can be seen that MD can sustain a relatively large vertical astigmatism aberration strength of up to 11.7, from which we can calculate that the corresponding wavefront PV and RMS values are 1.2115 and 0.3027 λ, respectively. However, MD is sensitive to vertical coma aberration and horizontal coma aberration. The tolerance for horizontal coma is much lower at 0.6, and the corresponding wavefront PV and RMS values are 1.0010 and 0.1049 λ, respectively.
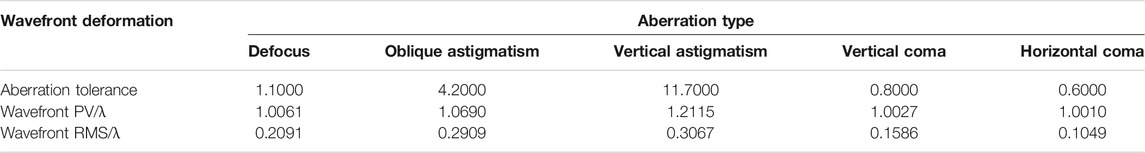
TABLE 2. Tolerance of aberration strength for common aberrations and the wavefront deformation.
Since the variation of the correlation coefficients are essentially due to the change of the MD results, to further quantify the influence of aberrations on MD results, we choose two most sensitive aberrations, vertical coma aberration and horizontal coma aberration, and simulate how the modal weights and intermodal phases change. The intermodal phase represents the phase difference between each researched high-order mode and LP01 (as introduced in the “Fiber Laser MD Using the OCF Method” section). Figure 5A shows how the modal weights and intermodal phases change with the aberration strength of the vertical coma aberration for the first six modes. It can be seen that the modal weights of LP01 (gray), LP02 (red), and LP11o (green) are strongly influenced. Especially for LP11o (green), the modal weight reduces from 6.11 to 0.21% and then increases back to 6.39%. The intermodal phase of LP11o (green) presents a sharp phase variation under the vertical coma aberration strength of 0.4 when the modal weight is close to 0. For horizontal coma aberration (Figure 5B), the trends of the modal weights are quite similar, except that the drastic change of intermodal phase turns to LP11e (blue). The sharp phase change that happens for LP11e (blue) is under the horizontal coma aberration strength of 0.42 when the modal weight is close to 3%. The above-mentioned data reveals that the modal weights undergo a disorderliness change like a modal coupling process in the fiber, and the intermodal phase of a high-order mode may sustain step-change under a certain aberration strength. It seems likely that the large phase change of both LP11o and LP11e is a result of the similarity of their intensity distribution and the two aberrations, as depicted in Figure 5C, and since they themselves are step-phases, their phases are more sensitive and are easier to change drastically.
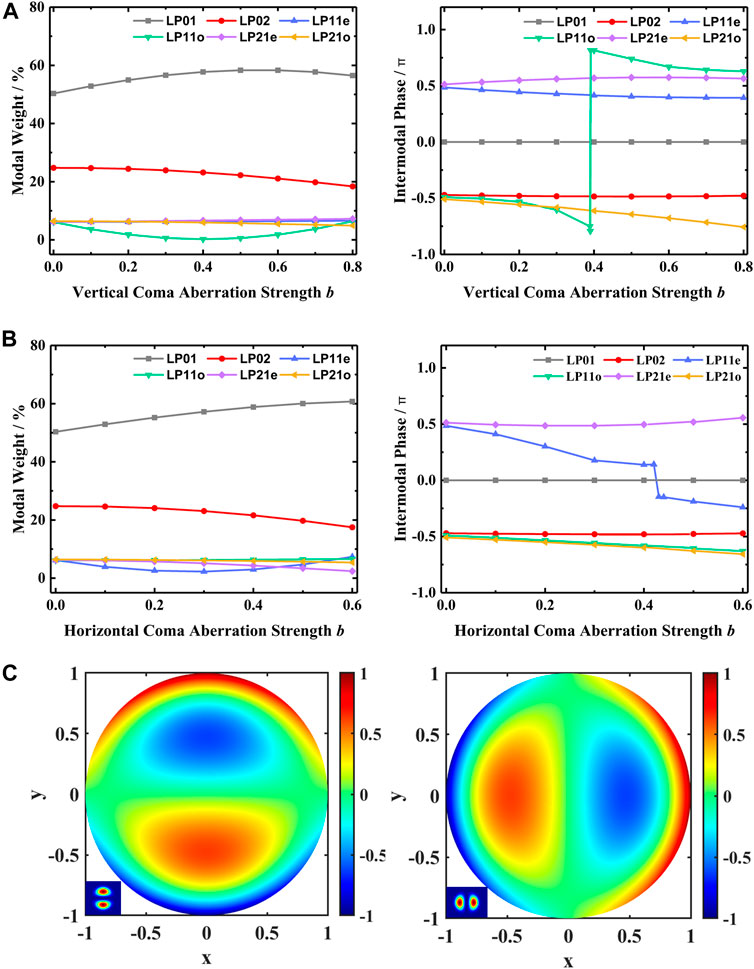
FIGURE 5. The curves of modal weights and intermodal phases correlated with the aberration strength of (A) vertical coma aberration and (B) horizontal coma aberration. Six modes including LP01, LP02, LP11e, LP11o, LP21e, and LP21o are analyzed. (C) Two Zernike terms normalized to unit circle: left, vertical coma aberration (the inserted graph is LP11o); right, horizontal coma aberration (the inserted graph is LP11e).
Undoubtedly, effectively pre-correcting the vertical coma aberration and horizontal coma aberration is of great importance for the construction of MD equipment. Before correcting aberrations, a useful wavefront sensor, e.g., Shark–Hartmann sensor, needs to be applied to accurately measure the wavefront [32]. When the actual wavefront aberration in the optical path is obtained, it is essential to correct the aberration to improve the results of fiber laser MD. Since the aberrations of the MD measurement system are stationary, the aberrations can be effectively eliminated using high-precision optical components. The phase-only LC-SLM can also be used to deliberately load targeted coma, defocus, and other phases to compensate the phase error and improve the system performance.
Summary
In conclusion, we investigated the impact of various Zernike aberrations on the MD performance in LMA fiber laser systems. Multi-modal contents were simultaneously acquired via the use of an angular multiplexing CGH using the OCF method. Various single aberrations were deliberately induced on the near-field, and then its influence on far-field MD performance was presented. Among the researched common aberrations, we find that MD is least sensitive to vertical astigmatism. However, the vertical coma aberration and the horizontal coma aberration have a greater influence on the MD results of modal weights and intermodal phases, corresponding to a sharply decreased correlation coefficient. Therefore, when we construct the MD equipment, it is essential to detect the system aberration with common wavefront measurement sensors, e.g., the Shark–Hartmann sensor. According to the wavefront measurement value, we then need to correct or compensate these two aberrations properly. Our analysis is useful to reduce the influence of aberrations on MD performance, serving for modal analysis and mode control in high-power fiber laser systems.
Data Availability Statement
The original contributions presented in the study are included in the article/Supplementary Material. Further inquiries can be directed to the corresponding author.
Author Contributions
JC, YL, and CL contributed to investigation. JC, JZ, KX, PL, QZ, and ZJ contributed to resources. JC contributed to writing—original draft preparation. JZ, PL, and WL contributed to writing—review and editing. JZ, WL, and GZ contributed to supervision. All authors have read and agreed to the published version of the manuscript.
Funding
This study was supported by the National Natural Science Foundation of China (12074432) and the Science and Technology Innovation Program of Hunan Province (2021RC3083).
Conflict of Interest
The authors declare that the research was conducted in the absence of any commercial or financial relationships that could be construed as a potential conflict of interest.
Publisher’s Note
All claims expressed in this article are solely those of the authors and do not necessarily represent those of their affiliated organizations or those of the publisher, the editors, and the reviewers. Any product that may be evaluated in this article or claim that may be made by its manufacturer is not guaranteed or endorsed by the publisher.
References
1. Tünnermann A, Schreiber T, Röser F, Liem A, Höfer S, Zellmer H, et al. The Renaissance and Bright Future of Fibre Lasers. J Phys B: Mol Opt Phys (2005) 38(9):S681–S693. doi:10.1088/0953-4075/38/9/016
2. Limpert J, Roser F, Klingebiel S, Schreiber T, Wirth C, Peschel T, et al. The Rising Power of Fiber Lasers and Amplifiers. IEEE J Select Top Quan Electron. (2007) 13(3):537–45. doi:10.1109/jstqe.2007.897182
3. He B, Zhou J, Lou Q, Xue Y, Li Z, Wang W, et al. 1.75-kilowatt Continuous-Wave Output Fiber Laser Using Homemade Ytterbium-Doped Large-Core Fiber. Microw Opt Technol Lett (2010) 52:1668–71. doi:10.1002/mop.25226
4. Zenteno L. High-power Double-Clad Fiber Lasers. J Lightwave Technol (1993) 11(9):1435–46. doi:10.1109/50.241933
5. Dawson JW, Messerly MJ, Beach RJ, Shverdin MY, Stappaerts EA, Sridharan AK, et al. Analysis of the Scalability of Diffraction-Limited Fiber Lasers and Amplifiers to High Average Power. Opt Exp (2008) 16(17):13240–66. doi:10.1364/oe.16.013240
6. Jauregui C, Stihler C, Limpert J. Transverse Mode Instability. Adv Opt Photon (2020) 12(2):429–84. doi:10.1364/aop.385184
7. Eidam T, Hädrich S, Jansen F, Stutzki F, Rothhardt J, Carstens H, et al. Preferential Gain Photonic-crystal Fiber for Mode Stabilization at High Average powers. Opt Exp (2011) 19:8656–61. doi:10.1364/oe.19.008656
8. Ward BG. Maximizing Power Output from Continuous-Wave Single-Frequency Fiber Amplifiers. Opt Lett (2015) 40:542–5. doi:10.1364/ol.40.000542
9. Robin C, Dajani I, Pulford B. Modal Instability-Suppressing, Single-Frequency Photonic crystal Fiber Amplifier with 811 W Output Power. Opt Lett (2014) 39:666–9. doi:10.1364/ol.39.000666
10. Tao R, Ma P, Wang X, Zhou P, Liu Z. Influence of coreNAon thermal-induced Mode Instabilities in High Power Fiber Amplifiers. Laser Phys Lett (2015) 12:085101. doi:10.1088/1612-2011/12/8/085101
11. Smith JJ, Smith AV. Influence of Signal Bandwidth on Mode Instability Thresholds of Fiber Amplifiers. Proc SPIE (2015) 9344:93440L. doi:10.1117/12.2077021
12. Eznaveh ZS, López-Galmiche G, Antonio-López E, Correa RA. Bi-directional Pump Configuration for Increasing thermal Modal Instabilities Threshold in High Power Fiber Amplifiers. Proc SPIE (2015) 9344:93442G. doi:10.1117/12.2080536
13. Yang B, Zhang H, Shi C, Wang X, Zhou P, Xu X, et al. Mitigating Transverse Mode Instability in All-Fiber Laser Oscillator and Scaling Power up to 25 kW Employing Bidirectional-Pump Scheme. Opt Exp (2016) 24:27828–35. doi:10.1364/oe.24.027828
14. Shi C, Su RT, Zhang HW, Yang BL, Wang XL, Zhou P, et al. Experimental Study of Output Characteristics of Bi-directional Pumping High Power Fiber Amplifier in Different Pumping Schemes. IEEE Photon J. (2017) 9:1–10. doi:10.1109/jphot.2017.2679753
15. You Y, Bai G, Zou XX, Li XW, Su MQ, Wang HB, et al. A 1.4-kw Mode-Controllable Fiber Laser System. J Lightwave Technol (2021) 39(5):2536–41. doi:10.1109/jlt.2021.3049603
16. Nicholson JW, Yablon AD, Ramachandran S, Ghalmi S. Spatially and Spectrally Resolved Imaging of Modal Content in Large-Mode-Area Fibers. Opt Exp (2008) 16(10):7233–43. doi:10.1364/oe.16.007233
17. Andermahr N, Theeg T, Fallnich C. Novel Approach for Polarization-Sensitive Measurements of Transverse Modes in Few-Mode Optical Fibers. Appl Phys B (2008) 91(2):353–7. doi:10.1007/s00340-008-3011-9
18. Andermahr N, Fallnich C. Interaction of Transverse Modes in a Single-Frequency Few-Mode Fiber Amplifier Caused by Local Gain Saturation. Opt Exp (2008) 16(12):8678–84. doi:10.1364/oe.16.008678
19. Lyu M, Lin Z, Li G, Situ G. Fast Modal Decomposition for Optical Fibers Using Digital Holography. Sci Rep (2017) 7:6556. doi:10.1038/s41598-017-06974-7
20. Paurisse M, Lévèque L, Hanna M, Druon F, Georges P. Complete Measurement of Fiber Modal Content by Wavefront Analysis. Opt Exp (2012) 20(4):4074–84. doi:10.1364/OE.20.004074
21. Shapira O, Abouraddy AF, Joannopoulos JD, Fink Y. Complete Modal Decomposition for Optical Waveguides. Phys Rev Lett (2005) 94(14):143902. doi:10.1103/physrevlett.94.143902
22. Brüning R, Gelszinnis P, Schulze C, Flamm D, Duparré M. Comparative Analysis of Numerical Methods for the Mode Analysis of Laser Beams. Appl Opt (2013) 52(32):7769–77. doi:10.1364/ao.52.007769
23. Kaiser T, Flamm D, Schröter S, Duparré M. Complete Modal Decomposition for Optical Fibers Using CGH-Based Correlation Filters. Opt Exp (2009) 17:9347–56. doi:10.1364/oe.17.009347
24. Xie K, Liu W, Zhou Q, Jiang Z, Xi F, Xu X. Real-time Phase Measurement and Correction of Dynamic Multimode Beam Using a Single Spatial Light Modulator. Chin Opt Lett (2020) 18(1):011404. doi:10.3788/col202018.011404
25. Otto H-J, Stutzki F, Jansen F, Eidam T, Jauregui C, Limpert J, et al. Temporal Dynamics of Mode Instabilities in High-Power Fiber Lasers and Amplifiers. Opt Exp (2012) 20(14):15710–22. doi:10.1364/oe.20.015710
26. Schulze C, Dudley A, Flamm D, Duparré M, Forbes A. Reconstruction of Laser Beam Wavefronts Based on Mode Analysis. Appl Opt (2013) 52(21):5312–7. doi:10.1364/ao.52.005312
27. Soifer VA, Golub MA. Laser Beam Mode Selection by Computer Generated Holograms. Boca Raton, USA: CRC Press (1994).
28. Golub MA, Sisakyan IN, Soifer VA. Mode Selection of Laser Radiation by Computer- Generated Optical Elements. Opt Lasers Eng (1991) 15(5):341–56. doi:10.1016/0143-8166(91)90021-k
29. Flamm D, Naidoo D, Schulze C, Forbes A, Duparré M. Mode Analysis with a Spatial Light Modulator as a Correlation Filter. Opt Lett (2012) 37(13):2478–80. doi:10.1364/ol.37.002478
30. Xie K, Liu W, Zhou Q, Huang L, Jiang Z, Xi F, et al. Adaptive Phase Correction of Dynamic Multimode Beam Based on Modal Decomposition. Opt Exp (2019) 27(10):13793. doi:10.1364/oe.27.013793
31. Arrizón V, Ruiz U, Carrada R, González LA. Pixelated Phase Computer Holograms for the Accurate Encoding of Scalar Complex fields. J Opt Soc Am A (2007) 24:3500–7. doi:10.1364/josaa.24.003500
Keywords: modal decomposition, Zernike aberrations, optical correlation filter, angular multiplexing technique, modal analysis
Citation: Chai J, Liu W, Zhang J, Xie K, Lu Y, Li C, Liu P, Zhou Q, Jiang Z and Zhao G (2022) Influence of Aberrations on Modal Decomposition for LMA Fiber Laser Systems. Front. Phys. 9:796666. doi: 10.3389/fphy.2021.796666
Received: 17 October 2021; Accepted: 22 November 2021;
Published: 05 January 2022.
Edited by:
Svetlana Khonina, Image Processing Systems Institute (RAS), RussiaCopyright © 2022 Chai, Liu, Zhang, Xie, Lu, Li, Liu, Zhou, Jiang and Zhao. This is an open-access article distributed under the terms of the Creative Commons Attribution License (CC BY). The use, distribution or reproduction in other forums is permitted, provided the original author(s) and the copyright owner(s) are credited and that the original publication in this journal is cited, in accordance with accepted academic practice. No use, distribution or reproduction is permitted which does not comply with these terms.
*Correspondence: Jiangbin Zhang, emhhbmdqaWFuZ2JpbkBudWR0LmVkdS5jbg==
†These authors have contributed equally to this work