- 1State Key Laboratory of Precision Measuring Technology and Instruments, Tianjin University, Tianjin, China
- 2Nanchang Institute for Microtechnology, Tianjin University, Tianjin, China
The sesquioxide Lu2O3 single crystal has attracted tremendous attention as potential host material for high-power solid-state lasers. As polishing is the terminal process of conventional ultra-precision machining, the quality of polished crystal directly impacts the crucial performance indicators of optics. The high melting point of Lu2O3 single crystal makes crystal preparation difficult. Therefore, investigations on the surface/subsurface quality inspection of polished Lu2O3 single crystal are scarce. In this paper, we utilize the quasi-Brewster angle technique (qBAT) based on ellipsometry to inspect the quality of polished Lu2O3 single crystal, achieving fast, non-destructive, and high-sensitive surface/subsurface damage assessment. A systematic crystal processing scheme is designed and polished Lu2O3 crystal samples are obtained. To verify the results of qBAT, the surface and subsurface quality are tested using optical profilometer and transmission electron microscope, respectively. The consistency of the test results demonstrates the feasibility, high sensitivity, and accuracy of the qBAT. To our knowledge, this is the first time that the qBAT is applied to investigate the polished surface/subsurface quality of Lu2O3 single crystal. In conclusion, this method provides a powerful approach to the high-precision characterization of the surface/subsurface quality of Lu2O3 single crystal, and has significant potential for material property study and process optimization during ultra-precision machining.
Introduction
Lu2O3 single crystal as sesquioxide has proven to be prospective for high-power solid-state lasers, high-energy radiation detection, and semiconductors due to its high thermal conductivity, low phonon energy, high-density scintillators, high absorption efficiency, wide band gap, and robust thermal stability [1–7]. Polishing, as the terminal process of traditional ultra-precision machining, can achieve high surface flatness and roughness, but inevitably produces surface and subsurface damage. Typical surface and subsurface damage include pits, scratches, subsurface cracks, residual stresses, dislocations, etc. [8, 9]. Surface/subsurface damage directly diminishes the strength, lifetime, coating quality, imaging quality, and laser damage threshold of optics. However, investigations on the surface/subsurface quality of polished Lu2O3 single crystals are scarce, which severely limits the design, fabrication, and application of related devices. The prerequisite for effective suppression and removal of surface and subsurface damage is high precision inspection. Therefore, the assessment of surface/subsurface damage on polished Lu2O3 has momentous theoretical research significance and practical value.
Conventional surface inspection methods, such as optical profilometer, atomic force microscope (AFM), and scanning tunneling microscope (STM), are sufficient for surface quality testing needs [10–13]. Since subsurface damage is overlapped by the sample surface, high precision assessment of subsurface damage is challenging. In addition, as ultra-precision machining moves toward atomic and close-to-atomic scale manufacturing (ACSM), subsurface damage scales approach the nano/sub-nano level and are coupled, further increasing the difficulty of detection [14]. Subsurface damage detection methods are categorized into destructive and non-destructive methods according to its destructiveness to the sample. Destructive detection methods normally employ physical or chemical approaches to remove the portion covering the subsurface damage, thereby exposing the subsurface damage directly, and then using conventional methods for defect detection. Destructive methods include transmission electron microscopy (TEM), magnetorheological finishing (MRF) polishing, chemical etching, etc. [15–18]. Although the accuracy is relatively high, they will cause irreversible and permanent damage to the sample, making it extremely restrictive in many fields. Non-destructive methods are mainly optical methods, depending on the interaction between light and matter. They have advantages such as contact free and high speed, and they include optical coherence tomography (OCT), laser scattering, X-ray diffraction (XRD), quasi-Brewster angle technique (qBAT), etc. [19–22]. Non-destructive methods have relatively low measurement accuracy and can usually only measure samples with low damage. In addition, they are susceptible to environmental interference.
Quasi-Brewster angle technique (qBAT) based on ellipsometry achieves simultaneous detection of surface and subsurface damage by measuring the phase difference curves of the sample in the vicinity of the Brewster angle. Specifically, the slope at the quasi-Brewster angle reflects the surface roughness, and the quasi-Brewster angle shift (qBAS) represents the subsurface damage. The qBAT has been utilized to investigate the surface/subsurface quality of fused silica, quartz crystal, CaF2 crystal [22, 23]. In our previous work, surface/subsurface damage of gadolinium gallium garnet (GGG) crystals at the rough and fine polishing processes was investigated using the qBAT [24]. By establishing appropriate optical models for various polishing processes, the applicability of qBAT is extended to rough polishing. Moreover, the trend of Slope falling and then rising during polishing was observed first, which was verified by the surface morphology measurement results. In summary, related studies have amply demonstrated that qBAT is a promising method for polished surface/subsurface quality assessment.
In this paper, the surface/subsurface quality of Lu2O3 single crystal at the fine polishing and chemical mechanical polishing (CMP) processes was assessed using qBAT. By designing systematic crystal processing scheme, Lu2O3 single crystals with different surface/subsurface qualities were obtained at the fine polished and CMP processes, respectively. The phase difference curves of different samples were measured near the Brewster angle employing variable angle ellipsometer. The measurement data were analyzed based on the principle of qBAT to obtain the surface/subsurface quality of the different samples. To verify the measurement results of qBAT, the surface and subsurface damage were measured using optical profilometer and TEM, respectively. The consistency of the results illustrates the validity and high sensitivity of qBAT. In conclusion, this study provides a powerful approach for polished surface/subsurface quality assessment of hard and brittle materials such as Lu2O3 single crystal and explores the potential applications of qBAT.
Materials and Methods
Polishing Process
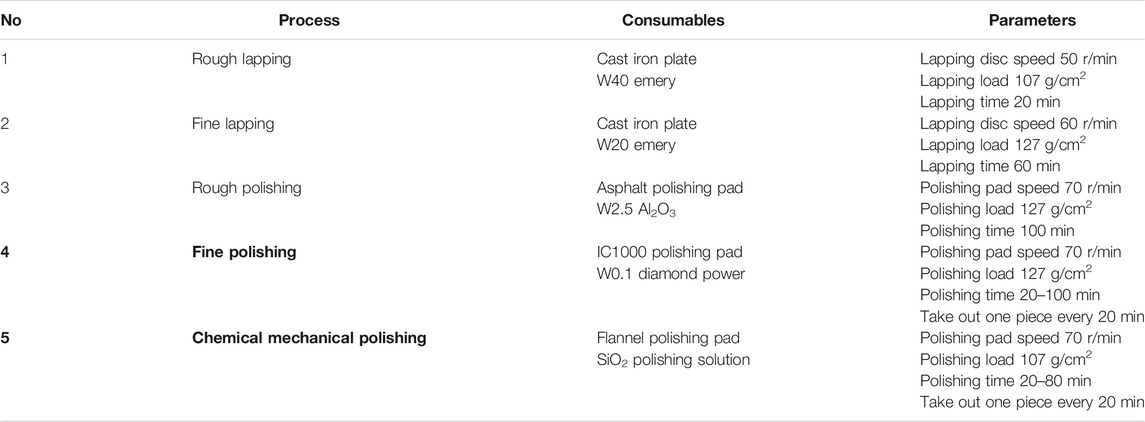
Lu2O3 single crystal samples were prepared by the edge-defined film-fed growth (EFG) method, and the details of the crystal preparation are given in [25]. The sample diameter is about 12 mm and the thickness is 1 mm. To obtain fine polished and CMP samples with different surface/subsurface damage, we designed a processing scheme as shown in Table 1. The processing scheme consists of two processes, lapping and polishing. Lapping is divided into rough lapping and fine lapping, and polishing is classified into rough polishing, fine polishing, and CMP. This study focuses on the fine polishing and CMP, and a total of nine samples were obtained. Five fine polished samples were polished for 20–100 min, with one piece removed from the polishing equipment at a 20-min interval. Four CMP samples were polished for 20–80 min with a 20-min interval. Note that the processing scheme is progressive from lapping to polishing. This is considered from the machining efficiency, as the material removal rate of polishing is far lower compared with lapping. Thus, the scheme guarantees a relatively fast removal of crystal defects caused by the preceding processes such as wire cutting and grinding. In addition, as ellipsometry measurements in the oblique incidence configuration are susceptible to interference from backside reflections, the samples are polished on one side and roughened on the other.
Quasi-Brewster Angle Technique (qBAT)
The prerequisite for qBAT is to build a reasonable optical model for the damage of samples. Figure 1A, Figure 1B, and Figure 1C show the schematic diagrams of the optical models corresponding to the ideal crystal (Ideal), only surface roughness (SR), and simultaneous existence of surface roughness and subsurface damage (SSD), respectively. In this paper, it is assumed that the ideal crystal is Lu2O3 single crystal without any surface roughness and subsurface damage. The model is the reference to evaluate the effect of surface roughness and subsurface damage on the phase difference curve, which is not available in the actual fabrication. Crystal processing normally results in both surface roughness and subsurface damage. The surface quality is relatively high in the fine polishing and CMP, and the surface roughness is generally in the nanometer scale. The sample surface contains pits, scratches, and height undulations, and the subsurface damage is more complex and diverse and coupled with each other. To simplify the model, they are equated as surface roughness (SR) layer and subsurface damage (SSD) layer, respectively. In addition, there is no strict boundary between surface roughness and subsurface damage, and the boundaries in Figure 1B and Figure 1C are schematic lines. The surface roughness layer and subsurface damage layer are characterized using the effective medium approximation (EMA) model [26], as shown in
where ε1, ε2 are the corresponding dielectric constants of medium 1 and medium 2, here are air and Lu2O3 single crystal, respectively. ε is the calculated effective dielectric constant. f1 and (1−f1) are the corresponding porosities of medium 1 and medium 2, accordingly. It should be noted that the porosities of the surface roughness layer and the subsurface damaged layer are different.
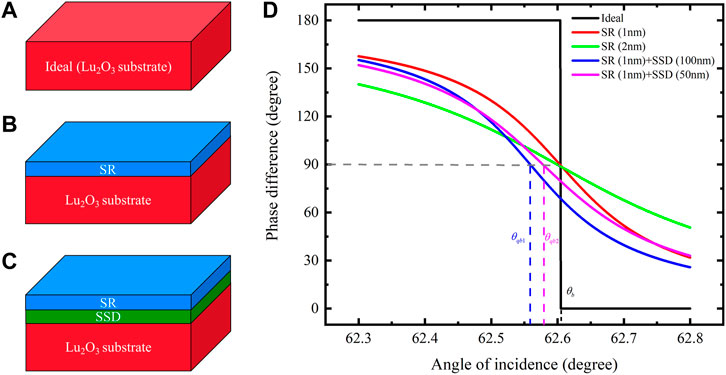
FIGURE 1. (A–C) are the corresponding optical models for ideal crystal (Ideal), only surface roughness (SR), and both surface roughness and subsurface damage (SSD), respectively; (D) is the corresponding simulation result.
Based on qBAT, surface roughness is evaluated by analyzing the slope of the phase difference curve at the quasi-Brewster angle (θqb); subsurface damage is assessed by the shift between θqb and the Brewster angle (θb). The θqb is defined as the angle of incidence corresponding to the phase difference equals to 90° in the optical model shown in Figure 1C. The expressions for Slope and the quasi-Brewster angle shift (qBAS) are shown in Eqs 2, 3:
where θ and Δ are the incident angle and phase difference, respectively. f′ (θ, Δ) is the first-order derivative equation of the corresponding fitted curve of the phase difference curve. Details of the derivation of θb, θqb, and Δ are given in [24].
Figure 1D shows the simulation results of the phase difference curves near Brewster angle for the corresponding optical models in Figure 1A, Figure 1B, and Figure 1C. The wavelength is 640 nm, and the corresponding refractive indices for air and Lu2O3 single crystal are 1 and 1.9296, respectively [27]. The incident angle ranges from 62.3 to 62.8° in steps of 0.001°. The corresponding EMA models for both the surface roughness layer and the subsurface damage layer are mixtures of air and Lu2O3 single crystal with porosities of 0.5 and 0.002, respectively. The simulation experiments were done in MATLAB software. The phase difference curve corresponding to ideal crystal changes abruptly by 180° when the incident angle is θb, as shown by the black line in Figure 1D. When only surface roughness exists, the slope of the phase difference curve at Brewster angle decreases and is no longer an abrupt change. However, the Brewster angle hardly shifts, as shown in the red and green lines in Figure 1D. It is worth noting that the Slope of the green curve in Figure 1D is smaller than the Slope of the red curve in Figure 1D. It indicates that Slope represents the surface roughness, and the thicker the surface roughness layer, the smaller the Slope. When the surface roughness layer and subsurface damage layer coexist, the Slope changes and the θqb shifts, indicating that the qBAS reflects the subsurface damage, as shown by the blue and magenta lines in Figure 1D. In addition, the absolute value of the qBAS corresponding to 100 nm subsurface damage layer thickness (|θqb2−θb|) is larger than that of 50 nm (|θqb1−θb|), indicating that the more severe the subsurface damage, the larger the absolute value of qBAS. The thickness of the surface damage layer is fixed at 1 nm when varying the thickness of the subsurface damage. This is rational because the surface quality in fine polishing and CMP is high, with roughness basically in the nanometer scale. The results of related studies and the measurements of the optical profilometer in Results and Discussion verify this conclusion [28, 29]. In summary, qBAT can achieve rapid and synchronous inspection of surface roughness and subsurface damage.
Results and Discussion
Surface/Subsurface Quality Measurement Based on Optical Profilometer and TEM
To obtain surface morphology and surface roughness (Sa), all samples were measured using optical profilometer (Sneox, Sensofar). Typical measurements selected from fine polishing and CMP are shown in Figure 2. The measurement area is 877.2 × 660.5 μm using ×20 objective and PSI algorithm. Many scratches exist at the start of fine polishing, and as polishing proceeds the scratches gradually decrease until they disappear, as shown in Figure 2A–C. The surface of the CMP samples is smoother and free from obvious defects such as scratches, as shown in Figure 2D–F. The surface roughness (Sa) shows decreasing trend with respect to the fine polished samples. Each sample was measured at three randomly selected locations in the center area, and the average of the three measurements was used as the final surface roughness (Sa). The final measured results of Sa of all samples are shown in Figure 5B. The overall Sa tends to decrease as polishing progresses, and the surface roughness of all CMP samples is lower than that of the fine polished samples. In addition, the error bar is relatively large, which is attributed to the surface that is already smooth and the surface roughness (Sa) is around 1 nm, when a slight sub-nanometer undulation of the surface will lead to significant deviation. The measurement area (877.2 × 660.5 μm) is a tiny fraction of the sample surface size (about 12 mm in diameter), so multiple measurements at different locations are bound to vary slightly.
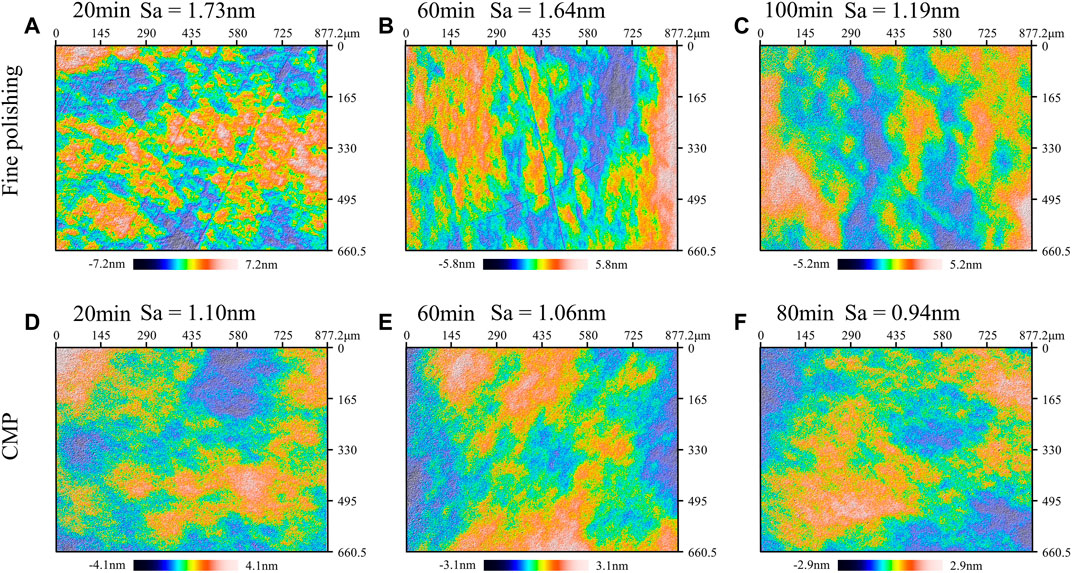
FIGURE 2. (A–C) are typical measurements of optical profilometer for 20, 60, and 100 min samples of fine polishing, respectively; (D–F) are typical measurements of optical profilometer for 20, 60, and 80 min samples of CMP, respectively.
Transmission electron microscopy (FEI, Talos F200X, operating at 200kV) is utilized to analyze subsurface damage of samples. Owing to the weak conductivity of Lu2O3 single crystal, Au conductive layer needs to be pre-deposited on the sample surface to facilitate the TEM specimen preparation. The Pt protective layer was deposited again to prevent additional subsurface damage caused by focused ion beam (FIB) during the TEM specimen thinning process. Two typical samples with 60 min of fine polishing and 60 min of CMP were selected for cross-sectional TEM measurement, as shown in Figure 3A and Figure 3C. No apparent subsurface damages, such as subsurface cracks, deformation layers, and residual stresses, are observed in both the fine polished and the CMP samples. To further investigate the minute subsurface damage of both, high magnification TEM tests were performed on the areas in the dashed boxes in Figure 3A, C, respectively, as shown in Figure 3B, D. It can be seen that the lattice distribution is regular and uniform, and there are almost no dislocations, twins, and amorphous and other defects. In conclusion, the TEM measurement results demonstrate that there is virtually no subsurface damage in either of the two typical samples. It should be emphasized that since the TEM specimen preparation will damage the sample, the actual measurement procedure is optical non-destructive tests, including optical profilometer and ellipsometer measurements, followed by TEM.
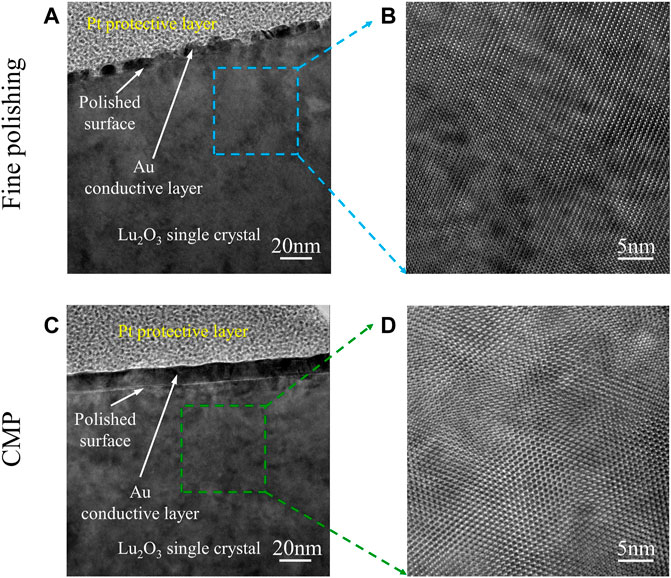
FIGURE 3. (A) and (C) are the cross-sectional TEM images of the 60 min fine polished and 60 min CMP samples, respectively; (B) and (D) are the high magnification images of the positions in the dashed boxes in (A) and (C), respectively.
qBAT Measurement Results
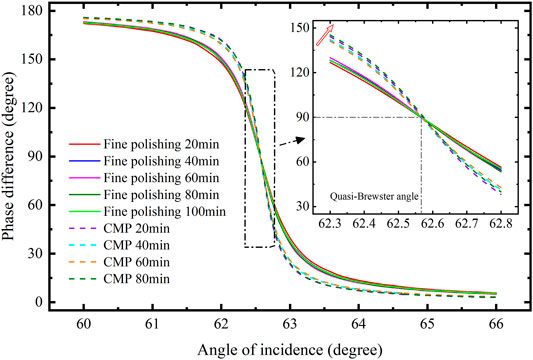
The phase difference of all polished samples near Brewster angle was measured using variable angle ellipsometer (J.A. Woollam, RC2), and all phase difference curves are shown in Figure 4. The incident angle range is 60–66°, 0.1° as increment, and the long axis and short axis of elliptical measurement spot are about 6 and 4 mm, respectively. The phase difference measured data corresponding to the wavelength of 640 nm are selected. As with the optical profilometer test, we selected three locations in the central area of the sample for measurement, and the average of the three measurements was adopted as the final result. The solid and dotted lines are the phase difference curves of the five fine polished samples and the four CMP samples, respectively. All the phase difference curves are steep and the Slope is close to 90°, indicating that the surface roughness is small, which is in agreement with the measurement results of the optical profilometer. To observe the details in the vicinity of Brewster angle, the data in the range of 62.3–62.8° incidence angle were magnified, as shown in the inset of Figure 4. The Slope of the CMP samples is significantly larger than that of the fine polished samples, which shows that the surface roughness of the CMP samples is lower than that of the fine polished ones. Also, the preliminary judgment is that the Slope shows a rising trend with the increase of polishing time. Note that the θqb for all the fine polished and CMP samples is rarely shifted, indicating that the subsurface damage is basically unchanged.
Figure 5A shows the Slope and qBAS measured results for all samples, which are calculated by fitting the phase difference curves in Figure 4. The horizontal axis is the total polishing time, and the CMP polishing time is to be added to the 100 min of fine polishing. The corresponding 3D optical profilometer surface roughness (Sa) measurement results are shown in Figure 5B. Slope tends to rise as polishing proceeds and basically remains stable at CMP process, indicating that the surface roughness tends to decrease and eventually stabilize. The results match with the optical profilometer measurements, as shown in Figures 2, 5B, and demonstrate the feasibility of qBAT to inspect the polished surface roughness. During the whole polishing process, the change of Sa is basically within 1 nm, and the trend of Slope variation can coincide with it, revealing the sub-nanometer level sensitivity of the qBAT to surface roughness. In addition, the Slope trend does not correspond precisely to the Sa measurement due to the larger measurement area of the ellipsometer, which is about 33 times larger than that of the optical profilometer. Slope measurements are more representative of surface roughness for large-size crystal and not susceptible to local surface undulations. The relatively large roughness error bar of the 100 min fine polished sample indicates that the uniformity of the surface roughness is poor. The magenta line in Figure 5A is the qBAS measured result, which remains basically stable around −0.03°, approaching the ideal value of 0°. It implies that the subsurface damage of all samples is virtually identical and subsurface damage is rare, which is consistent with the TEM measurement results, as shown in Figure 3. The feasibility of qBAT to evaluate subsurface damage is verified. When no subsurface damage exists, the theoretical value of qBAS is 0, but the actual measurement is about −0.03°. This is attributed to that qBAS is directly influenced by the refractive index of the selected Lu2O3 single crystal. The refractive index in the reference literature is inevitably deviated from the actual refractive index, which leads to shifts between the qBAS measurements and the theoretical values.
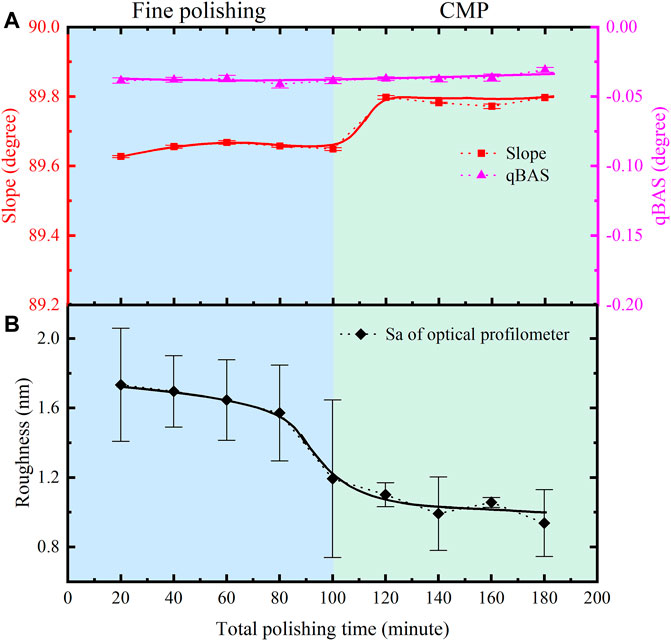
FIGURE 5. (A) Slope and qBAS measurement results for all samples. (B) Surface roughness Sa measurement results for all samples.
Conclusion
In this study, the surface and subsurface damage of fine polished and CMP Lu2O3 single crystal was investigated using the qBAT. To obtain samples with various surface/subsurface damage, a crystal processing scheme was designed. To verify the measurement results of the qBAT, the surface and subsurface quality were characterized by commercial 3D optical profilometer and TEM, respectively. The consistency of the measured results demonstrates the feasibility and high sensitivity of qBAT for evaluating surface and subsurface damage on polished Lu2O3 single crystal. Consequently, the qBAT enables fast, non-destructive, and facile inspection of polished surfaces and subsurface damage. It overcomes the intrinsic drawbacks of conventional inspection methods, which are complicated, time consuming, and costly. Rapid and simultaneous analysis of surface and subsurface damage based on Slope and qBAS measurement results provides critical guidance for the optimization of polishing processes during machining. In conclusion, this study provides an efficient approach for polished Lu2O3 surface/subsurface damage assessment and further broadens the application of qBAT.
Data Availability Statement
The raw data supporting the conclusions of this article will be made available by the authors, without undue reservation.
Author Contributions
All authors listed have made a substantial, direct, and intellectual contribution to the work and approved it for publication.
Funding
The project is supported by National Key Research and Development Program (grant no. 2019YFB2005601), the General Program of NSFC (52075383), and Major scientific research instrument development project of NSFC (61927808).
Conflict of Interest
The authors declare that the research was conducted in the absence of any commercial or financial relationships that could be construed as a potential conflict of interest.
Publisher’s Note
All claims expressed in this article are solely those of the authors and do not necessarily represent those of their affiliated organizations, or those of the publisher, the editors, and the reviewers. Any product that may be evaluated in this article, or claim that may be made by its manufacturer, is not guaranteed or endorsed by the publisher.
References
1. Liu J, Yang X, Chen R, Feng B, Zhu H, Luan C, et al. Vertical Nanoporous GaN Substrates for Photonic Engineering: Lu2O3:Eu Single crystal Thin Films as an Example. J Alloys Comp (2021) 892:162069. doi:10.1016/j.jallcom.2021.162069
2. Guzik M, Pejchal J, Yoshikawa A, Ito A, Goto T, Siczek M, et al. Structural Investigations of Lu2O3 as Single Crystal and Polycrystalline Transparent Ceramic. Cryst Growth Des (2014) 14:3327–34. doi:10.1021/cg500225v
3. Hou W, Zhao H, Li N, Xue Y, Shi J, Xu X, et al. Spectroscopic Properties of Er:Lu2O3 crystal in Mid-infrared Emission. Opt Mater (2019) 98:109508. doi:10.1016/j.optmat.2019.109508
4. Hu J, Guo H, Du W, Yang F, Yang Q, Feng H. Luminescent Properties and X-ray Imaging Result of Lu2O3:Eu Structured Scintillation Film on YSZ Single crystal Substrate by LCVD Method. Ceramics Int (2021) 47:28505–10. doi:10.1016/j.ceramint.2021.07.007
5. Zhang D, Lin W, Lin Z, Jia L, Zheng W, Huang F. Lu2O3: A Promising Ultrawide Bandgap Semiconductor for Deep UV Photodetector. Appl Phys Lett (2021) 118:211906. doi:10.1063/5.0048752
6. Zhang N, Zhou H, Yin Y, Wang T, Zhang J, Ye L, et al. Exploring Promising Up-Conversion Luminescence Single crystal Fiber in Sesquioxide Family for High Temperature Optical Thermometry Application. J Alloys Comp (2022) 889:161348.
7. Zhang S, Guo X, Jin Z, Kang R, Guo D. Material Removal Characteristics of Precorroded Lu2O3 Laser Crystals and Elastic Deformation Model during Nanoscratch Process. Tribology Int (2020) 143:106027. doi:10.1016/j.triboint.2019.106027
8. Aida H, Takeda H, Doi T. Analysis of Mechanically Induced Subsurface Damage and its Removal by Chemical Mechanical Polishing for Gallium Nitride Substrate. Precision Eng (2021) 67:350–8. doi:10.1016/j.precisioneng.2020.10.007
9. Li M, Karpuschewski B, Ohmori H, Riemer O, Wang Y, Dong T. Adaptive Shearing-Gradient Thickening Polishing (AS-GTP) and Subsurface Damage Inhibition. Int J Machine Tools Manufacture (2021) 160:103651. doi:10.1016/j.ijmachtools.2020.103651
10. Michaels JA, Janavicius L, Wu X, Chan C, Huang HC, Namiki S, et al. Producing Silicon Carbide Micro and Nanostructures by Plasma‐Free Metal‐Assisted Chemical Etching. Adv Funct Mater (2021) 31:2103298. doi:10.1002/adfm.202103298
11. Sagbas B, Gümüş BE, Kahraman Y, Dowling DP. Impact of Print Bed Build Location on the Dimensional Accuracy and Surface Quality of Parts Printed by Multi Jet Fusion. J Manufacturing Process (2021) 70:290–9. doi:10.1016/j.jmapro.2021.08.036
12. Erinosho MF, Akinlabi ET, Johnson OT. Characterization of Surface Roughness of Laser Deposited Titanium alloy and Copper Using AFM. Appl Surf Sci (2018) 435:393–7. doi:10.1016/j.apsusc.2017.11.131
13. Luo Y, Jelic V, Chen G, Nguyen PH, Liu Y-JR, Calzada JAM, et al. Nanoscale Terahertz STM Imaging of a Metal Surface. Phys Rev B (2020) 102:205417. doi:10.1103/physrevb.102.205417
14. Mathew PT, Rodriguez BJ, Fang F. Atomic and Close-To-Atomic Scale Manufacturing: A Review on Atomic Layer Removal Methods Using Atomic Force Microscopy. Nanomanuf Metrol (2020) 3:167–86. doi:10.1007/s41871-020-00067-2
15. Sun X, Zhu W, Wu D, Li C, Wang J, Zhu Y, et al. Surface-reaction Induced Structural Oscillations in the Subsurface. Nat Commun (2020) 11:305. doi:10.1038/s41467-019-14167-1
16. Zhang Q, Chu C, Zhang Z, Zhu Y. Nanosecond UV Laser Induced Subsurface Damage Mechanics of Cemented Tungsten Carbide. Ceramics Int (2021) 47:32927–37. doi:10.1016/j.ceramint.2021.08.191
17. Shafrir SN, Lambropoulos JC, Jacobs SD. Subsurface Damage and Microstructure Development in Precision Microground Hard Ceramics Using Magnetorheological Finishing Spots. Appl Opt (2007) 46:5500–15. doi:10.1364/ao.46.005500
18. Neauport J, Ambard C, Cormont P, Darbois N, Destribats J, Luitot C, et al. Subsurface Damage Measurement of Ground Fused Silica Parts by HF Etching Techniques. Opt Express (2009) 17:20448–56. doi:10.1364/oe.17.020448
19. Hou F, Zhang M, Zheng Y, Ding L, Tang X, Liang Y. Detection of Laser-Induced Bulk Damage in Optical Crystals by Swept-Source Optical Coherence Tomography. Opt Express (2019) 27:3698–709. doi:10.1364/oe.27.003698
20. Trost M, Herffurth T, Schmitz D, Schröder S, Duparré A, Tünnermann A. Evaluation of Subsurface Damage by Light Scattering Techniques. Appl Opt (2013) 52:6579–88. doi:10.1364/ao.52.006579
21. Frangulyan TS, Vasil’ev IP, Ghyngazov SA. Effect of Grinding and Subsequent thermal Annealing on Phase Composition of Subsurface Layers of Zirconia Ceramics. Ceramics Int (2018) 44:2501–3. doi:10.1016/j.ceramint.2017.10.234
22. Wang J, Maier RL. Surface Assessment of CaF_2 Deep-Ultraviolet and Vacuum-Ultraviolet Optical Components by the Quasi-Brewster Angle Technique. Appl Opt (2006) 45:5621–8. doi:10.1364/ao.45.005621
23. Ma B, Shen Z, He P, Ji Y, Sang T, Jiao H, et al. Subsurface Quality of Polished SiO2 Surface Evaluated by Quasi-Brewster Angle Technique. Optik (2011) 122:1418–22. doi:10.1016/j.ijleo.2010.09.019
24. Yao C, Huo S, Shen W, Sun Z, Hu X, Hu X, et al. Assessing the Quality of Polished Brittle Optical crystal Using Quasi-Brewster Angle Technique. Precision Eng (2021) 72:184–91. doi:10.1016/j.precisioneng.2021.04.019
25. Yin Y, Wang G, Jia Z, Mu W, Fu X, Zhang J, et al. Controllable and Directional Growth of Er:Lu2O3 Single Crystals by the Edge-Defined Film-Fed Technique. CrystEngComm (2020) 22:6569–73. doi:10.1039/d0ce00855a
26. Fung TH, Veeken T, Payne D, Veettil B, Polman A, Abbott M. Application and Validity of the Effective Medium Approximation to the Optical Properties of Nano-Textured Silicon Coated with a Dielectric Layer. Opt Express (2019) 27:38645–60. doi:10.1364/oe.27.038645
27. Medenbach O, Dettmar D, Shannon RD, Fischer RX, Yen WM. Refractive index and Optical Dispersion of Rare Earth Oxides Using a Small-Prism Technique. J Opt A: Pure Appl Opt (2001) 3:174–7. doi:10.1088/1464-4258/3/3/303
28. Lu A, Jin T, Liu Q, Guo Z, Qu M, Luo H, et al. Modeling and Prediction of Surface Topography and Surface Roughness in Dual-axis Wheel Polishing of Optical Glass. Int J Machine Tools Manufacture (2019) 137:13–29. doi:10.1016/j.ijmachtools.2018.10.001
Keywords: Lu2O3 single crystal, polishing, surface damage, subsurface damage, quasi-Brewster angle technique, ellipsometry
Citation: Yao C, Shen W, Hu X and Hu C (2021) Surface and Subsurface Quality Assessment of Polished Lu2O3 Single Crystal Using Quasi-Brewster Angle Technique. Front. Phys. 9:795639. doi: 10.3389/fphy.2021.795639
Received: 15 October 2021; Accepted: 16 November 2021;
Published: 20 December 2021.
Edited by:
Hao Jiang, Huazhong University of Science and Technology, ChinaReviewed by:
Haozhe Wang, Massachusetts Institute of Technology, United StatesAlexandra Pena Revellez, UPR2940 Institut Neel (NEEL), France
Copyright © 2021 Yao, Shen, Hu and Hu. This is an open-access article distributed under the terms of the Creative Commons Attribution License (CC BY). The use, distribution or reproduction in other forums is permitted, provided the original author(s) and the copyright owner(s) are credited and that the original publication in this journal is cited, in accordance with accepted academic practice. No use, distribution or reproduction is permitted which does not comply with these terms.
*Correspondence: Chunguang Hu, Y2dodUB0anUuZWR1LmNu
 Chengyuan Yao
 Wanfu Shen1,2
 Chunguang Hu