 Omar Narvaez
 Leo Svenningsson
 Maxime Yon
 Alejandra Sierra
 Daniel Topgaard
94% of researchers rate our articles as excellent or good
Learn more about the work of our research integrity team to safeguard the quality of each article we publish.
Find out more
ORIGINAL RESEARCH article
Front. Phys., 03 January 2022
Sec. Medical Physics and Imaging
Volume 9 - 2021 | https://doi.org/10.3389/fphy.2021.793966
This article is part of the Research TopicCapturing biological complexity and heterogeneity using multidimensional MRIView all 9 articles
Diverse approaches such as oscillating gradients, tensor-valued encoding, and diffusion-relaxation correlation have been used to study microstructure and heterogeneity in healthy and pathological biological tissues. Recently, acquisition schemes with free gradient waveforms exploring both the frequency-dependent and tensorial aspects of the encoding spectrum b(ω) have enabled estimation of nonparametric distributions of frequency-dependent diffusion tensors. These “D(ω)-distributions” allow investigation of restricted diffusion for each distinct component resolved in the diffusion tensor trace, anisotropy, and orientation dimensions. Likewise, multidimensional methods combining longitudinal and transverse relaxation rates, R1 and R2, with (ω-independent) D-distributions capitalize on the component resolution offered by the diffusion dimensions to investigate subtle differences in relaxation properties of sub-voxel water populations in the living human brain, for instance nerve fiber bundles with different orientations. By measurements on an ex vivo rat brain, we here demonstrate a “massively multidimensional” diffusion-relaxation correlation protocol joining all the approaches mentioned above. Images acquired as a function of the magnitude, normalized anisotropy, orientation, and frequency content of b(ω), as well as the repetition time and echo time, yield nonparametric D(ω)-R1-R2-distributions via a Monte Carlo data inversion algorithm. The obtained per-voxel distributions are converted to parameter maps commonly associated with conventional lower-dimensional methods as well as unique statistical descriptors reporting on the correlations between restriction, anisotropy, and relaxation.
Magnetic resonance imaging (MRI) allows non-invasive characterization of microstructure and local chemical composition in healthy and pathological biological tissues by monitoring the self-diffusion and nuclear magnetic relaxation properties of water molecules [1–4]. While the apparent diffusion coefficient D reports on cell density and membrane permeability [5], longitudinal and transverse relaxation rates, R1 and R2(*), are sensitive to chemical exchange of protons between water and hydroxyl and amine groups on metabolites and macromolecules [6, 7], molecular exchange between compartments [8], magnetization transfer/cross relaxation between exchangeable and non-exchangeable protons [9], and paramagnetic relaxation from iron or added contrast agents [8, 10]. Especially for studies of the nervous system, the diffusion is often expressed in terms of a diffusion tensor D related to cell shapes and orientations [11]. White matter (WM), gray matter (GM), and cerebrospinal fluid (CSF) all have characteristic diffusion [12] and relaxation [13, 14] properties that determine how the MRI signal varies as a function of acquisition variables such as b-value [15, 16], repetition time τR, and echo time τE.
A major challenge of studying brain tissue microstructure lies in the prevalence of intra-voxel heterogeneity in terms of not only the proportions of WM, GM, and CSF, but also the distribution of cell types, sizes, densities, orientations, membrane permeabilities, and chemical compositions. This heterogeneity gives rise to corresponding distributions of water populations with varying diffusion and relaxation properties that contribute to the total signal response from a given voxel. Comprehensive exploration of the multidimensional space defined by the acquisition variables in the MRI measurements is essential for disentangling the contributions from the distinct water populations [17]. Along these lines, methods such as diffusion-relaxation correlation [18] and tensor-valued encoding [19] have been used to address intra-voxel heterogeneity, whereas oscillating gradients [20] have enabled studies of microstructural length-scales via the frequency-dependence of the diffusion properties. A brief overview of these approaches is presented below to highlight their relevance and benefits that each provide to study the tissue microstructure.
Diffusion-relaxation correlation nuclear magnetic resonance (NMR) has for decades been widely applied to heterogeneous porous media [21–23] and has more recently been integrated with MRI [24, 25], giving spatially resolved nonparametric distributions [26] of various combinations of D, R1, and R2(*). Recent MRI examples include 2D D-R2 of ex vivo mouse spinal cord [27], 2D D-R2* of in vivo human placenta [28], 2D D-R2 of ex vivo human prostate [29], and combined 2D D-R1, 2D D-R2, and 2D R1-R2 of ex vivo ferret spinal cord [30] and ex vivo human brain [31]. All these studies were limited to analysis in terms of scalar D, merging diverse properties such as short-time diffusivity, restriction, anisotropy, orientation, and flow into a single metric which is appropriate for quantifying diffusion in isotropic liquids but lacks specificity for anisotropic biological tissues with structural features on the micrometer length-scale [32].
Multidimensional diffusion MRI [33] builds on selective signal encoding strategies from multidimensional solid-state NMR spectroscopy [34] to separate and correlate the diverse aspects of translational motion. In particular, diffusion versions of the classical solid-state NMR techniques magic-angle spinning [35], magic-angle hopping [36], and variable-angle spinning [37] yield separation [38, 39] and correlation [40] of the isotropic and anisotropic contributions to the observed diffusivities. Independently of the exact details of the diffusion-encoding gradients, the relevant acquisition variables are summarized in the well-known b-matrix [11] or b-tensor [41] b, often assumed to be axisymmetric and parameterized with its trace b, normalized anisotropy bΔ, and orientation (Θ,Φ) [39]. When combined with the likewise well-known concept of D-distributions [42, 43], tensor-valued encoding enables model-free characterization of the voxel content in terms of nonparametric 4D D-distributions with the dimensions of isotropic diffusivity Diso, squared normalized anisotropy DΔ2, and orientation (θ,ϕ) [44]. The distribution means E[Diso] and E[DΔ2] carry similar microstructural information as conventional mean diffusivity [11] and microscopic anisotropy measures [45–49]. For in vivo mouse brain, the distinct (Diso,DΔ2)-coordinates of components assigned to WM, GM, and CSF can be utilized to define “bins” in the 2D Diso-DΔ2 projection for calculating nominally tissue-specific signal fractions and diffusion metrics [50] analogously to earlier binning of 1D R2-distributions to estimate myelin water fractions [39] and 2D “spectral regions of interest” capturing diverse tissue types in various 2D correlation experiments [27–31]. Augmenting conventional diffusion-relaxation correlation with tensor-valued encoding gives signal in a 6D acquisition space b-τR-τE which upon inversion yields nonparametric 6D D-R1-R2 distributions [51]. Recent examples of the approach include 5D D-R1 [52], 5D D-R2 [53, 54], and 6D D-R1-R2 [55] of in vivo human brain where subtle differences in R1 or R2 can be detected provided the components are resolved in the 2D Diso-DΔ2 or θ-ϕ projections, the latter being utilized for model-free estimation of bundle-specific R1 or R2 in areas with crossing fibers [52, 54].
Advanced diffusion encoding schemes such as oscillating gradients give access to the diffusion spectrum D(ω) [56, 57] for investigating diffusion at the length-scales of subcellular structures [20]. The time/frequency-dependence has been studied in porous media with NMR [57–59] as well as in rodent [60–62] and in vivo human brain [63, 64] with MRI. Particularly, oscillating gradients measurements provide a distinctive increased image contrast in mouse brain in the cerebellum, dentate gyrus, and hippocampus, which correlates with the nuclear volume fractions in regions containing densely packed cells [61]. Studies of WM and GM in in vivo mouse and human brain have shown the potential of using the frequency-dependence to characterize biological tissues at cellular to sub-cellular scales [62–64]. Recently, modulated gradient waveforms combining elements of both oscillating gradients and variable-angle spinning [65] have enabled convenient exploration of both the frequency-dependent and tensorial aspect of the tensor-valued encoding spectrum b(ω) [66], making it possible to study the frequency-dependence of each distinct component resolved in a nonparametric D(ω)-distribution [67].
Here we merge all approaches mentioned above into “massively multidimensional” diffusion-relaxation correlation MRI with signal acquired in an effectively 7D space b(ω)-τR-τE and data inversion into nonparametric D(ω)-R1-R2 distributions giving the benefits of the lower-dimensional methods in a joint acquisition and analysis framework. Measurements on ex vivo rat brain are used to illustrate the vast amount of per-voxel information available for detailed description of brain tissue microstructure and heterogeneity.
Combining our recent nonparametric D(ω)-distributions [67] with previous (ω-independent) D-R1-R2-distributions [51], we here approximate the b(ω)-τR-τE encoded signal S as a sum of contributions from components i characterized by their statistical weight wi, tensor-valued diffusion spectra Di(ω), and longitudinal and transverse relaxation rates R1,i and R2,i according to
where the colon denotes a generalized scalar product [68] and the sum of wi yields the non-weighted signal S0, nominally proportional to the proton density, via
As described in detail in Ref. [67], inversion of Eq. 1 is rendered tractable by approximating Di(ω) as axisymmetric Lorentzians parameterized by the zero-frequency axial and radial diffusivities DA,i and DR,i, orientation (θi,ϕi), high-frequency isotropic diffusivity D0,i, and axial and radial transition frequencies ΓA,i and ΓR,i, giving
where R(θi,ϕi) is a rotation matrix, and
Although the data inversion yields a set of components described with the parameter set [DA,i,DR,i,θi,ϕi,D0,i,ΓA,i,ΓR,i,R1,i,R2,i], it is convenient to express the diffusion dimensions in terms of the ω-dependent isotropic diffusivity Diso,i(ω) and normalized diffusion anisotropy [69] DΔ,i(ω) via
and
where DA,i(ω) and DR,i(ω) are given by Eq. 4.
The diffusion-encoding magnetic field gradient g(t) with duration τ gives b(ω) via
where γ is the gyromagnetic ratio, and
While the full tensorial and ω-dependent form of b(ω) is used in our data processing based on Eq. 1, it is instructive to extract some more familiar metrics to characterize the properties of the diffusion encoding. The conventional b-matrix [70] b and dephasing power spectrum [56] b(ω) are obtained from b(ω) through
and
These give the b-value via
or
The average spectral content of the diffusion encoding is captured by the centroid frequency [71] ωcent written as
The “shape” of the b-matrix may be reported in terms of the normalized anisotropy bΔ given by [39]
where bXX, bYY, and bZZ are the eigenvalues of b ordered according to the convention |bZZ–b/3| > |bXX–b/3| > |bYY–b/3|. The polar and azimuthal angles Θ and Φ give the lab-frame orientation of the eigenvector corresponding to the bZZ eigenvalue. The key properties of the diffusion encoding spectrum b(ω) may thus be summarized with the parameters b, Θ, and Φ, which are identical to the b-value and b-vector in conventional DTI, as well as the centroid frequency ωcent and normalized anisotropy bΔ from oscillating gradient [20] and tensor-valued [19] encoding.
A healthy adult rat Sprague-Dawley (Harlan Netherlands B.V.) was intracardially perfused with 0.9% saline followed by 4% paraformaldehyde (PFA). The brain was carefully extracted from the skull and stored in 4% PFA solution at 4°C. The procedure was approved by the Animal Committee of the Provincial Government of Southern Finland in accordance with the guidelines established by the European Union Directives 2010/63/EU. Before imaging, the brain was sagittally sectioned by the midline in left and right hemispheres and placed in 0.1 M phosphate buffer saline (PBS) solution containing 50 µl/10 ml of gadoteric acid (Dotarem 0.5 M; Guerbet, and France) 24 h before scanning. MRI was performed on the right hemisphere immersed in perfluoropolyether (Galden; TMC Industries, United States) in a 10 mm NMR tube at 20°C room temperature.
For comparison between histology and MRI data, representative sections from a healthy adult rat were stained with gold chloride and Nissl [72]. High resolution photomicrographs were taken using a light microscope (Zeiss Axio Imager2) equipped with a motorized stage and a digital camera (Zeiss Axiocam color 506).
The multidimensional diffusion-relaxation data set was acquired on a Bruker Avance-III HD 11.7 T spectrometer equipped with a MIC-5 probe giving 3 T/m maximum gradient amplitude on-axis. The images have an in-plane spatial resolution of 80 × 80 μm2 and 250 µm slice thickness with a 119 × 119 × 1 matrix size localized approximately at −3.3 mm from bregma. The data set was obtained using Bruker’s multi-slice multi-echo (MSME) sequence customized for diffusion encoding with general gradient waveforms. The diffusion gradients are derived from the variable-angle modification of magic-angle spinning of the q-vector [73] using two symmetric self-refocusing gradient waveforms with 8 ms duration on each side of the refocusing radiofrequency pulse. Images were acquired at varying b-value (0.037–5.4.109 sm−2), centroid frequency ωcent/2π (50–150 Hz), normalized anisotropy bΔ (−0.5–1), orientation (Θ,Φ), repetition time τR (80–600 ms), and echo time τE (9–38 ms) according to the scheme in Figure 1. The calculation of b(ω) with Eqs 7 and 8 included the dedicated diffusion gradients as well as the read and slice gradients from the center of the excitation pulse to the time point of the spin echo. The shortest values of τE were reached by omitting the diffusion gradients. The values of b, ωcent, bΔ, Θ, and Φ shown in Figure 1 were obtained from the calculated b(ω) via Eqs 9–14. Acquisition of 809 images, each of which requiring 119 separate excitations to traverse k-space, resulted in a total measurement time of 20 h. After image reconstruction in Bruker’s ParaVision 6.0.1, the data was preprocessed with MRtrix3 [74] software for denoising based on random matrix theory [75] and Matlab (Natick, Massachusetts: The MathWorks Inc.) was used for further analysis with the md-dmri Matlab toolbox [76]. Blender 2.92 (Amsterdam, Netherlands: Blender Foundation) was used for the ODF visualization.
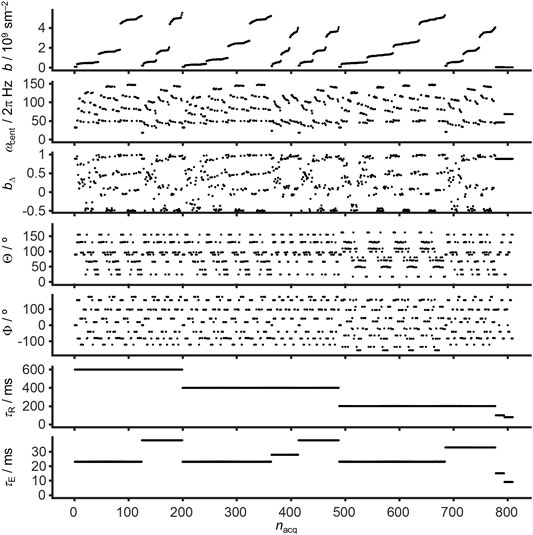
FIGURE 1. Example acquisition scheme for massively multidimensional diffusion-relaxation correlation MRI. Free gradient waveforms combining elements of conventional DTI with oscillating gradient and tensor-valued encoding are used to explore the effectively 5D acquisition space spanned by the trace b, orientation (Θ,Φ), centroid frequency ωcent, and normalized anisotropy bΔ of the tensor-valued encoding spectrum b(ω). Variation of the repetition time τR and echo time τE gives access to two additional dimensions, resulting in a 7D acquisition. The acquisition point index nacq is sorted according to decreasing τR, increasing τE, and increasing b.
The D(ω)-R1-R2 distributions, expressed in the space of [DA,DR,θ,ϕ,D0,ΓA,ΓR,R1,R2], were obtained by Monte Carlo inversion [77] as described in detail in Ref. [51]. The inversion algorithm has previously been applied to various diffusion and relaxation correlation measurements including [DA,DR] [40], [DA,DR,θ,ϕ] [44, 50], [DA,DR,θ,ϕ,R1] [52], [DA,DR,θ,ϕ,R2] [53, 54], [DA,DR,θ,ϕ,R1,R2] [51], and [DA,DR,θ,ϕ,D0,ΓA,ΓR] [67]. Here, the inversion was performed with the limits 5⋅10−12 m2s−1 < D0/A/R < 5⋅10−9 m2s−1, 0.1 s−1 < ΓA/R < 105 s−1, 0.2 s−1 < R1 < 20 s−1, and 2 s−1 < R2 < 200 s−1, as well as 20 steps of proliferation, 20 steps of mutation/extinction, 200 input components per step of proliferation and mutation/extinction, 10 output components, and bootstrapping by 100 repetitions using random sampling with replacement. The ranges of D0/A/R, R1, and R2 were selected to be consistent with the values of b, τR, and τE in the acquisition protocol, while the range of ΓA/R was deliberately chosen to extend far beyond the range of ωcent in order to allow for components without ω-dependence within the investigated frequency window. For every voxel, the Monte Carlo inversion outputs an ensemble of 100 independent solutions, each of which comprising weights w and coordinates [DA,DR,θ,ϕ,D0,ΓA,ΓR,R1,R2] for 10 components within the pseudo-randomly sampled analysis space. As opposed to most nonparametric inversion methods in diffusion and relaxation MRI, the coordinates are only constrained by the outer boundaries of the analysis space, but not to a pre-defined multidimensional grid within this space. Likewise, the Monte Carlo inversion algorithm does not include penalty terms aiming to promote smoothness in the analysis or image spaces. Data inversion for 100 repetitions of 8,000 voxels required in total 25 h of processing time on a 3.6 GHz 8-core CPU, corresponding to on average 0.9 s per voxel, repetition, and core. All metrics described below were calculated for each of the 100 solutions per voxel, and the values displayed in maps, projections, and ODFs were obtained as medians over the individual solutions.
With inspiration from the recent concept of “dynamics detectors” to extract model-independent information about rotational diffusion from NMR relaxation dispersion data [78], the diffusion dimensions of the D(ω)-R1-R2 distributions in the primary analysis space [DA,DR,θ,ϕ,D0,ΓA,ΓR,R1,R2] were evaluated with Eq. 4 at selected values of ω within the narrow 50–150 Hz window actually probed by the gradient waveforms, giving a set of ω-dependent distribution in the [DA(ω),DR(ω),θ,ϕ,R1,R2] space. For each value of ω, these results can be visualized as previous ω-independent distributions [44, 50, 52–54] by projecting DA(ω) and DR(ω) to the dimensions of isotropic diffusivity Diso(ω) and squared normalized anisotropy DΔ2(ω), via Eqs 5 and 6, as well as the lab-frame diagonal elements Dxx(ω), Dyy(ω), and Dzz(ω), and subsequently converting to means E[x], variances V[x], and covariances C[x,y] over relevant dimensions and sub-divisions (“bins”) of the distribution space. The diagonal elements and the maximum eigenvalue D33 were used to generate the directionally-encoded color map. Following conventions often used to display results from oscillating gradient encoding [20, 61, 71, 79–81], the effects of restricted diffusion were quantified by a finite difference approximation of the rate of change of the diffusivity metrics with frequency within the investigated window, for instance
As in previous in vivo studies [50], results for voxels known from anatomy to contain pure WM, GM, or PBS were used to define three bins in the 2D Diso-DΔ2 plane. Here we used the following bin limits: bin1, Diso < 1·10−9 m2s−1 and DΔ2 > 0.25; bin2, Diso < 1·10−9 m2s−1 and DΔ2 < 0.25; and bin3, Diso > 1·10−9 m2s−1 as illustrated in Figure 2D. On account of the effects of low temperature and tissue fixation, the Diso border between bin1/bin2 and bin3 was set to 1·10−9 m2s−1 rather than the value 2.5 10−9 m2s−1 often used in vivo [50]. While the selected bins are mainly related to WM, GM, and CSF/PBS for healthy brain, the binning is less straightforward in the presence of various pathologies such as tumors or edema [82] and we prefer to use the noncommittal labels bin1, bin2, and bin3 rather than potentially misleading anatomical terms. The per-bin signal fractions (fbin1,fbin2,fbin3) were calculated and visualized with RGB color coding (Figure 2D).
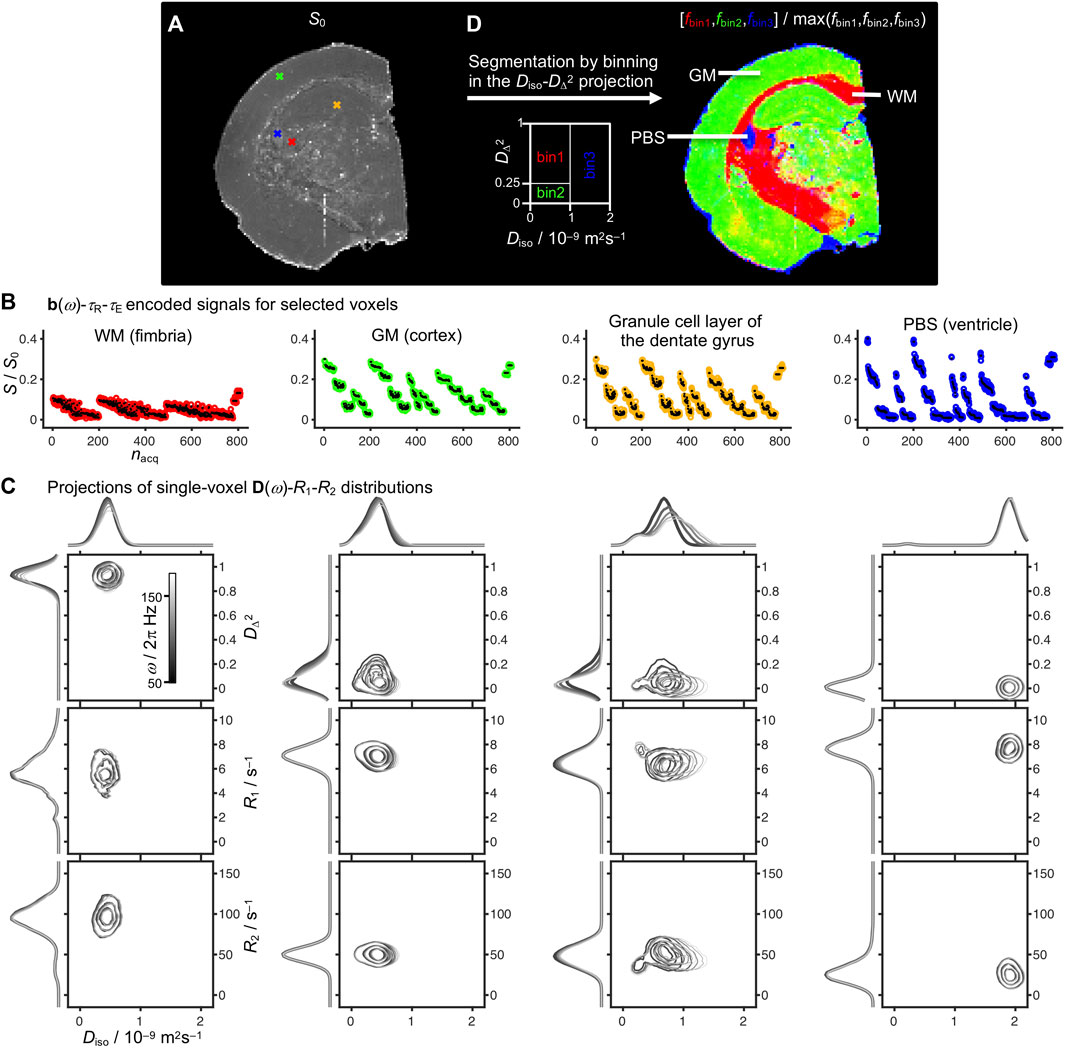
FIGURE 2. Experimental results for representative voxels in an ex vivo rat brain and tissue segmentation by binning. (A) S0 map with crosses indicating single voxels representative for white matter (WM) in the fimbria (red), gray matter (GM) in the cortex (green), the granule cell layer of the dentate gyrus (orange), and phosphate buffer saline (PBS) in the ventricle (blue). (B) Single-voxel signals S as a function of acquisition index nacq according to the 7D b(ω)-τR-τE scheme in Figure 1 (colored circles: experimental; black dots: back-calculated from the distributions). The values of S0 correspond to the signals extrapolated to b = 0, τR = ∞, and τE = 0. (C) D(ω)-R1-R2 distributions for each of the selected voxels projected onto the 2D Diso-DΔ2, Diso-R1, and Diso-R2 planes for five frequencies in the range ω/2π = 50–150 Hz as indicated with the linear gray scale of the contour lines. (D) Tissue segmentation by binning in the 2D Diso-DΔ2 projection at the frequency ω/2π = 50 Hz, resulting in per-bin signal fractions fbin1 (red), fbin2 (green), and fbin3 (blue) aiming to capture the spatial distributions of WM, GM, and PBS.
Single-voxel D(ω)-R1-R2 distributions were visualized by projecting and mapping the weights of the discrete components onto 64 × 64 meshes in the 2D Diso-DΔ2, Diso-R1, and Diso-R2 planes using 3 × 3 grid points Gaussian kernel for five linearly spaced values of ω/2π in the 50–150 Hz range. Correspondingly, orientation distribution functions (ODFs) were generated by projecting the weights and metrics of the bin1 components onto a 1,000 points spherical mesh with a 10° spherical Gaussian kernel [83, 84]. 3D models of the ODF projections were exported in “.wrl” format and processed in Blender (Figure 6C).
Figure 2 displays signal responses S[b(ω)-τR-τE] and the corresponding nonparametric D(ω)-R1-R2 distributions for representative voxels containing WM (fimbria), GM (cortex), and PBS (ventricle), as well as a voxel in the granule cell layer of the dentate gyrus, which structurally is a region with compact cell bodies [62]. The S0 map in Figure 2A is obtained from the component weights wi by Eq. 2 and corresponds to the signal S extrapolated to b = 0, τR = ∞, and τE = 0, and thus shows lower anatomical contrast than conventional S0 maps from DTI which also includes R1- and R2-weighting. The quality of the fits can be discerned from the plots in Figure 2B of the measured signals (circles) and the corresponding signals (black dots) back-calculated from the distributions, giving standard deviations of the fit error (Smeasured–Sfit)/S0 between 0.5 and 1% for the four voxels. These numbers can be translated to the rather modest signal-to-noise ratios of approximately 20 for WM and 40 for PBS for the maximum measured signals at finite τR and τE.
The per-voxel D(ω)-R1-R2 distributions are visualized in Figure 2C as projections onto the 2D Diso-DΔ2, Diso-R1, and Diso-R2 planes for five frequencies ω/2π between 50 and 150 Hz. The well-known differences in tissue microstructure are most clearly manifested in the 2D Diso-DΔ2 projections, showing low Diso and high DΔ2 in WM; low values of both Diso and DΔ2 in GM; intermediate Diso and low DΔ2 in the granule cell layer; and high Diso and low DΔ2 in PBS. Additionally, the granule cell layer features the most pronounced ω-dependence. The values of R1 increase slightly in the sequence WM < GM < PBS, presumably reflecting the accessibility to the added contrast agent rather than any intrinsic tissue property. Conversely, the values of R2 increase markedly in the order PBS < GM < WM more in line with in vivo observations. The addition of contrast agents in ex vivo diffusion MRI studies is a common practice to enable reduction of τR, and thus increase the number of acquisitions while minimizing the total scanning time and experimental costs. Particularly, the contrast agent used in this study is not expected to penetrate intact cell membranes [85].
Although the WM, GM, and PBS give distinct signatures in both the 2D Diso-DΔ2 and Diso-R2 projections, we here for convenience choose the former representation to define three bins for tissue segmentation as illustrated in Figure 2D. The per-bin signal fractions, fbin1, fbin2, and fbin3, evaluated at ω/2π = 50 Hz effectively distinguishes between WM (red), GM (green), and PBS (blue). The color scale of the bin fractions is continuous; hence voxels with contributions of multiple tissue types or PBS are displayed as mixed colors, e.g., WM + GM (yellow), WM + PBS (purple), and GM + PBS (turquoise).
Figure 3 shows a collection of parameter maps derived from the per-voxel D(ω)-R1-R2 distributions. While each parameter has been explained in detail in previous lower-dimensional studies [52, 53, 67], we here summarize them briefly to illustrate the vast amount of information that can be extracted for each voxel and provide an intuitive and simple interpretation of the maps. For completeness, Figure 3A repeats the S0 and fractions maps from Figure 2. The maps in Figure 3B display the per-voxel means E[x], variances V[x], and covariances C[x,y] for Diso, DΔ2, R1, and R2 evaluated at ω/2π = 50 Hz. The means E[Diso], E[R1], and E[R2] correspond to conventional mean diffusivity [11] and quantitative R1 = 1/T1 and R2 = 1/T2 [4], while E[DΔ2] is analogous to earlier metrics quantifying microscopic diffusion anisotropy [45–49]. The E[Diso] map highlights regions with free water, such as PBS in the ventricle, while providing limited contrast between WM and GM. Conversely, the E[DΔ2] map reveals WM while just barely distinguishing between the low values of GM and PBS. In the E[R1] and E[R2] maps of this specimen with high concentration of added contrast agent, GM and PBS show higher E[R1] and lower E[R2] than WM in agreement with the single-voxel distributions in Figure 2C.
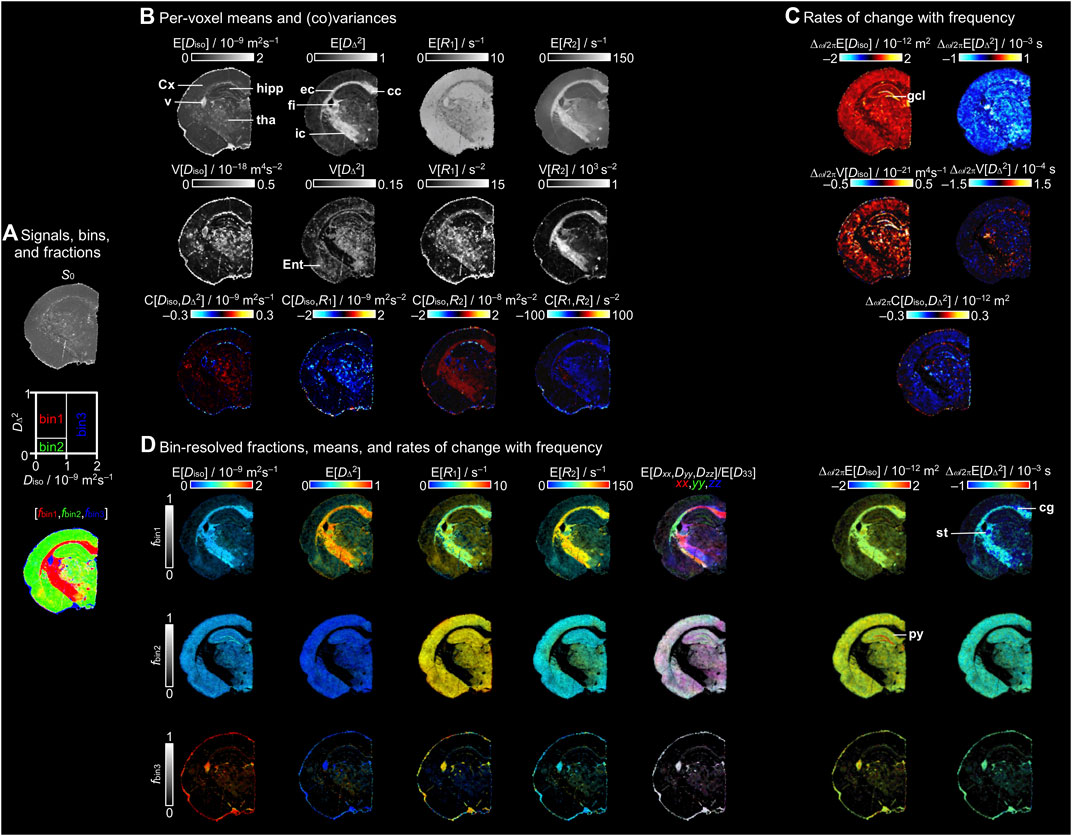
FIGURE 3. Parameter maps derived from the per-voxel D(ω)-R1-R2 distributions. (A) S0 map displayed in gray scale, diagram with the division of the 2D Diso-DΔ2 projection into three bins (bin1,bin2,bin3), and the resulting signal fractions (fbin1,fbin2,fbin3) coded into RGB color. (B) Per-voxel means E[x], variances V[x], and covariances C[x,y] for the Diso, DΔ2, R1, and R2 dimensions at a selected encoding frequency ω/2π = 50 Hz. (C) Parameter maps of the rate of change with frequency Δω/2π of the per-voxel means, variances, and covariance of Diso and DΔ2. (D) Bin-resolved maps of E[x] and Δω/2πE[x]. The brightness and color scales represent, respectively, the signal fractions and the values of each parameter. Directionally-encoded color (DEC) maps are obtained from the lab-frame diagonal values [Dxx,Dyy,Dzz] normalized by the maximum eigenvalue D33. Labeled lines indicate selected anatomical structures mentioned in the text. Abbreviations: cc, corpus callosum; cg, cingulum; Cx, cortex; ec, external capsule; Ent, entorhinal cortex; fi, fimbria; gcl, granule cell layer; hipp, hippocampus; ic, internal capsule; py, pyramidal cell layer; st, stria terminalis; tha, thalamus; and v, ventricle.
The variance V[x] and covariance C[x,y] maps in Figure 3B report on various aspects of intravoxel heterogeneity and highlight voxels comprising multiple water populations with different diffusion and/or relaxation properties. In previous studies, the V[Diso] parameter has shown elevated values for voxels containing intra- and extracellular water populations separated by the unusually impermeable cell membranes found in the commercial strain of baker’s yeast [47], and has been correlated with cell density heterogeneity in brain tumors [86]. In healthy human brain, the values are high primarily in voxels containing both CSF (high Diso) and WM or GM (both having low Diso) [52, 53]. The V[DΔ2] parameter yields high values in voxels with multiple water populations having distinctly different anisotropy, for instance free water and liquid crystal [44] or CSF and WM [52, 53]. Similarly to V[Diso], in healthy human brain V[R1] and V[R2] are highest in voxels with both CSF (low R1 and R2) and WM or GM (high R1 and R2) [52, 53]. In Figure 3B non-zero values of V[Diso] are found in particular for voxels comprising both PBS and WM or GM, but also in the thalamus and ventricle. The V[DΔ2] values were high in regions with contributions of multiple tissue types, such as in the thalamus or entorhinal cortex and voxels with equal amounts of WM and PBS or GM, while the main WM tracts, such as the corpus callosum, fimbria, and internal capsule, display values close to zero. The WM, thalamus, and ventricle exhibit high values of V[R1] compared to cortex and hippocampus, while high V[R2] is mainly found for WM. Non-zero covariance C[x,y] requires that both variances V[x] and V[y] are non-zero and the values of x and y are correlated, for instance in voxels containing partial volumes of both WM (low Diso and high DΔ2) and CSF (high Diso and low DΔ2) [53]. In Figure 3B, positive C[Diso,R2] and negative C[R1,R2] are observed for WM.
The frequency-dependence is reported in Figure 3C in terms of the rate of change with frequency within the investigated window 50–150 Hz for the per-voxel means, variances, and covariance of Diso and DΔ2. In the Δω/2πE[Diso] map, the highest positive values are found as a distinct band following the granule cell layer of the dentate gyrus, while smaller positive values are mainly distributed along GM, and values close to zero are observed for WM. These findings are consistent with the qualitative observations in the selected representative voxels of the ω-dependent distributions in Figure 2C. Conversely, Δω/2πE[DΔ2] shows negative values throughout the GM. Similarly to Δω/2πE[Diso], the values of Δω/2πV[Diso] are positive along the GM and the highest values are found in the granule cell layer. The values of Δω/2πC[Diso,DΔ2] are negative in the GM and the lowest values occur in the granule cell layer.
Figure 3D shows bin-resolved maps with the means of the relevant properties. Each map combines two orthogonal scales: the brightness intensity shows the relative signal fraction and the color scale represents the value of the property of interest. In the bin-resolved E[Diso] maps, we observe that in bin1 (WM) and bin2 (GM) the values are characteristically low. Conversely, bin3 that corresponds to PBS shows high E[Diso] due to free diffusion. Regarding the bin1 E[DΔ2] map, the main WM tracts, such as the corpus callosum, fimbria, or external capsule, display values approaching the theoretical maximum of 1. Besides major WM tracts, other brain regions, such as the thalamus, hippocampus, or entorhinal cortex, present values between ∼0.25 and ∼0.5. These intermediate values may correspond to the existence of myelinated axons and bundles that contribute to the anisotropy. For bin2 and bin3, showing the contributions of GM in regions such as the cortex or hippocampus and PBS inside the ventricle, the E[DΔ2] values are close to zero corresponding to isotropic diffusion. In the per-bin relaxation rates, we observe higher values of E[R1] in GM and PBS, ∼7 s−1, than in WM with values of ∼6 s−1; however, in E[R2], we find that the main WM tracts show higher values than GM and PBS. As discussed above in relation to Figure 2C, the values of E[R1] in this study are probably dominated by the paramagnetic relaxation from the added contrast agent. With the information about orientation (θ,ϕ) expressed in terms of E[Dxx,Dyy,Dzz]/E[D33], we calculated the per-voxel principal orientation of the tensors and displayed as directionally-encoded color (DEC) maps for each of the bins. For bin1, the corpus callosum shows a medio-lateral main orientation while the external capsule fibers follow the characteristic dorso-ventral orientation. The last two columns of Figure 3D shows the bin-resolved values of Δω/2πE[Diso] and Δω/2πE[DΔ2], which provide a more precise assignment of the tissue type contributing to the per-voxel values. For bin1, the major WM tracts display Δω/2πE[Diso] and Δω/2πE[DΔ2] values near zero with slightly elevated Δω/2πE[Diso] and negative Δω/2πE[DΔ2] in the stria terminalis and cingulum. For bin2, the granule cell layer of the dentate gyrus shows the highest values of Δω/2πE[Diso]. Also for the pyramidal cell layer the values are slightly elevated compared to the ones for the cortex.
The histograms in Figure 4 summarize the numerical values of selected parameters from the maps in Figure 3 and highlight representative values for WM, GM, PBS, and some additional anatomical structures. In general, the peaks of the bin-resolved histograms coincide with the dominant values for WM, GM, and PBS as obtained by direct inspection of the maps. However, for both bin1 and bin3 secondary features appear, in particular for E[R1] and E[R2], as a result of low but non-zero values of fbin1 and fbin3 in large volumes of GM. Conversely, the granule cell layer and stria terminalis have unique values of Δω/2πE[Diso] and Δω/2πE[DΔ2] that are readily visible in the maps but occur only in a few voxels and thus do not show up in the histograms.
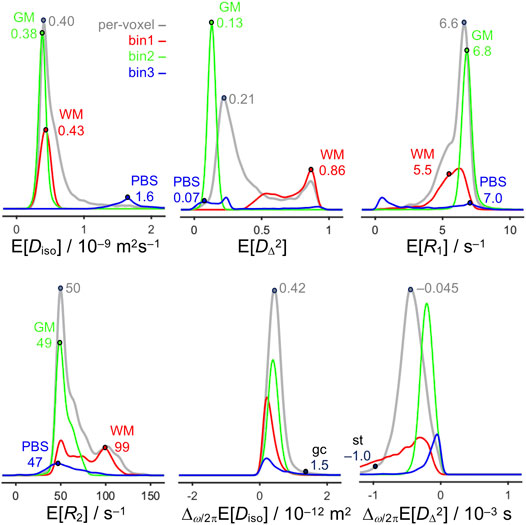
FIGURE 4. Histograms of quantitative parameters across all voxels in the image. The histograms are obtained from the per-voxel (gray) and bin-resolved (red, green, and blue) maps of E[Diso], E[DΔ2], E[R1], E[R2], Δω/2πE[Diso], and Δω/2πE[DΔ2] in Figure 3 and include weighting by S0, fbin1, fbin2, and fbin3. The abscissas cover the same ranges as the scale bars in Figure 3. Labeled points highlight representative values for WM in the corpus callosum, external capsule, and fimbria, GM in the cortex, and PBS in the ventricle, as well as the granule cell layer (gcl), and stria terminalis (st).
In Figure 5A, bin1-resolved E[R2], E[DΔ2], and E[Dxx,Dyy,Dzz]/E[D33] maps are compared with a histological section stained with gold chloride for myelin. As observed in the closer view of the histological section, the fimbria, external capsule, and internal capsule have the highest staining due the high density of myelinated axons, while the cortex gives low staining. With the histological comparison, we demonstrate that fbin1 adequately corresponds with the major contrast in the myelin-stained section. As mentioned in Figure 3D the highest values of E[DΔ2] and E[R2] are found in the main WM tracts. In the closer view of the myelin staining (Figure 5A), most of the fibers in the external capsule follow a dorso-ventral orientation and other fibers continue towards the external capsule. These orientations are observed in the E[Dxx,Dyy,Dzz]/E[D33] map, where in green are the external capsule dorso-ventral fibers and in yellow/red the dorso-ventral/medio-lateral fibers towards the internal capsule.
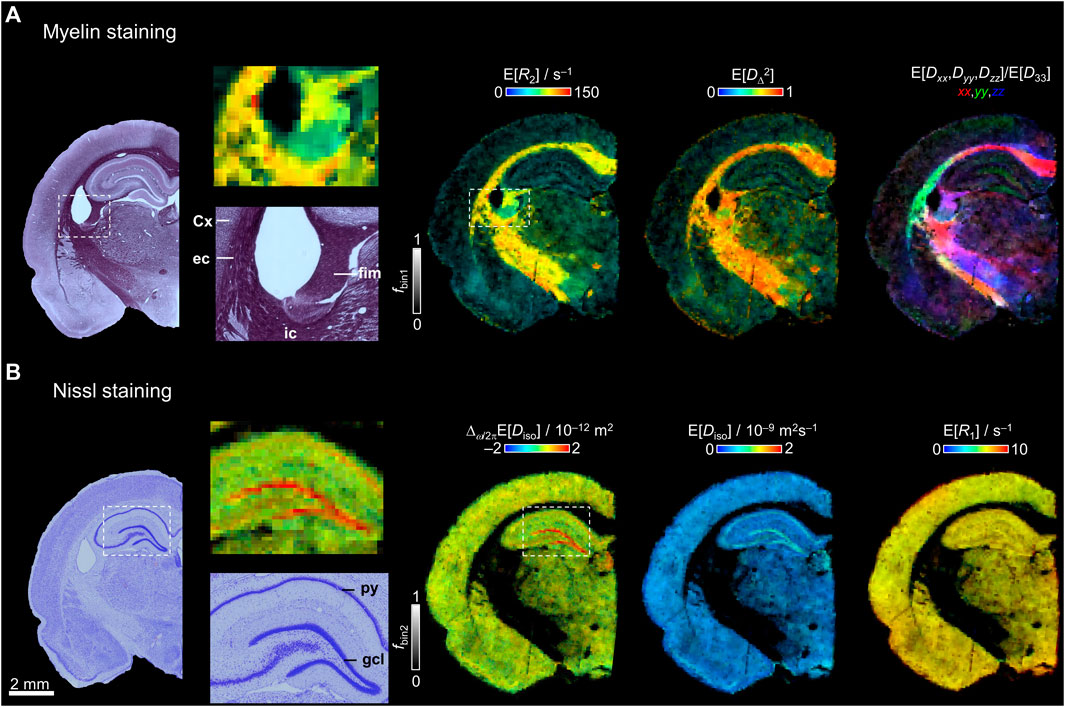
FIGURE 5. Comparison between histology and selected parameter maps. (A) Myelin-stained section and bin1-resolved E[R2], E[DΔ2], and E[Dxx,Dyy,Dzz]/ E[D33] maps with brightness and color-coding as in Figure 3D. The darker intensities in the myelin staining correspond to the main white matter tracts and the lighter regions have lower density of myelin. A closer view to the myelin staining and E[R2] is displayed showing the fimbria (fim), cortex (Cx), external capsule (ec), and internal capsule (ic). (B) Nissl-stained section and bin2-resolved Δω/2πE[Diso], E[Diso], and E[R1] maps. A closer view of the hippocampus and dentate gyrus in the Nissl staining and the Δω/2πE[Diso] map displays the granule cell layer (gcl) and pyramidal cell layer (py).
The bin2-resolved maps are compared with a Nissl-stained section to assess the cytoarchitecture of the brain tissue in Figure 5B. The closer view of the hippocampal proper reveal the high cell density in the granule and pyramidal cell layers. The restriction map Δω/2πE[Diso] follows the same contrast as the histological section where the highest values are in the granule and pyramidal cell layers. The Nissl-stained section displays the presence of cells along the whole brain and correlates with fbin2 as can be observed with the example maps E[Diso] and E[R1].
Considering the relevance of extracting per-bundle information within a voxel in WM, we generated nonparametric ODFs from the bin1 components. The resulting ODF lobes correspond to orientation histograms as in Ref. [87]. Figure 6A displays ODFs color-coded for the E[DΔ2] parameter overlaid on a synthetized R2-weighted image at τE = 20 ms for anatomical reference. The largest lobes correspond to the major WM tracts and a closer look in the joint of the external capsule with the internal capsule shows a crossing fibers region. ODFs color-coded for the E[Diso], E[R1], E[R2], E[Dxx,Dyy,Dzz]/E[D33], Δω/2πE[Diso], and Δω/2πE[DΔ2] parameters were also calculated and are displayed in Figure 6B. In the conventional DEC ODFs, the fiber population that follow a dorso-ventral orientation (external capsule) can be observed in green and a second population that contains rostro-caudal fibers with mixed trajectory of the medio-lateral orientations (towards internal capsule) is displayed in a mixture of red and blue colors. The magnifications of the crossing fibers ODFs reveal that in this case the parameter values are nearly identical for the two fiber populations. Corresponding in vivo human brain measurements with lower-dimensional methods have shown that for crossing fibers with distinctly different properties, the rich information in the nonparametric distributions allows quantification of not only per-bin, but also per-bundle values of E[R1] [52] and E[R2] [54].
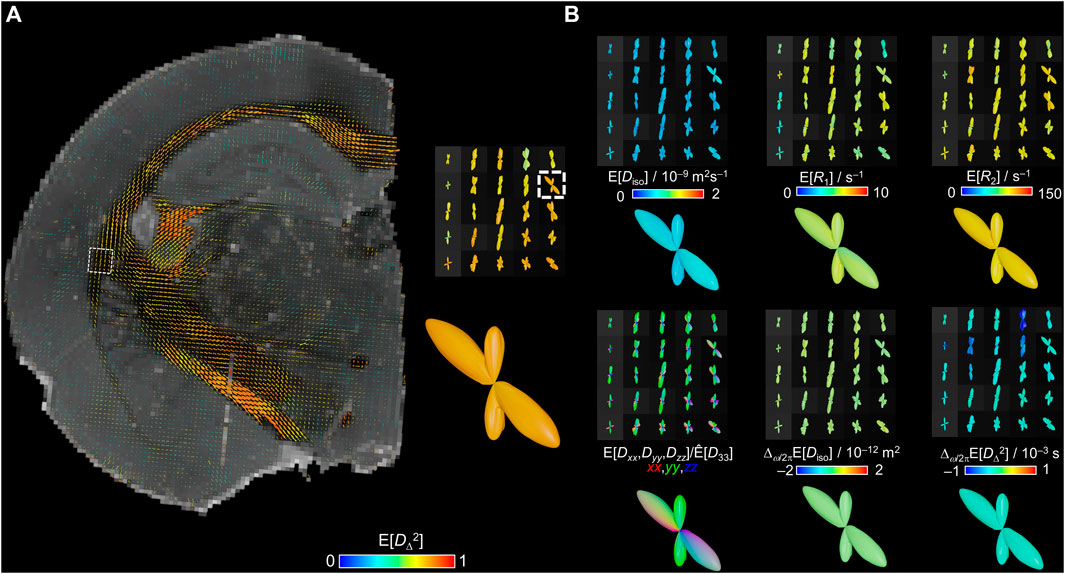
FIGURE 6. Per-voxel ODFs of the bin1 fraction. The ODFs are obtained from the per-voxel D(ω)-R1-R2 distributions by mapping the bin1-component weights w, orientations (θ,ϕ), and parameters Diso, DΔ2, R1, R2, Dxx, Dyy, and Dzz onto a spherical mesh using a 10° spherical Gaussian convolution kernel for two frequencies ω/2π = 50 and 150 Hz. ODF radii are given by the orientation-resolved mean weights while the colors derive from the orientation-resolved mean parameters using the same color scheme as in the Figure 3D. (A) E[DΔ2]-colored ODFs displayed over a synthetized R2-weighted image calculated from the per-voxel D(ω)-R1-R2 distributions with Eq. 1 using b = 0, τR = ∞, and τE = 20 ms. A closer view on one voxel reveals two distinct fiber populations with similar values of E[DΔ2]. (B) ODFs colored by E[Diso], E[R1], E[R2], E[Dxx,Dyy,Dzz]/[D33], Δω/2πE[Diso], and Δω/2πE[DΔ2] from the same region as the closer view of (A).
The projections, parameter maps, and ODFs presented from Figure 2 to Figure 6 illustrate the abundance of information contained within the nonparametric D(ω)-R1-R2-distributions estimated via Monte Carlo inversion of the signal acquired in the b(ω)-τR-τE space. In this study, the distributions were obtained from 809 images which is comparable to a recent 6D D-R1-R2 in vivo human brain study with acquisition of 633 image volumes in 25 min measurement time [55], thus indicating potential for translation of our method to clinical research. In previous lower-dimensional studies, each of the obtained parameters have been related to some underlying microstructural properties, local chemical composition, or heterogeneity of the tissue of interest. While most of our parameters have already been introduced in the literature under different names, we here choose to consistently use the means E[x], variances V[x], and covariances C[x,y] convention [44] to emphasize that the parameters all report on some specific aspect of the same D(ω)-R1-R2-distribution. The most prominent examples are the equivalences between E[Diso], apparent diffusion coefficient (ADC) [16], and mean diffusivity (MD) [11]; E[DΔ2] and microscopic fractional anisotropy (µFA) [47, 49]; E[R1] and E[R2] and quantitative R1 = 1/T1 and R2 = 1/T2 [4]; V[Diso], isotropic variance (
Unlike lower-dimensional studies where the given metrics are averaged over all the components within a voxel, our multidimensional correlation method allows resolving, for instance, E[R1], E[R2], and Δω/2πE[Diso] for each bin defined in the 2D Diso-DΔ2 plane and, for anisotropic components, each direction in the 2D θ-ϕ projection. Our version of directionally-encoded color (DEC) based on bin1-resolved E[Dxx,Dyy,Dzz]/E[D33] gives similar results as the more conventional DEC fractional anisotropy (FA) typically used to visualize the main directions of the WM tracts as estimated with DTI. The increase in level of detail when going from DEC-FA to DEC-ODF obtained by constrained spherical deconvolution of HARDI data [89] is mirrored in our step from bin- to orientation-resolved metrics [52, 54]—with the major difference that color-coding of maps and ODFs is not limited to orientation but can be based on any of the obtained parameters. The 2D Diso-DΔ2 binning corresponds to the 2D MD-FA binning to separate WM, GM, and CSF voxels introduced by Pierpaoli et al. already in 1996 [12], and does here not take advantage of the additional dimensions that could be utilized to tease apart distinct water populations or tissue types. As examples, binning in the 3D Diso-DΔ2-R2 volume has been shown to also differentiate between deep and cortical GM [53] and binning in the 4D Diso-DΔ2-θ-ϕ space allows estimation of specific E [R1] or E [R2] for a few distinct fiber bundles within the same voxel [52, 54]. Speculating based on the maps in Figure 3, binning in a dimension related to ω-dependence could be utilized to isolate components similar to the granule cell layer or the stria terminalis. Manual binning becomes increasingly challenging in even higher-dimensional spaces and should preferably be implemented as some automatic data-driven approach incorporating information from multiple voxels, for instance building on the recent works in Refs. [90–92].
Even without binning, the spread and correlations between the dimensions are captured with the per-voxel (co)variance metrics V[x] and C[x,y] which may be more generally applicable than the bin-resolved ones for pathologies where the distinction between clusters of components is less clear-cut than in the current example with WM, GM, and PBS. The single-tissue voxels in Figure 2C give low but finite (co)variances that may be challenging to distinguish from the distribution widths originating from the measurement noise and inversion uncertainty [44]. Although comparison between independently processed neighboring voxels and uncertainty estimation by bootstrapping give an indication of the precision of the estimated parameters, they may still suffer from bias that is difficult to correct for [93]. In particular for the larger voxel sizes used for in vivo human measurements, partial volume effects give rise to larger (co)variances, the magnitudes and signs of which may be predicted from single-tissue results. As examples, the representative values of Diso, R1, and R2 of WM and GM reported in Figure 4 would give negative C[Diso,R1], positive C[Diso,R2], and negative C[R1,R2] for a voxel comprising comparable fractions of the two tissue types.
Parameter maps such as E[Diso] and E[DΔ2] show similar trends as in previous in vivo mouse and human brain studies [50, 52, 53]. A direct quantitative comparison of conventional ADC and E[Diso] must consider that the results of our method is in effect extrapolated to the limit b = 0, τR = ∞, and τE = 0 unlike conventional ADC, which is obtained at the finite values of τR and τE given by the pulse sequence timings. Our E[Diso] results showing locally higher values in the granule and pyramidal cell layers, which according to histology have higher cell densities than the neighboring tissues, and seemingly contradicts the simplified interpretation of low ADC or E[Diso] corresponding to high cellularity. Additional factors contributing to the ADC values are cell membrane permeability, allowing molecular exchange between the intra- and extracellular spaces, and between adjacent cells [94], the relative fraction of the extracellular space [5], and tissue architecture. In the rodent brain, the granule and pyramidal cell layers are mostly tightly packed cells with a regular geometry [62] in contrast with other brain areas (e.g., cortex, thalamus) where the cells are more scattered and share space with an array of neuropil in multiple orientations. Hence, the observation of elevated E[Diso] in the granule cell layer results from the combined effects of the cell density, nuclear volume fractions, geometry, and molecular exchange [5, 95–98].
For in vivo human brain, WM showed higher values of both E[R1] and E[R2] than GM [52, 53, 55], which is consistent with our E[R2] results. Conversely, we found that E[R1] in WM is slightly lower than in GM, which on the other hand agrees with in vivo rat model-based diffusion-relaxation correlation [99]. However, besides the obvious futility of trying to compare quantitative relaxation measures from previous in vivo studies with our data on an ex vivo specimen at rather extreme levels of added contrast agent to reduce the scanning time, there are some more fundamental issues with attempting to compare quantitative R1 from different studies or different pulse sequences as recently elucidated in detail by Manning et al. [8]. The value of R1 observed by varying some relaxation delay in the pulse sequence does not report on just the properties of the water molecules giving rise to signal intensity in the actually detected images, but instead results from a complex interplay between partial excitation by the radiofrequency pulses, relaxation, and exchange of molecules, protons, or magnetization between numerous proton pools, for instance intra/extracellular water, myelin water, non-aqueous myelin, and non-aqueous non-myelin protons, all having have their distinct NMR properties in terms of R1, R2, and linewidth. This latter property determines how the proton pool is affected by radiofrequency pulses with limited bandwidth as invariably used on clinical MRI hardware and also on pre-clinical scanners for slice selection. Taken together, quantitative R1 will in general not be the same if measured with different pulse sequences and may even depend on the detailed acquisition settings such as slice thickness or the bandwidth of the radiofrequency pulses. Consequently, our values of E[R1] and E[R2] should not be compared in too much detail with other results obtained under different conditions.
In the per-voxel and bin-resolved frequency-dependence maps in Figure 3, Δω/2πE[Diso] is equivalent to ΔfADC measured with oscillating gradients in earlier studies [61, 62, 96, 100]. Applying a model of spherical confinement [101] to a liquid with bulk diffusivity 1.6·10−9 m2s−1 (corresponding to PBS in Figure 4) and a frequency range of 50–150 Hz yields elevated values of Δω/2πE[Diso] in the approximate diameter range of 4–12 μm with a maximum at 7 μm. In Figure 5, the highest values of Δω/2πE[Diso] are observed in the granule cell layer of the dentate gyrus which according to histology comprises densely packed granule cells of approximately 15–18 μm length and 10 μm width [102, 103], the latter being within the window giving elevated Δω/2πE[Diso]. The other highlighted region in Δω/2πE[Diso] is the pyramidal cell layer of the hippocampus, which comprises just two rows of cells unlike the granule cells in dentate gyrus with eight rows. Compared to previous studies with oscillating gradients, our values were less elevated in the pyramidal cell layer. The difference could be related to the 50–150 Hz frequency range in our study which was somewhat lower and narrower than the 60–180 Hz range in previous rat brain studies. Thus, it is desirable to optimize the gradient waveforms to cover a wider frequency range [100]. Another reason for inconsistent values of ΔfADC across studies could be relaxation bias resulting from the specific values τR and τE determined by the hardware and imaging parameters. The Δω/2πE[DΔ2] map showed negative values in the stria terminalis which in histology corresponds to an area of less myelinated axons than major white matter tracts. The time/frequency-dependence of μFA, similar to our Δω/2πE[DΔ2] map, has been less studied; however, it has been seen that it could provide complementary information in regions of heterogenous microstructure [104]. The frequency-dependence of FA has been inconsistent across studies unlike the diffusivity, which has been constantly observed to increase with frequency [63, 96, 104].
Massively multidimensional diffusion-relaxation correlation MRI joins diffusion-relaxation correlation, time/frequency-dependent (“restricted”) diffusion, and tensor-valued encoding into a common data acquisition and analysis framework, giving per-voxel nonparametric D(ω)-R1-R2-distributions which can be projected to the parameter spaces of all the constituent lower-dimensional methods. The unprecedented level of detail opens new opportunities to provide a more specific description of the contribution of cell types, local chemical composition, axonal density, restriction, and orientations within a voxel by a single set of measurements. This method adds the possibility of disentangling bundle-specific metrics within a WM voxel with multiple fiber orientations. As diffusion-relaxation correlation [52], oscillating gradients [105, 106], and tensor-valued encoding [107] with spin echo-prepared EPI read-out are all increasingly used for in vivo human studies on high-end conventional clinical scanners, our massively multidimensional acquisition and analysis approach has potential for translation to clinical research studies using only moderately longer scanning times than each of the individual lower-dimensional methods. Further studies are needed where all the quantitative information from the obtained distributions and maps is integrated with phantoms validation [108], as well as with advanced histological validation [109] of healthy and pathological tissues.
Data and code supporting the conclusion of this article will be made available at https://github.com/daniel-topgaard.
The animal study was reviewed and approved by the Animal Committee of the Provincial Government of Southern Finland.
ON: preparation of rat brain; acquisition and interpretation of MRI and histology data; drafting the manuscript. LS: analysis, implementation and visualization of ODFs. MY: development of ParaVision data acquisition code and Matlab conversion code. AS: preparation of rat brain; acquisition and interpretation of MRI and histology data; revising the manuscript. DT: development of theory; Matlab and Python data inversion code; revising the manuscript. All authors contributed to the final version of the manuscript.
This work was financially supported the Swedish Foundation for Strategic Research (ITM17-0267) and Swedish Research Council (2018-03697), Academy of Finland (#323385), and Erkko Foundation.
DT owns shares in Random Walk Imaging AB (Lund, Sweden, and http://www.rwi.se/), holding patents related to the described methods.
The remaining author declares that the research was conducted in the absence of any commercial or financial relationships that could be construed as a potential conflict of interest
All claims expressed in this article are solely those of the authors and do not necessarily represent those of their affiliated organizations, or those of the publisher, the editors and the reviewers. Any product that may be evaluated in this article, or claim that may be made by its manufacturer, is not guaranteed or endorsed by the publisher.
We thank Maarit Pulkkinen for her assistance in animal and tissue handling and histology.
ADC, apparent diffusion coefficient; corpus callosum; cg, cingulum; Cx, cortex; dMRI, diffusion magnetic resonance imaging, DTD, diffusion tensor distributions; DTI, diffusion tensor imaging; ec, external capsule; Ent, entorhinal cortex; fi, fimbria; Gd, gadolinium; GM, gray matter; gcl, granule cell layer; hipp, hippocampus; ic, internal capsule; MRI, magnetic resonance imaging; MD, mean diffusivity; NMR, nuclear magnetic resonance; ODF, orientation distribution function; PBS, phosphate buffer saline; py, pyramidal cell layer; st, stria terminalis; tha, thalamus; v, ventricle; WM, white matter.
1. Callaghan PT. Translational Dynamics and Magnetic Resonance. Oxford, UK: Oxford University Press (2011). doi:10.1093/acprof:oso/9780199556984.001.0001
2. Price WS. NMR Studies of Translational Motion. Cambridge, UK: Cambridge University Press (2009). doi:10.1017/CBO9780511770487
3. Halle B. Molecular Theory of Field-dependent Proton Spin-Lattice Relaxation in Tissue. Magn Reson Med (2006) 56:60–72. doi:10.1002/mrm.20919
4. Weiskopf N, Edwards LJ, Helms G, Mohammadi S, Kirilina E. Quantitative Magnetic Resonance Imaging of Brain Anatomy and In Vivo Histology. Nat Rev Phys (2021) 3:570–88. doi:10.1038/s42254-021-00326-1
5. Padhani AR, Liu G, Mu-Koh D, Chenevert TL, Thoeny HC, Takahara T, et al. Diffusion-weighted Magnetic Resonance Imaging as a Cancer Biomarker: Consensus and Recommendations. Neoplasia (2009) 11:102–25. doi:10.1593/neo.81328
6. Hills BP, Wright KM, Belton PS. Proton N.M.R. Studies of Chemical and Diffusive Exchange in Carbohydrate Systems. Mol Phys (1989) 67:1309–26. doi:10.1080/00268978900101831
7. Hills BP, Cano C, Belton PS. Proton NMR Relaxation Studies of Aqueous Polysaccharide Systems. Macromolecules (1991) 24:2944–50. doi:10.1021/ma00010a047
8. Manning AP, MacKay AL, Michal CA. Understanding Aqueous and Non-aqueous Proton T1 Relaxation in Brain. J Magn Reson (2021) 323:106909. doi:10.1016/j.jmr.2020.106909
9. Edzes HT, Samulski ET. The Measurement of Cross-Relaxation Effects in the Proton NMR Spin-Lattice Relaxation of Water in Biological Systems: Hydrated Collagen and Muscle. J Magn Reson (1978) 31:207–29. doi:10.1016/0022-2364(78)90185-3
10. Does MD. Inferring Brain Tissue Composition and Microstructure via MR Relaxometry. Neuroimage (2018) 182:136–48. doi:10.1016/j.neuroimage.2017.12.087
11. Basser PJ, Mattiello J, LeBihan D. MR Diffusion Tensor Spectroscopy and Imaging. Biophysical J (1994) 66:259–67. doi:10.1016/S0006-3495(94)80775-1
12. Pierpaoli C, Jezzard P, Basser PJ, Barnett A, Di Chiro G. Diffusion Tensor MR Imaging of the Human Brain. Radiology (1996) 201:637–48. doi:10.1148/radiology.201.3.8939209
13. Gelman N, Ewing JR, Gorell JM, Spickler EM, Solomon EG. Interregional Variation of Longitudinal Relaxation Rates in Human Brain at 3.0 T: Relation to Estimated Iron and Water Contents. Magn Reson Med (2001) 45:71–9. doi:10.1002/1522-2594(200101)45:1<71:aid-mrm1011>3.0.co;2-2
14. Stüber C, Morawski M, Schäfer A, Labadie C, Wähnert M, Leuze C, et al. Myelin and Iron Concentration in the Human Brain: A Quantitative Study of MRI Contrast. Neuroimage (2014) 93:95–106. doi:10.1016/j.neuroimage.2014.02.026
15. Stejskal EO, Tanner JE. Spin Diffusion Measurements: Spin Echoes in the Presence of a Time‐Dependent Field Gradient. J Chem Phys (1965) 42:288–92. doi:10.1063/1.1695690
16. Le Bihan D, Breton E, Lallemand D, Grenier P, Cabanis E, Laval-Jeantet M. MR Imaging of Intravoxel Incoherent Motions: Application to Diffusion and Perfusion in Neurologic Disorders. Radiology (1986) 161:401–7. doi:10.1148/radiology.161.2.3763909
17. Slator PJ, Palombo M, Miller KL, Westin CF, Laun F, Kim D, et al. Combined Diffusion‐relaxometry Microstructure Imaging: Current Status and Future Prospects. Magn Reson Med (2021) 86:2987–3011. doi:10.1002/mrm.28963
18. Tax CMW. Chapter 7. Estimating Chemical and Microstructural Heterogeneity by Correlating Relaxation and Diffusion. In: D Topgaard, editor. Advanced Diffusion Encoding Methods in MRI. Cambridge, UK: Royal Society of Chemistry (2020). p. 186–227. doi:10.1039/9781788019910-00186
19. Reymbaut A. Chapter 3. Diffusion Anisotropy and Tensor-Valued Encoding. In: D Topgaard, editor. Advanced Diffusion Encoding Methods In MRI. Cambridge, UK: Royal Society of Chemistry (2020). p. 68–102. doi:10.1039/9781788019910-00068
20. Aggarwal M. Chapter 4. Restricted Diffusion and Spectral Content of the Gradient Waveforms. In: D Topgaard, editor. Advanced Diffusion Encoding Methods In MRI. Cambridge, UK: Royal Society of Chemistry (2020). p. 103–22. doi:10.1039/9781788019910-00103
21. Galvosas P, Callaghan PT. Multi-dimensional Inverse Laplace Spectroscopy in the NMR of Porous media. Comptes Rendus Physique (2010) 11:172–80. doi:10.1016/j.crhy.2010.06.014
22. Bernin D, Topgaard D. NMR Diffusion and Relaxation Correlation Methods: New Insights in Heterogeneous Materials. Curr Opin Colloid Interf Sci (2013) 18:166–72. doi:10.1016/j.cocis.2013.03.007
23. Song YQ, Venkataramanan L, Kausik R, Heaton N. Chapter 4. Two-Dimensional NMR of Diffusion and Relaxation. In: R Valiullin, editor. Diffusion NMR of Confined Systems. Cambridge, UK: Royal Society of Chemistry (2016). p. 111–55. doi:10.1039/9781782623779-00111
24. Zhang Y, Blümich B. Spatially Resolved D-T2 Correlation NMR of Porous media. J Magn Reson (2014) 242:41–8. doi:10.1016/j.jmr.2014.01.017
25. Benjamini D, Basser PJ. Multidimensional Correlation MRI. NMR Biomed (2020) 33:33. doi:10.1002/nbm.4226
26. Benjamini D. Chapter 10. Nonparametric Inversion of Relaxation and Diffusion Correlation Data. In: D Topgaard, editor. Advanced Diffusion Encoding Methods In MRI. Cambridge, UK: Royal Society of Chemistry (2020). p. 278–316. doi:10.1039/9781788019910-00278
27. Kim D, Doyle EK, Wisnowski JL, Kim JH, Haldar JP. Diffusion‐relaxation Correlation Spectroscopic Imaging: A Multidimensional Approach for Probing Microstructure. Magn Reson Med (2017) 78:2236–49. doi:10.1002/mrm.26629
28. Slator PJ, Hutter J, Palombo M, Jackson LH, Ho A, Panagiotaki E, et al. Combined Diffusion‐relaxometry MRI to Identify Dysfunction in the Human Placenta. Magn Reson Med (2019) 82:95–106. doi:10.1002/mrm.27733
29. Zhang Z, Wu HH, Priester A, Magyar C, Afshari Mirak S, Shakeri S, et al. Prostate Microstructure in Prostate Cancer Using 3-T MRI with Diffusion-Relaxation Correlation Spectrum Imaging: Validation with Whole-Mount Digital Histopathology. Radiology (2020) 296:348–55. doi:10.1148/radiol.2020192330
30. Benjamini D, Basser PJ. Magnetic Resonance Microdynamic Imaging Reveals Distinct Tissue Microenvironments. Neuroimage (2017) 163:183–96. doi:10.1016/j.neuroimage.2017.09.033
31. Benjamini D, Iacono D, Komlosh ME, Perl DP, Brody DL, Basser PJ. Diffuse Axonal Injury Has a Characteristic Multidimensional MRI Signature in the Human Brain. Brain (2021) 144:800–16. doi:10.1093/brain/awaa447
32. Topgaard D. Multiple Dimensions for Random Walks. J Magn Reson (2019) 306:150–4. doi:10.1016/j.jmr.2019.07.024
33. Topgaard D. Multidimensional Diffusion MRI. J Magn Reson (2017) 275:98–113. doi:10.1016/j.jmr.2016.12.007
34. Schmidt-Rohr K, Spiess HW. Multidimensional Solid-State NMR and Polymers. San Diego: Academic Press (1994).
35. Andrew ER, Bradbury A, Eades RG. Removal of Dipolar Broadening of Nuclear Magnetic Resonance Spectra of Solids by Specimen Rotation. Nature (1959) 183:1802–3. doi:10.1038/1831802a0
36. Szeverenyi NM, Bax A, Maciel GE. Magic-angle Hopping as an Alternative to Magic-Angle Spinning for Solid State NMR. J Magn Reson (1985) 61:440–7. doi:10.1016/0022-2364(85)90184-2
37. Frydman L, Chingas GC, Lee YK, Grandinetti PJ, Eastman MA, Barrall GA, et al. Variable‐angle Correlation Spectroscopy in Solid‐state Nuclear Magnetic Resonance. J Chem Phys (1992) 97:4800–8. doi:10.1063/1.463860
38. Eriksson S, Lasič S, Topgaard D. Isotropic Diffusion Weighting in PGSE NMR by Magic-Angle Spinning of the Q-Vector. J Magn Reson (2013) 226:13–8. doi:10.1016/j.jmr.2012.10.015
39. Eriksson S, Lasič S, Nilsson M, Westin C-F, Topgaard D. NMR Diffusion-Encoding with Axial Symmetry and Variable Anisotropy: Distinguishing between Prolate and Oblate Microscopic Diffusion Tensors with Unknown Orientation Distribution. J Chem Phys (2015) 142:104201. doi:10.1063/1.4913502
40. de Almeida Martins JP, Topgaard D. Two-dimensional Correlation of Isotropic and Directional Diffusion Using NMR. Phys Rev Lett (2016) 116:087601. doi:10.1103/PhysRevLett.116.087601
41. Westin C-F, Szczepankiewicz F, Pasternak O, Özarslan E, Topgaard D, Knutsson H, et al. Measurement Tensors in Diffusion MRI: Generalizing the Concept of Diffusion Encoding. Med Image Comput Comput Assist Interv (2014) 17:209–16. doi:10.1007/978-3-319-10443-0_27
42. Basser PJ, Pajevic S. A Normal Distribution for Tensor-Valued Random Variables: Applications to Diffusion Tensor MRI. IEEE Trans Med Imaging (2003) 22:785–94. doi:10.1109/TMI.2003.815059
43. Jian B, Vemuri BC, Özarslan E, Carney PR, Mareci TH. A Novel Tensor Distribution Model for the Diffusion-Weighted MR Signal. Neuroimage (2007) 37:164–76. doi:10.1016/j.neuroimage.2007.03.074
44. Topgaard D. Diffusion Tensor Distribution Imaging. NMR Biomed (2019) 32:e4066–12. doi:10.1002/nbm.4066
45. Lawrenz M, Koch MA, Finsterbusch J. A Tensor Model and Measures of Microscopic Anisotropy for Double-Wave-Vector Diffusion-Weighting Experiments with Long Mixing Times. J Magn Reson (2010) 202:43–56. doi:10.1016/j.jmr.2009.09.015
46. Jespersen SN, Lundell H, Sønderby CK, Dyrby TB. Orientationally Invariant Metrics of Apparent Compartment Eccentricity from Double Pulsed Field Gradient Diffusion Experiments. NMR Biomed (2013) 26:1647–62. doi:10.1002/nbm.2999
47. Lasič S, Szczepankiewicz F, Eriksson S, Nilsson M, Topgaard D. Microanisotropy Imaging: Quantification of Microscopic Diffusion Anisotropy and Orientational Order Parameter by Diffusion MRI with Magic-Angle Spinning of the Q-Vector. Front Phys (2014) 2:1–11. doi:10.3389/fphy.2014.00011
48. Topgaard D. Chapter 7. NMR Methods for Studying Microscopic Diffusion Anisotropy. In: R Valiullin, editor. Diffusion NMR of Confined Systems: Fluid Transport In Porous Solids And Heterogeneous Materials. Cambridge, UK: Royal Society of Chemistry (2016). p. 226–59. doi:10.1039/9781782623779-00226
49. Shemesh N, Jespersen SN, Alexander DC, Cohen Y, Drobnjak I, Dyrby TB, et al. Conventions and Nomenclature for Double Diffusion Encoding NMR and MRI. Magn Reson Med (2016) 75:82–7. doi:10.1002/mrm.25901
50. Yon M, de Almeida Martins JP, Bao Q, Budde MD, Frydman L, Topgaard D, et al. Diffusion Tensor Distribution Imaging of an In Vivo Mouse Brain at Ultrahigh Magnetic Field by Spatiotemporal Encoding. NMR Biomed (2020) 33:1–14. doi:10.1002/nbm.4355
51. de Almeida Martins JP, Topgaard D. Multidimensional Correlation of Nuclear Relaxation Rates and Diffusion Tensors for Model-free Investigations of Heterogeneous Anisotropic Porous Materials. Sci Rep (2018) 8:1–12. doi:10.1038/s41598-018-19826-9
52. Reymbaut A, Critchley J, Durighel G, Sprenger T, Sughrue M, Bryskhe K, et al. Toward Nonparametric Diffusion‐ Characterization of Crossing Fibers in the Human Brain. Magn Reson Med (2021) 85:2815–27. doi:10.1002/mrm.28604
53. de Almeida Martins JP, Tax CMW, Szczepankiewicz F, Jones DK, Westin C-F, Topgaard D. Transferring Principles of Solid-State and Laplace NMR to the Field of In Vivo Brain MRI. Magn Reson (2020) 1:27–43. doi:10.5194/mr-1-27-2020
54. de Almeida Martins JP, Tax CMW, Reymbaut A, Szczepankiewicz F, Chamberland M, Jones DK, et al. Computing and Visualising Intra‐voxel Orientation‐specific Relaxation-Diffusion Features in the Human Brain. Hum Brain Mapp (2021) 42:310–28. doi:10.1002/hbm.25224
55. Martin J, Reymbaut A, Schmidt M, Doerfler A, Uder M, Laun FB, Topgaard D. Nonparametric D-R1-R2 Distribution MRI of the Living Human Brain. Neuroimage (2021) 245:118753. doi:10.1016/j.neuroimage.2021.118753
56. Stepišnik J. Analysis of NMR Self-Diffusion Measurements by a Density Matrix Calculation. Phys B (1981) 104:350–64. doi:10.1016/0378-4363(81)90182-0
57. Callaghan PT, Stepišnik J. Frequency-domain Analysis of Spin Motion Using Modulated-Gradient NMR. J Magn Reson Ser A (1995) 117:118–22. doi:10.1006/jmra.1995.9959
58. Topgaard D, Malmborg C, Söderman O. Restricted Self-Diffusion of Water in a Highly Concentrated W/o Emulsion Studied Using Modulated Gradient Spin-echo NMR. J Magn Reson (2002) 156:195–201. doi:10.1006/jmre.2002.2556
59. Stepišnik J, Lasič S, Mohorič A, Serša I, Sepe A. Spectral Characterization of Diffusion in Porous media by the Modulated Gradient Spin echo with CPMG Sequence. J Magn Reson (2006) 182:195–9. doi:10.1016/j.jmr.2006.06.023
60. Wu D, Martin LJ, Northington FJ, Zhang J. Oscillating Gradient Diffusion MRI Reveals Unique Microstructural Information in normal and Hypoxia-Ischemia Injured Mouse Brains. Magn Reson Med (2014) 72:1366–74. doi:10.1002/mrm.25441
61. Aggarwal M, Jones MV, Calabresi PA, Mori S, Zhang J. Probing Mouse Brain Microstructure Using Oscillating Gradient Diffusion MRI. Magn Reson Med (2012) 67:98–109. doi:10.1002/mrm.22981
62. Aggarwal M, Burnsed J, Martin LJ, Northington FJ, Zhang J. Imaging Neurodegeneration in the Mouse hippocampus after Neonatal Hypoxia-Ischemia Using Oscillating Gradient Diffusion MRI. Magn Reson Med (2014) 72:829–40. doi:10.1002/mrm.24956
63. Baron CA, Beaulieu C. Oscillating Gradient Spin-echo (OGSE) Diffusion Tensor Imaging of the Human Brain. Magn Reson Med (2014) 72:726–36. doi:10.1002/mrm.24987
64. Van AT, Holdsworth SJ, Bammer R. In Vivo investigation of Restricted Diffusion in the Human Brain with Optimized Oscillating Diffusion Gradient Encoding. Magn Reson Med (2014) 71:83–94. doi:10.1002/mrm.24632
65. Jiang H, Topgaard D. Gradient Waveforms for Comprehensive Sampling of the Frequency and “Shape” Dimensions in b(ω)-Encoded Diffusion MRI. In: Proceedings of the International Society for Magnetic Resonance in Medicine; 2021 May 15–20 (2021):2458.
66. Lundell H, Nilsson M, Dyrby TB, Parker GJM, Cristinacce PLH, Zhou F-L, et al. Multidimensional Diffusion MRI with Spectrally Modulated Gradients Reveals Unprecedented Microstructural Detail. Sci Rep (2019) 9:1–12. doi:10.1038/s41598-019-45235-7
67. Narvaez O, Yon M, Jiang H, Bernin D, Forssell-Aronsson E, Sierra A, et al. Model-free Approach to the Interpretation of Restricted and Anisotropic Self-Diffusion in Magnetic Resonance of Biological Tissues. arXiv [Preprint] (2021). Available from: https://arxiv.org/abs/2111.07827.
68. Kingsley PB. Introduction to Diffusion Tensor Imaging Mathematics: Part II. Anisotropy, Diffusion-Weighting Factors, and Gradient Encoding Schemes. Concepts Magn Reson (2006) 28A:123–54. doi:10.1002/cmr.a.20049
69. Conturo TE, McKinstry RC, Akbudak E, Robinson BH. Encoding of Anisotropic Diffusion with Tetrahedral Gradients: A General Mathematical Diffusion Formalism and Experimental Results. Magn Reson Med (1996) 35:399–412. doi:10.1002/mrm.1910350319
70. Mattiello J, Basser PJ, Lebihan D. Analytical Expressions for the B Matrix in NMR Diffusion Imaging and Spectroscopy. J Magn Reson Ser A (1994) 108:131–41. doi:10.1006/jmra.1994.1103
71. Arbabi A, Kai J, Khan AR, Baron CA. Diffusion Dispersion Imaging: Mapping Oscillating Gradient Spin‐echo Frequency Dependence in the Human Brain. Magn Reson Med (2020) 83:2197–208. doi:10.1002/mrm.28083
72. Laitinen T, Sierra A, Bolkvadze T, Pitkänen A, Gröhn O. Diffusion Tensor Imaging Detects Chronic Microstructural Changes in white and gray Matter after Traumatic Brain Injury in Rat. Front Neurosci (2015) 9:9. doi:10.3389/fnins.2015.00128
73. Topgaard D. Director Orientations in Lyotropic Liquid Crystals: Diffusion MRI Mapping of the Saupe Order Tensor. Phys Chem Chem Phys (2016) 18:8545–53. doi:10.1039/C5CP07251D
74. Tournier J-D, Smith R, Raffelt D, Tabbara R, Dhollander T, Pietsch M, et al. MRtrix3: A Fast, Flexible and Open Software Framework for Medical Image Processing and Visualisation. Neuroimage (2019) 202:116137. doi:10.1016/j.neuroimage.2019.116137
75. Cordero-Grande L, Christiaens D, Hutter J, Price AN, Hajnal JV. Complex Diffusion-Weighted Image Estimation via Matrix Recovery under General Noise Models. Neuroimage (2019) 200:391–404. doi:10.1016/j.neuroimage.2019.06.039
76. Nilsson M, Szczepankiewicz F, Lampinen B, Ahlgren A, de Almeida Martins JP, Lasič S, et al. An Open-Source Framework for Analysis of Multidimensional Diffusion MRI Data Implemented in MATLAB. In: Proceedings International Society Of Magnetic Resonance In Medicine; 2018 Jun 16–21; Paris, France (2018).
77. Prange M, Song YQ. Quantifying Uncertainty in NMR Spectra Using Monte Carlo Inversion. J Magn Reson (2009) 196:54–60. doi:10.1016/j.jmr.2008.10.008
78. Smith AA, Ernst M, Meier BH. Because the Light Is Better Here: Correlation-Time Analysis by NMR Spectroscopy. Angew Chem Int Ed (2017) 56:13590–5. doi:10.1002/anie.201707316
79. Xu J, Li H, Li K, Harkins KD, Jiang X, Xie J, et al. Fast and Simplified Mapping of Mean Axon Diameter Using Temporal Diffusion Spectroscopy. NMR Biomed (2016) 29:400–10. doi:10.1002/nbm.3484
80. Aggarwal M, Smith MD, Calabresi PA. Diffusion‐time Dependence of Diffusional Kurtosis in the Mouse Brain. Magn Reson Med (2020) 84:1564–78. doi:10.1002/mrm.28189
81. Harkins KD, Beaulieu C, Xu J, Gore JC, Does MD. A Simple Estimate of Axon Size with Diffusion MRI. Neuroimage (2021) 227:117619. doi:10.1016/j.neuroimage.2020.117619
82. Reymbaut A, Zheng Y, Li S, Sun W, Xu H, Daimiel Naranjo I, et al. Chapter 14. Clinical Research with Advanced Diffusion Encoding Methods in MRI. In: D Topgaard, editor. Advanced Diffusion Encoding Methods In MRI. Cambridge, UK: Royal Society of Chemistry (2020). p. 406–29. doi:10.1039/9781788019910-00406
84. Mardia K, Jupp P. Directional Statistics; Wiley Series in Probability and Statistics. Chichester, UK: Wiley (2009).
85. Sakol N, Egawa A, Fujiwara T. Gadolinium Complexes as Contrast Agent for Cellular NMR Spectroscopy. Ijms (2020) 21:4042. doi:10.3390/ijms21114042
86. Szczepankiewicz F, van Westen D, Englund E, Westin C-F, Ståhlberg F, Lätt J, et al. The Link between Diffusion MRI and Tumor Heterogeneity: Mapping Cell Eccentricity and Density by Diffusional Variance Decomposition (DIVIDE). Neuroimage (2016) 142:522–32. doi:10.1016/j.neuroimage.2016.07.038
87. Salo RA, Belevich I, Jokitalo E, Gröhn O, Sierra A. Assessment of the Structural Complexity of Diffusion MRI Voxels Using 3D Electron Microscopy in the Rat Brain. Neuroimage (2021) 225:117529. doi:10.1016/j.neuroimage.2020.117529
88. Szczepankiewicz F, Lasič S, van Westen D, Sundgren PC, Englund E, Westin C-F, et al. Quantification of Microscopic Diffusion Anisotropy Disentangles Effects of Orientation Dispersion from Microstructure: Applications in Healthy Volunteers and in Brain Tumors. Neuroimage (2015) 104:241–52. doi:10.1016/j.neuroimage.2014.09.057
89. Tournier JD. Diffusion MRI in the Brain - Theory and Concepts. Prog Nucl Magn Reson Spectrosc (2019) 112-113:1–16. doi:10.1016/j.pnmrs.2019.03.001
90. Molina‐Romero M, Gómez PA, Sperl JI, Czisch M, Sämann PG, Jones DK, et al. A Diffusion Model‐free Framework with echo Time Dependence for Free‐water Elimination and Brain Tissue Microstructure Characterization. Magn Reson Med (2018) 80:2155–72. doi:10.1002/mrm.27181
91. Pas K, Komlosh ME, Perl DP, Basser PJ, Benjamini D. Retaining Information from Multidimensional Correlation MRI Using a Spectral Regions of Interest Generator. Sci Rep (2020) 10:3246. doi:10.1038/s41598-020-60092-5
92. Slator PJ, Hutter J, Marinescu RV, Palombo M, Jackson LH, Ho A, et al. Data-Driven Multi-Contrast Spectral Microstructure Imaging with InSpect: INtegrated SPECTral Component Estimation and Mapping. Med Image Anal (2021) 71:102045. doi:10.1016/j.media.2021.102045
93. Prange M, Song YQ. Understanding NMR Spectral Uncertainty. J Magn Reson (2010) 204:118–23. doi:10.1016/j.jmr.2010.02.010
94. Stanisz GJ, Wright GA, Henkelman RM, Szafer A. An Analytical Model of Restricted Diffusion in Bovine Optic Nerve. Magn Reson Med (1997) 37:103–11. doi:10.1002/mrm.1910370115
95. Topgaard D. Chapter 1. Translational Motion of Water in Biological Tissues - A Brief Primer. In: Advanced Diffusion Encoding Methods In MRI. Cambridge, UK: Royal Society of Chemistry (2020). p. 1–11. doi:10.1039/9781788019910-00001
96. Kershaw J, Leuze C, Aoki I, Obata T, Kanno I, Ito H, et al. Systematic Changes to the Apparent Diffusion Tensor of In Vivo Rat Brain Measured with an Oscillating-Gradient Spin-echo Sequence. Neuroimage (2013) 70:10–20. doi:10.1016/j.neuroimage.2012.12.036
97. Stanisz GJ. Diffusion MR in Biological Systems: Tissue Compartments and Exchange. Isr J Chem (2010) 43:33–44. doi:10.1560/e0wu-7ffh-31m6-vlyt
98. Buizza G, Paganelli C, Ballati F, Sacco S, Preda L, Iannalfi A, et al. Improving the Characterization of Meningioma Microstructure in Proton Therapy from Conventional Apparent Diffusion Coefficient Measurements Using Monte Carlo Simulations of Diffusion MRI. Med Phys (2021) 48:1250–61. doi:10.1002/mp.14689
99. De Santis S, Barazany D, Jones DK, Assaf Y. Resolving Relaxometry and Diffusion Properties within the Same Voxel in the Presence of Crossing Fibres by Combining Inversion Recovery and Diffusion-Weighted Acquisitions. Magn Reson Med (2016) 75:372–80. doi:10.1002/mrm.25644
100. Portnoy S, Flint JJ, Blackband SJ, Stanisz GJ. Oscillating and Pulsed Gradient Diffusion Magnetic Resonance Microscopy over an Extended B -value Range: Implications for the Characterization of Tissue Microstructure. Magn Reson Med (2013) 69:1131–45. doi:10.1002/mrm.24325
101. Stepišnik J. Time-dependent Self-Diffusion by NMR Spin-echo. Phys B (1993) 183:343–50. doi:10.1016/0921-4526(93)90124-O
102. Claiborne BJ, Amaral DG, Cowan WM. Quantitative, Three-Dimensional Analysis of Granule Cell Dendrites in the Rat Dentate Gyrus. J Comp Neurol (1990) 302:206–19. doi:10.1002/cne.903020203
103. Nielsen J, Sierra A, Belevich I, Jokitalo E, Aggarwal M. Exploring the Epileptic Rat Hippocampus Using Oscillating Gradients, 3D Electron Microscopy and Monte Carlo Simulations. In: Proceedings International Society Of Magnetic Resonance In Medicine; 2021 May 15–20 (2021).
104. Ianuş A, Jespersen SN, Serradas Duarte T, Alexander DC, Drobnjak I, Shemesh N. Accurate Estimation of Microscopic Diffusion Anisotropy and its Time Dependence in the Mouse Brain. Neuroimage (2018) 183:934–49. doi:10.1016/j.neuroimage.2018.08.034
105. Baron CA, Kate M, Gioia L, Butcher K, Emery D, Budde M, et al. Reduction of Diffusion-Weighted Imaging Contrast of Acute Ischemic Stroke at Short Diffusion Times. Stroke (2015) 46:2136–41. doi:10.1161/STROKEAHA.115.008815
106. Xu J, Jiang X, Li H, Arlinghaus LR, McKinley ET, Devan SP, et al. Magnetic Resonance Imaging of Mean Cell Size in Human Breast Tumors. Magn Reson Med (2020) 83:2002–14. doi:10.1002/mrm.28056
107. Lampinen B, Zampeli A, Björkman‐Burtscher IM, Szczepankiewicz F, Källén K, Compagno Strandberg M, et al. Tensor‐valued Diffusion MRI Differentiates Cortex and white Matter in Malformations of Cortical Development Associated with Epilepsy. Epilepsia (2020) 61:1701–13. doi:10.1111/epi.16605
108. McHugh DJ, Hubbard Cristinacce PL. Chapter 12. Phantoms for Validating Advanced Diffusion Sequences. In: D Topgaard, editor. Advanced Diffusion Encoding Methods In MRI. Cambridge, UK: Royal Society of Chemistry (2020). p. 349–76. doi:10.1039/9781788019910-00349
Keywords: diffusion-relaxation, diffusion tensor distribution, tensor-valued encoding spectrum, rat brain, multidimensional diffusion
Citation: Narvaez O, Svenningsson L, Yon M, Sierra A and Topgaard D (2022) Massively Multidimensional Diffusion-Relaxation Correlation MRI. Front. Phys. 9:793966. doi: 10.3389/fphy.2021.793966
Received: 12 October 2021; Accepted: 17 November 2021;
Published: 03 January 2022.
Edited by:
Dan Benjamini, National Institutes of Health (NIH), United StatesReviewed by:
Paddy Slator, University College London, United KingdomCopyright © 2022 Narvaez, Svenningsson, Yon, Sierra and Topgaard. This is an open-access article distributed under the terms of the Creative Commons Attribution License (CC BY). The use, distribution or reproduction in other forums is permitted, provided the original author(s) and the copyright owner(s) are credited and that the original publication in this journal is cited, in accordance with accepted academic practice. No use, distribution or reproduction is permitted which does not comply with these terms.
*Correspondence: Daniel Topgaard, ZGFuaWVsLnRvcGdhYXJkQGZrZW0xLmx1LnNl
Disclaimer: All claims expressed in this article are solely those of the authors and do not necessarily represent those of their affiliated organizations, or those of the publisher, the editors and the reviewers. Any product that may be evaluated in this article or claim that may be made by its manufacturer is not guaranteed or endorsed by the publisher.
Research integrity at Frontiers
Learn more about the work of our research integrity team to safeguard the quality of each article we publish.