- 1School of Humanities and Social Sciences, Xi’an Jiaotong University, Xi’an, China
- 2School of Mechano-Electronic Engineering, Xidian University, Xi’an, China
Network robustness is the ability of a network to maintain a certain level of structural integrity and its original functions after being attacked, and it is the key to whether the damaged network can continue to operate normally. We define two types of robustness evaluation indicators based on network maximum flow: flow capacity robustness, which assesses the ability of the network to resist attack, and flow recovery robustness, which assesses the ability to rebuild the network after an attack on the network. To verify the effectiveness of the robustness indicators proposed in this study, we simulate four typical networks and analyze their robustness, and the results show that a high-density random network is stronger than a low-density network in terms of connectivity and resilience; the growth rate parameter of scale-free network does not have a significant impact on robustness changes in most cases; the greater the average degree of a regular network, the greater the robustness; the robustness of small-world network increases with the increase in the average degree. In addition, there is a critical damage rate (when the node damage rate is less than this critical value, the damaged nodes and edges can almost be completely recovered) when examining flow recovery robustness, and the critical damage rate is around 20%. Flow capacity robustness and flow recovery robustness enrich the network structure indicator system and more comprehensively describe the structural stability of real networks.
Introduction
Nowadays, the network exists in every aspect of human life, and our life is convenient and complicated because of the network. Whether it is a technical network such as a computer network or a social network such as an interpersonal relationship, it will inevitably be disturbed or damaged, thus affecting the normal operation of the network, or worse, leading to the paralysis of the network. In the case of interference or disruption, robustness becomes the key to whether the network system can continue to operate normally. Specifically, network robustness describes the ability of a network to maintain a certain level of structural integrity and original functionality after nodes or edges experience random or deliberate attacks [1]. For example, robustness will be the decisive factor when a cell encounters external environmental changes or internal genetic variations, when an ecosystem encounters man-made disturbances and when a piece of computer software encounters disk failures, network overloads, or deliberate attacks [2]. Therefore, the robustness of a complex network has become an important topic of academic research due to the widespread existence of the complex network and the important role it plays for nature and human society. The early researchers of complex network robustness were Albert et al. [3], who pointed out that the scale-free network is more vulnerable under deliberate attack and more robust when subjected to random attack; Holme et al. [4] conducted an in-depth study on the robustness of the network as reflected by the changes in various indicators under different types of attack; Paul et al. [5] discussed how to effectively improve network robustness; He C-Q et al. [6] summarized the changing trend of robustness under different network topologies; Du W and Cai M et al. [7] proposed connection robustness and recovery robustness based on the connectivity and resilience of the network and selected four types of complex networks, including the random network and the scale-free network, for extensive experiments, and it is concluded that the random network is the best robust to deliberate attacks, and the node resilience of the scale-free network is better than the edge; Lu P-L et al. [8] explored the impact of the initial clustering coefficient on robustness when attacked by different conditions for three complex networks with the same degree distribution and different clustering coefficients and showed that the larger the initial clustering coefficient, the worse is the robustness of the network.
In research studies of the complex network robustness, the establishment of robustness evaluation indicators provides a certain basis for it. To ensure that the evaluation indicators can truly reflect the robustness of the complex network, measurability, sensitivity, and objectivity are required. Nowadays, robustness evaluation indicators generally include the network global effect, average path length, connectivity, relative size of the maximum connected subgraph, betweenness, circle rate, clustering coefficient [9], k-core structure [10, 11], core [12], and generalized k-cores [13, 14]. Among them, as the level of network damage caused by the attack increases, the average shortest path becomes larger and then smaller [9], and this trend of change is not a significant guide for practical applications; the betweenness index takes into account the changes of nodes and edges in the network but does not consider changes in the network size and structure as a whole [9]; the clustering coefficient reflects the tightness of connections between nodes in the network and is also an indicator of local change in the network; considering the maximum connected subgraph, the robustness of the complex network is defined as the size of the maximum connected subgraph in the network after randomly or deliberately removing a certain percentage of nodes from the network [15]; in single networks, k-core is defined as a maximal set of nodes that have at least k neighbors within the set [16], and the generalized k-core (Gk-core) is a core structure, which is obtained by implementing a k-leaf pruning procedure that progressively removes nodes with degree less than k alongside their nearest neighbors [14]. It can be seen that the existing robustness evaluation indicators mostly consider local changes in the network. No research has been carries out to measure robustness from the perspective of network flow, a metric that describes the global topology of the network, and it can reflect the structural characteristics of network connections comprehensively and break the limitations on network weights and propagation methods [17]. In addition, the failure mechanism of the nodes when the network is attacked is also an important factor in network robustness analysis [1]. Most of the existing studies have focused on the mechanism of system failure, but in real life, except the occurrence of failure, it also includes the repair of failure, which is the recovery of damaged nodes or edges according to certain recovery mechanisms. Therefore, it is necessary to consider the resilience after the network is damaged in the construction of the network robustness evaluation indicators.
In this study, we propose two types of network structural robustness measurement indicators, namely, capacity robustness based on maximum flow and recovery robustness based on maximum flow, in terms of the ability of the network to resist damage and the ability of the network structure to recover after damage, respectively. We use non-global information to recover deleted nodes and edges after the network is destroyed. In order to verify the effectiveness of the robustness indicators proposed in this study, we perform robustness experimental analysis on several typical networks such as the BA scale-free network (a scale-free network proposed by Barabasi and Albert), ER random network (a random network proposed by Erdos and Renyi), nearest neighbor coupled (NNC) regular network, and WS small-world network (a small-world network proposed by Watts and Strogatz) and finally explore the relationship between network structure characteristics and network structure robustness.
Materials and Methods
Related Work
The complex network theory emerged in the 1960s and generally refers to the network with some or all of the properties in self-organization, self-similarity, attractor, small-world, and scale-free [9]. The complex network is an abstract complex system whose complexity is mainly reflected in the number of connected nodes and its complex topological structure. It is often used to study the structural properties, formation mechanisms, and evolution laws of the real network. The network robustness and destruction resistance are important parts of the current research on complex networks.
Generally, when a network is attacked, depending on intensity and extensity of error, the attacked nodes are impaired to become non-functional nodes or partially functional nodes (nodes as being a state that is functional but not at full power) [18], and these lost functions will be shared by the coupling relationships of neighboring nodes. This additional functional commitment puts a lot of pressure on the normal operation of the neighboring nodes and the entire network system, and in severe cases, it may lead to failure of other nodes or a whole network crash. The ability to maintain the function and property of the network that the damaged network has is network robustness. Similar to robustness, destruction resistance indicates the performance changes when a network is under attack. The difference is that the destruction resistance prefers the ability to maintain or recover to an acceptable level when the network is damaged.
Existing correlational researches mostly focus on the measurement of the robustness and destruction resistance of the network, make structural optimizations to them, and further apply them in relevant practical areas: In an earlier study, Albert et al. [3] compared the robustness of ER network and scale-free (SF) network under deliberate and random attacks, and the results showed that SF network is significantly more robust than ER network during random attack, while the robustness of SF network is much less weak under deliberate attack, and simply deleting a small number of nodes with the largest degree may cause the network to collapse completely. Cohen et al. proposed the theoretical analytical conditions for network collapse under random attack based on percolation theory and applied them to the Internet and found high robustness of the Internet against random attack [19]; then they analyzed the robustness of SF network such as the Internet under deliberate attack through theoretical calculations and numerical simulations and argued that the Internet is highly sensitive and vulnerable to deliberate attack [20]. Darren et al. [21] achieved the identification of road segment importance using the road network robustness index and considered the road network robustness index in terms of topological attributes, capacity, and traffic flow characteristics of the road segments in the network. Tan Y-J and Wu J et al. [22] conducted research from the analysis and optimization of destruction resistance, proposed the influence of network aggregation and mixing on destruction resistance of network, and combined with the actual network researches to analyze optimization and control of destruction resistance, which provided a direction for the study of destruction resistance of complex network at that time. Du W and Cai M et al. [7] proposed connectivity robustness and recovery robustness based on the connectivity and recovery ability of the network and simulated a certain scale of regular network, small-world network, scale-free network, and random network for a large number of experiments, and it is concluded that random network has the best robustness against deliberate attack compared with the other three networks and that the node resilience of scale-free network is better than the edge resilience. Based on the complex network theory, Lu S [23] selected an aviation system as the research object modeled and analyzed the aviation network using Pajck software, summarized the changes of various parameters in the system, and proposed ideas to improve the robustness of air cargo. Focusing on interdependent networks, Dong G-G [24] et al. investigated the case of interdependent networks by generalizing feedback and non-feedback conditions, and specifically, they developed a new mathematical framework and used percolation theory to investigate numerically and analytically the percolation of interdependent networks with partial multiple-to-multiple dependency links. Shi H [25] proposed a shock resistance assessment method based on complex network, using peak ground acceleration as a reference to assess the destruction resistance of complex network buildings in an earthquake environment, and the assessment results were consistent with reality, which helped the timely measurement of building shock resistance. Dong G-G and Wang F et al. [26] developed two types of coupled giant network theoretical research frameworks, “deterministic coupled modes” and “coupled modes under arbitrary distribution”, to study the resilient behavior of the system, and concluded that there is indeed an optimum coupling structure among the subnetworks, which makes the entire system has the best connectivity and destruction resistance. Mariani et al. [27] focused on one of the non-random structure patterns in networks—nestedness, and concentrated on their discussion on three main aspects: the existing methodologies to nestedness in networks, the key theoretical mechanisms to explain nestedness in ecological and socioeconomic networks, and implications of the nested topology of interactions for the stability and viability of a given interacting systems. Wuellner et al. [28] analyzed the individual structures of the seven largest U.S. passenger carriers and found that networks with dense interconnectivity are extremely resilient to both targeted removal of airports (nodes) and random removal of flight paths (edges), and here, they measured the interconnectivity of the network using the k-core structure, which is a subgraph of the network constructed by iteratively pruning all vertices with a degree less than k. Shang Y-L [14] developed a mathematical framework for understanding the robustness of networks based on the number of nodes and edges in the Gk-core (a generalization of the ordinary k-core decomposition) under two general attacks with limited knowledge (min-n and max-n attacks), and it was found that knowing one more node (from n = 1 to n = 2) during attacks is most beneficial in terms of changing the robustness of the Gk-core. Therefore, research studies related to network robustness can help people understand the mechanisms and rules of network system failure or collapse and can identify better ways to prevent the failure of real network systems and build more robust systems, making real life more stable [29].
It can be seen that the research studies on network robustness pay more attention to measurement models and indicator changes and are devoted to the optimization of network destruction resistance and defense capability, while the in-depth studies of network resilience performance are not as mature as the research on network robustness. Resilience is the ability of a system to recover from an unfavorable state to a normal state (i.e., the initial state, or adjust itself to a new state according to new demands or conditions), which reflects the system’s adaptability and survivability [30]. Through the propagation and diffusion effects of the network, the behavior and recoverability of the nodes in the network can have a significant impact on the resilience of the network community and the entire network; at the same time, by adjusting the network structure and characteristics, the overall local and node-level resilience of the network will be optimized [31]. Thus, network resilience, although a relatively new concept, is an important field of network research.
Bai Y-N et al. [32] stated that a coupled network can be recovered only when the proportion of failed nodes in that network is less than the resilience threshold. In recent years, some scholars have further explored the influencing factors of network resilience performance and concluded that the coupling strength of the coupled network [33], the node recovery order of the dependent network [34], and the node importance ranking of the fault network [35] all have impact on the network resilience performance. Some scholars have optimized the network recovery model based on the equal probability recovery mechanism [36] and proposed a weighted probability recovery mechanism [35]. However, we can find that existing studies on network resilience measurements mostly focus on different typical networks and different network sizes, and network resilience is analyzed by comparing the number of nodes after recovery of the damaged network and the number of original network nodes, ignoring the impact of the network structure on the overall network function. The number of nodes, node-to-node connections, change in the overall structural characteristics of the network, and the magnitude of the change after recovery of the damaged network are important elements in the study of network resilience.
Definition of Structural Robustness Indicators Based on Maximum Flow
Network Model and Related Definitions
For a given capacity-containing network denoted as
then
Network Robustness Based on Maximum Flow
Complex network robustness refers to the ability of a network to remain connected even under random or deliberate attack, and its concept is widely used in various fields such as physics, sociology, and transportation. In the presence of uncertainty and crisis, robustness has become critical to whether the system can continue to operate. The existing robustness indicators mainly consider whether the network is connected or not and reflect the robustness of the network after a disruption from the network structure, that is, it only considers whether the nodes are connected or not but does not measure whether the circulation between the nodes is damaged. The network maximum flow considers not only whether the connections of nodes exist but also how the transmission capacity of the already existing nodes and connections, that is, it considers both the fact of existence and the quality of existence of the nodes. Therefore, in view of the maximum flow’s ability to characterize the connectivity of the network structure, this study uses maximum flow as a basic index to evaluate the robustness of the network and then proposes “capacity robustness based on maximum flow” and “recovery robustness based on maximum flow,” and the former reflects the ability of the network structure itself to resist attacks, while the latter reflects the resilience of the network after damage [7].
Capacity Robustness Based on Maximum Flow
Capacity robustness based on maximum flow (later referred to as flow capacity robustness) is the ability of the remaining nodes in the network to maintain circulation among themselves after some nodes have been damaged by an attack. There are two general ways to attack a network: one is a deliberate attack and the other is a random attack. The former refers to a purposeful and planned attack on the network such as prioritizing attacks on the more important nodes or edges; the latter refers to a network in which nodes or edges are attacked in a certain proportion at random. In this study, two types of damage strategies are used: deliberate attack and random attack. Specifically, a deliberate attack is to select the top
First, the network maximum flow matrix
where
Then
Based on the maximum flow matrix,
where
where
Finally, the flow capacity robustness
Recovery Robustness Based on Maximum Flow
In the real world, if it is difficult to obtain information about a specific individual, the information can be recovered to some extent by asking people who are related to the individual, and similar approaches have been used to find keyman in terrorist groups through connections between network nodes [37]. In this study, we recover the network through non-global information and define recovery robustness based on maximum flow (later referred to as flow recovery robustness), for example, the ability to recover disappeared network structure elements (broken nodes and edges) from information related to unbroken nodes after some nodes in a network have been attacked. Figure 1 visualizes the network structure of a network after attack and recovery. Specifically, Figure 1A shows a network of size 10 with node set
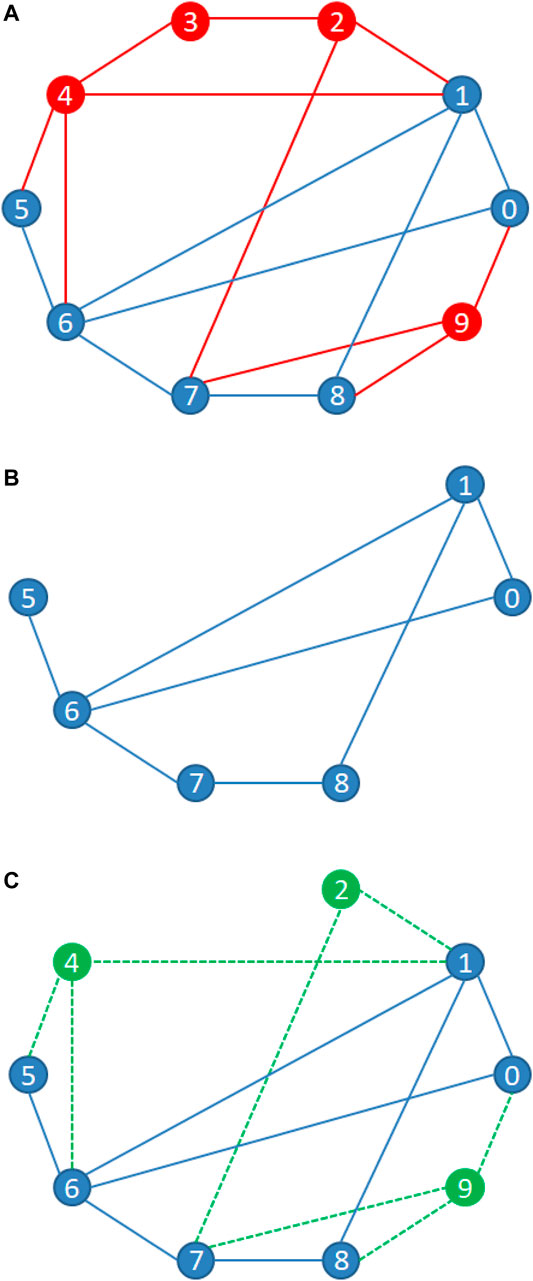
FIGURE 1. Damaged and recovery network structure. (A) Original network, where the red nodes are the nodes to be removed; (B) network that has not been recovered after attack; and (C) recovered network after attack.
We define
Based on the maximum flow matrix,
where
where
Finally, the flow recovery robustness
In order to explore the relationship between the aforementioned robustness indicators and the network topology, this study analyzes and verifies them through simulation experiments of typical networks.
Results
Four Typical Network Structures
In general, network models can be divided into three categories [38]: the first category is the random network; the second category is the regular network; and the third category is network structures between random and regular networks, which have some characteristics of both regular and random networks, including scale-free network and small-world network. In this study, four types of typical network, including regular network, random network, scale-free network, and small-world network, will be analyzed for structural robustness using the robustness indicators based on maximum flow.
Regular Network
A regular network is the network structure obtained by connecting nodes according to defined rules, and its structure is symmetric. A nearest neighbor coupled network and star network are two typical types of the regular network. In this study, we use the nearest neighbor coupled network (NNC) as the test network; that is, for a given even value of
BA Scale-free Network
The concept of the scale-free network started with an article by Barabasi and Albert published in 《Science》 in 1999 [39]. By studying the topology of the World Wide Web, they found that the node degree distribution obeys a power law distribution and proposed a classical model (BA model) for constructing a scale-free network. The initial number of nodes in the network is
ER Random Network
The ER random network was proposed by Erdos and Renyi in 1960 [40], and it is one of the main reference models for network research. The connections between network nodes of a random network are random, given the network size
WS Small-World Network
A small-world network is a type of network with short mean path lengths and high clustering coefficients. The first to propose a method for constructing a small-world network were Watts and Strogatz [41]. The specific construction algorithm is as follows:
1) Constructing a regular network encloses a nearest neighbor coupled network containing
2) Random reconnection randomly reconnects each edge in a regular network with probability
Simulation Experiment and Discussion
The simulation experiments were all implemented using Python 3.8 programming. Our method is applicable to many types of networks, such as the directed network, undirected network, 0–1 network, and weighted network, but in order to facilitate comparison with other methods and to focus on reflecting the impact of differences in the network structure on robustness, the networks chosen for the experiments were all undirected and unweighted 0–1 benchmark networks; that is, the same maximum flow value between the same node pairs
The attack strategies used in this study are random attack and deliberate attack. The random attack randomly selects
Analysis of Experimental Results of Flow Capacity Robustness
Figure 2 gives the changing situation of the flow capacity robustness for BA scale-free network of size 100, where Figure 2A and Figure 2B show the flow capacity robustness under deliberate and random attacks with the change in the node damage rate and growth rate, respectively, and Figure 2C shows the difference in flow capacity robustness under two types of attacks. From Figure 2A and Figure 2B, it can be seen that the overall network flow shows a significant decreasing trend as the node damage rate increases, regardless of whether it is a deliberate attack or a random attack. Specifically, when the network is deliberately attacked, the circulation capacity of the BA scale-free network, which has a small network growth rate, decreases rapidly when the nodes start to be damaged, showing the “emergent” phenomenon. It shows that the network with a small growth rate is more dependent on nodes with a larger degree, and only a few nodes with a large degree are damaged deliberately and can have a significant influence on the network, while the increase in the network growth rate can improve the flow capacity robustness. In contrast, for a BA scale-free network under random attack, the network growth rate has little effect on its flow capacity robustness, and there is almost a synchronous trend under different growth rates. Figure 2C shows the change in the difference between the flow capacity robustness under random attack minus the flow capacity robustness under deliberate attack (all similar differences below are for random attack minus deliberate attack, referred to as the flow capacity robustness difference). It can be seen that the flow capacity robustness differences are all greater than 0, reflecting to some extent that the robustness of the BA scale-free network against a random attack is better than that of the network against a deliberate attack. And the larger the growth rate of the network, the smaller is the flow capacity robustness difference, while the network with a larger growth rate has smoother flow capacity robustness change as the node damage rate increases.
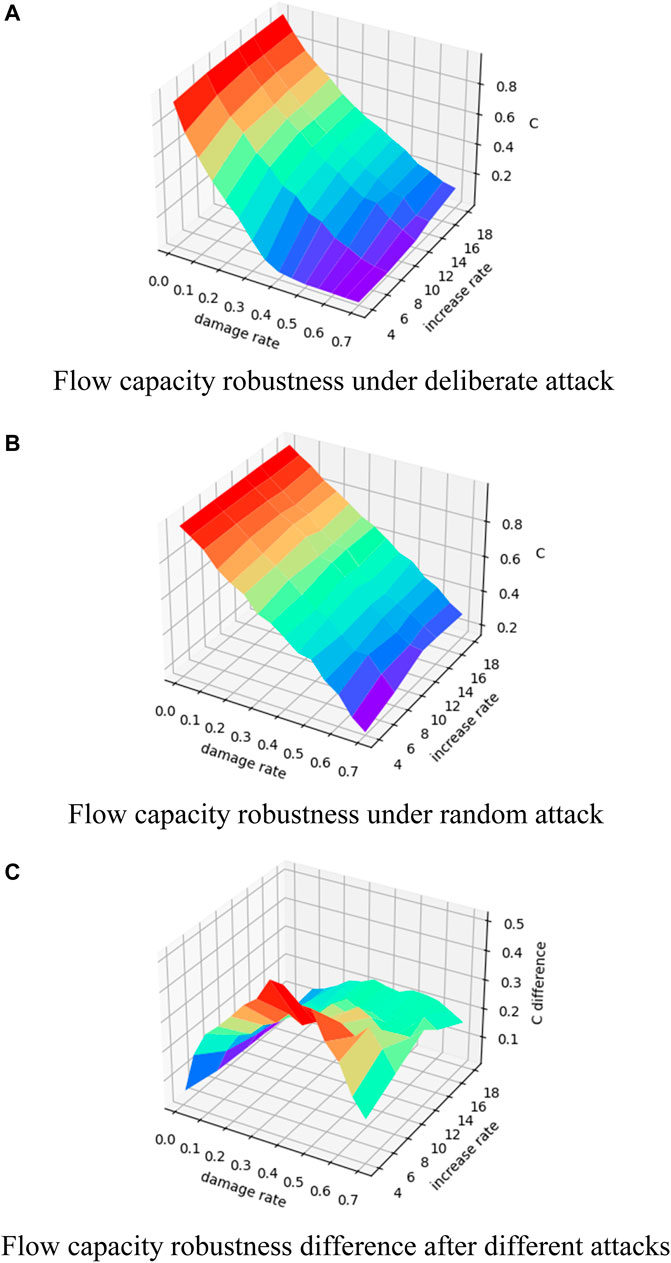
FIGURE 2. Changes in flow capacity robustness of the BA scale-free network. (A) Change in flow capacity robustness under different damage rates and increase rates for BA scale-free network under deliberate attack; (B) change in flow capacity robustness under different damage rates and increase rates for BA scale-free network under random attack; (C) change in the difference between the flow capacity robustness under random attack minus the flow capacity robustness under deliberate attack.
Figure 3 shows the results of the flow capacity robustness of the ER random network with size 100. It can be seen that the flow capacity robustness shows a decreasing trend with increasing node damage rate under both attack strategies, and the change of node damage rate brings an unstable change in network flow when network density is small (around 0.1). In contrast, network flow decreases smoothly at higher network densities. A deliberate attack can cause the “emergent” phenomenon of the ER random network with low network density when the node damage rate is small, suggesting that the flow capacity robustness of the low-density random network is more dependent on nodes with higher degrees. From Figure 3C, it can be seen that the flow capacity robustness difference is greater at smaller network densities (around 0.1), indicating that a low-density random network is not truly “random,” and therefore, the destructiveness of a deliberate attack in a low-density ER random network is much higher than that in a random attack. As network density increases, the gap between the destructiveness of the two attack strategies narrows significantly.
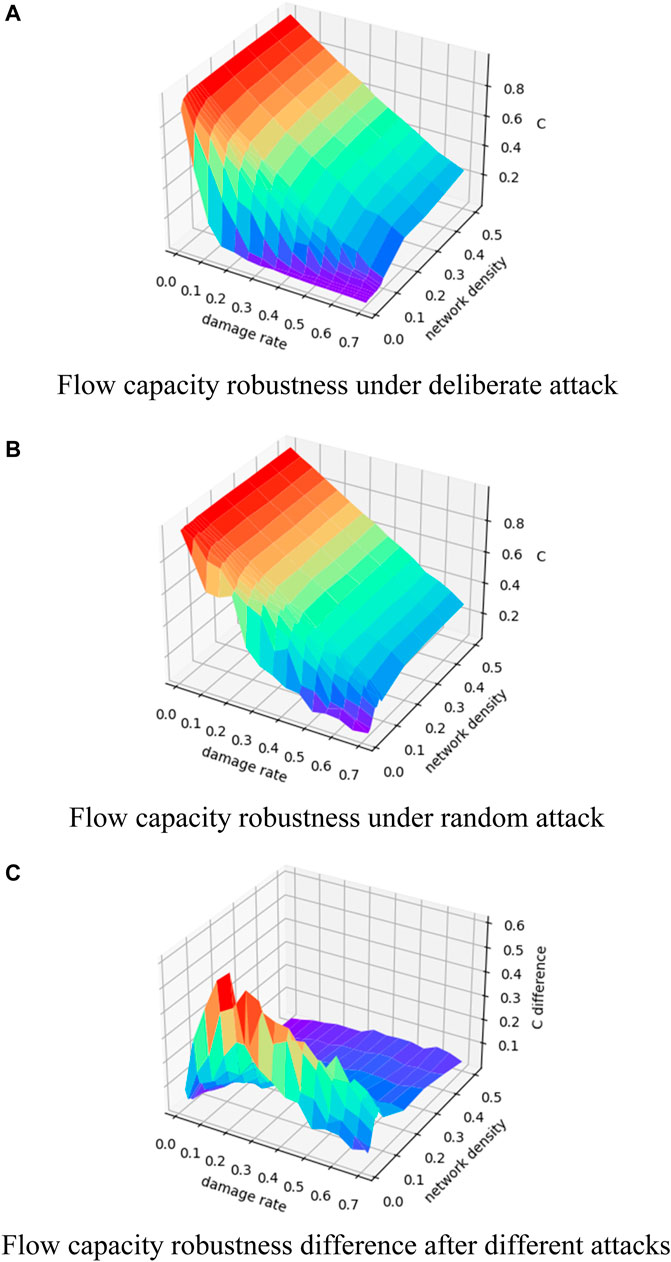
FIGURE 3. Changes in flow capacity robustness of the ER random network. (A) Change in flow capacity robustness under different damage rates and network density for ER random network under deliberate attack; (B) change in flow capacity robustness under different damage rates and network density for the ER random network under random attack; (C) change of the difference between the flow capacity robustness under random attack minus the flow capacity robustness under deliberate attack.
The flow capacity robustness results for an NNC regular network of size 100 are shown in Figure 4. The results show that the trend of network flows for deliberate and random attacks is very similar, that is, the overall decreases with the increase in the node damage rate, and an early “emergent” phenomenon of the flow capacity robustness emerges earlier in the regular network with a small average degree. Unlike the BA scale-free network and ER random network, the “emergent” phenomenon occurs in the NNC regular network under a random attack, that is, it is most sensitive to the initially disrupted 10% of nodes, and network flow decreases rapidly. This is also consistent with the case that NNC regular network nodes’ degree is the same, indicating that random and deliberate attacks have the same effect on the regular network. The change in the flow capacity robustness difference is also concentrated in a narrow range ([-0.025,0.025]), which indicates that the two attack strategies do not differ much for the NNC regular network and confirms that the same value of node degree of the regular network makes the two attacks essentially indistinguishable.
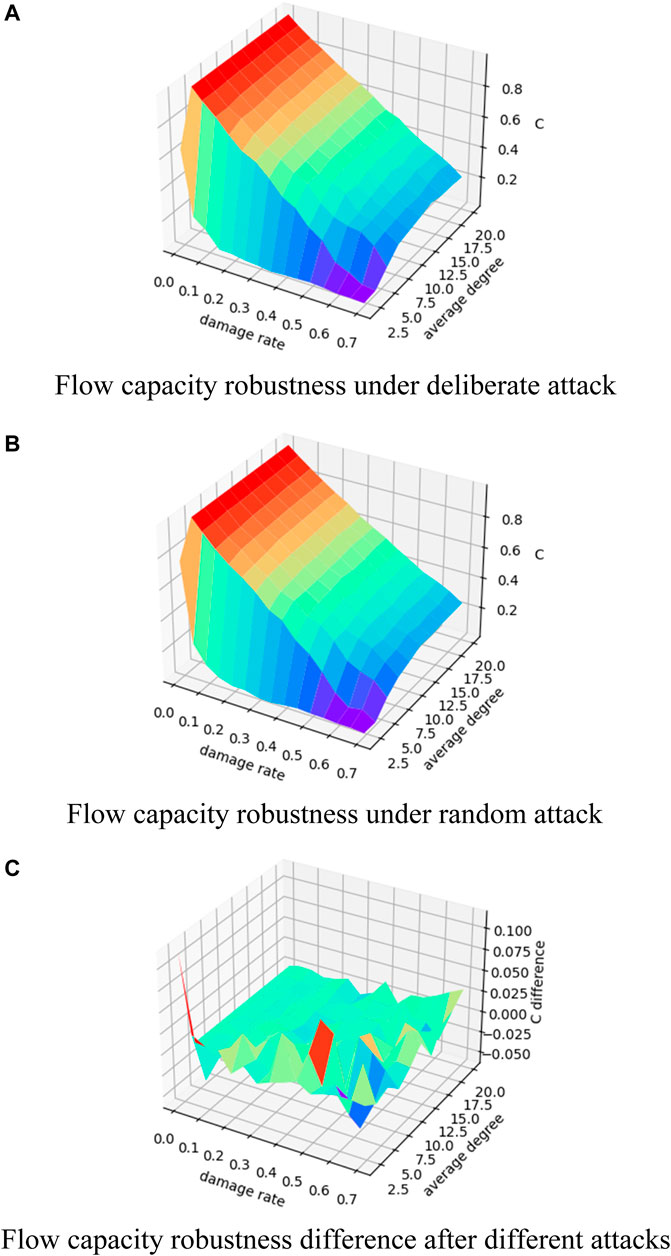
FIGURE 4. Changes in flow capacity robustness of NNC regular network. (A) Change in flow capacity robustness under different damage rates and average degree for the NNC regular network under deliberate attack; (B) change in flow capacity robustness under different damage rates and average degree for an NNC regular network under random attack; (C) change in the difference between the flow capacity robustness under random attack minus the flow capacity robustness under deliberate attack.
Figure 5 shows the experimental results of the flow capacity robustness for a WS small-world network of size 100, average degree 10, and reconnection probability increasing from 0.002 to 0.1. With the increases in the node damage rate, the overall network flow still shows a decreasing trend, but it can be seen that the flow capacity robustness under random attack decreases more regularly and smoothly, while the flow capacity robustness with a small reconnection probability does not change significantly during a deliberate attack (Figure 5A). From the results of the change of the flow capacity robustness difference, the difference at low reconnection probability and high damage rate is more obvious, and the destructive effect of a deliberate attack is significantly higher than that of a random attack.
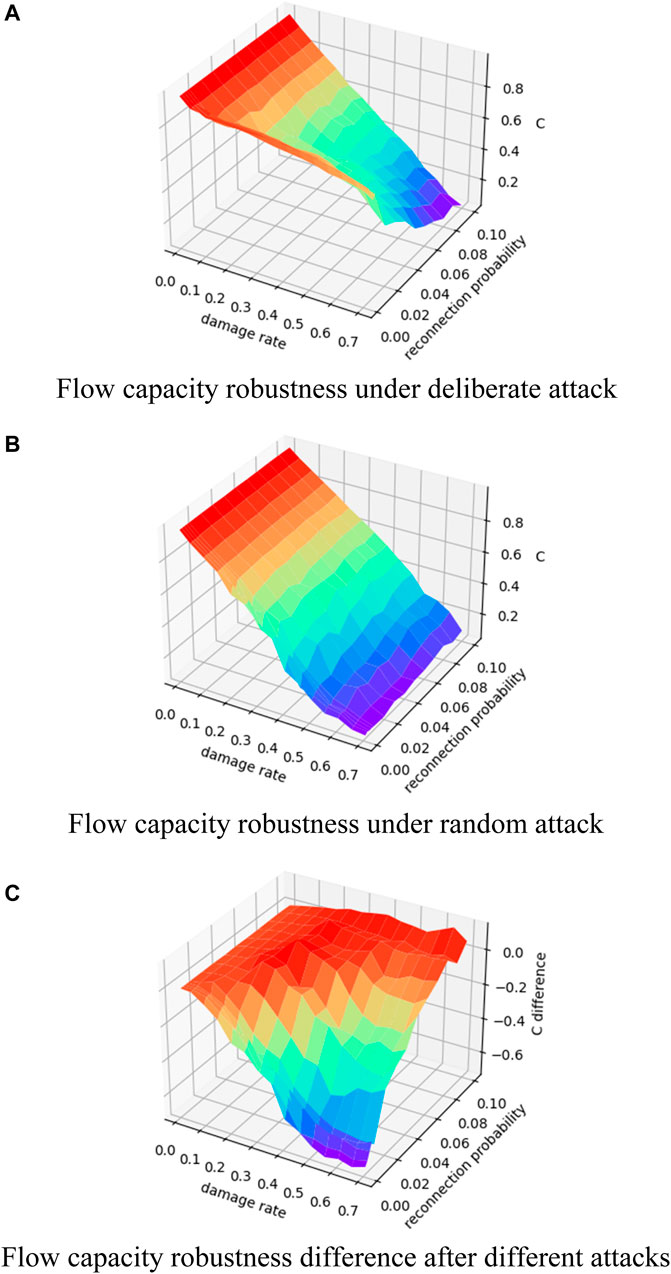
FIGURE 5. Changes in flow capacity robustness of the WS small-world network with 10 average degrees. (A) Change in flow capacity robustness under different damage rates and reconnection probability for the WS small-world network with 10 average degrees under deliberate attack; (B) change in flow capacity robustness under different damage rates and reconnection probability for the WS small-world network with 10 average degrees under random attack; (C) change in the difference between the flow capacity robustness under random attack minus the flow capacity robustness under deliberate attack.
The results of the flow capacity robustness experiments with a size of 100, a fixed reconnection probability of 0.1, and a mean degree increasing from 2 to 10 are shown in Figure 6. It can be seen that under the two attack methods, the smaller the network average, the earlier is the “emergent” phenomenon, and with the damage intensity increases, the overall network flow still shows a downtrend. The flow capacity robustness difference shows a large variation with the node damage rate’s change at smaller average degree; specifically, the change from a positive to negative flow robustness difference is accompanied by the change from a small to large node damage rate.
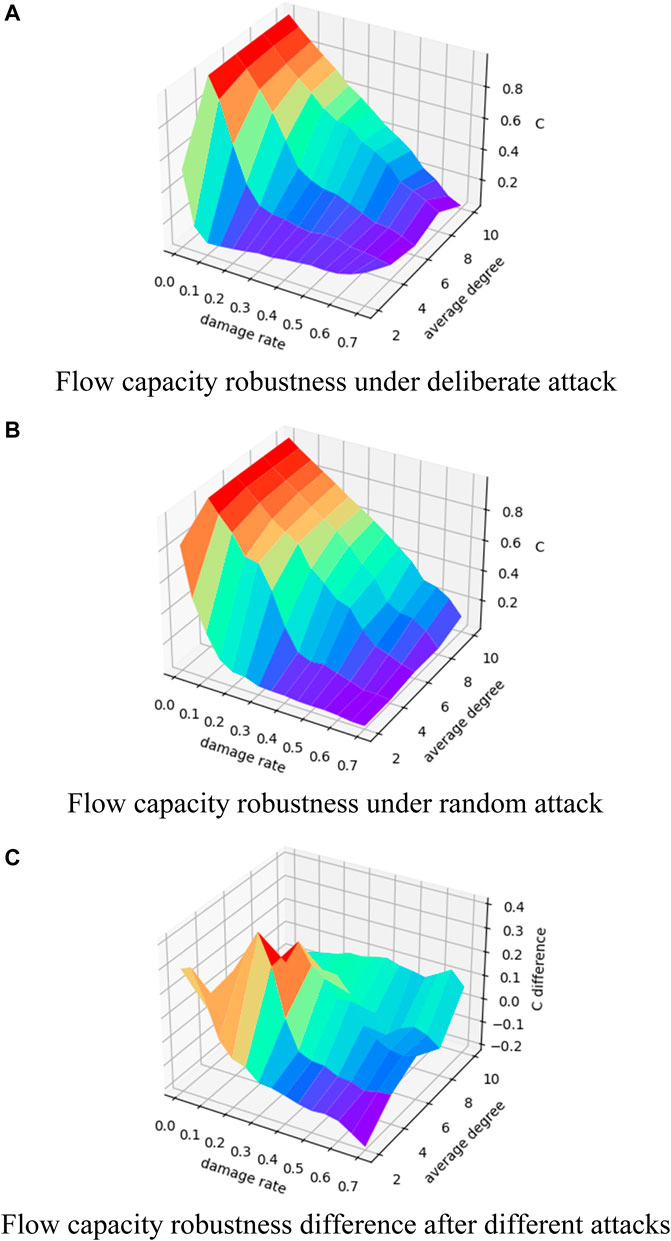
FIGURE 6. Changes in flow capacity robustness of the WS small-world network with 0.1 reconnection probability. (A) Change in flow capacity robustness under different damage rates and average degree for the WS small-world network with 0.1 reconnection probability under deliberate attack; (B) change in flow capacity robustness under different damage rates and average degree for the WS small-world network with 0.1 reconnection probability under random attack; (C) change in the difference between the flow capacity robustness under random attack minus the flow capacity robustness under deliberate attack.
Based on the previous experiments, Figure 7 shows how the flow capacity robustness indicator of several representative network parameters changes with the increase in the node damage rate, and the corresponding error bars are also shown in the figure, which is the standard of the mean (standard error).
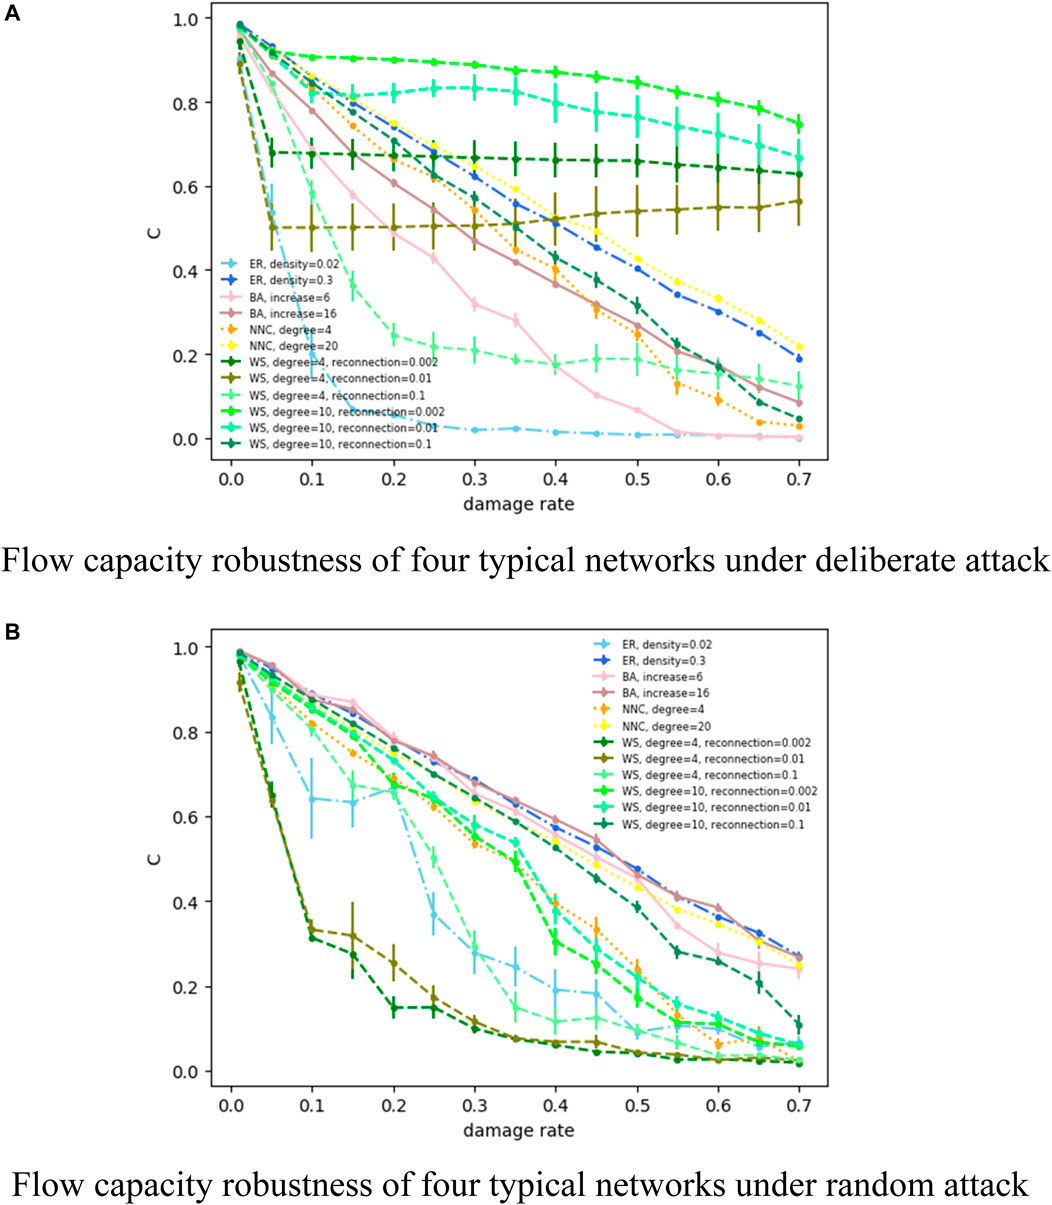
FIGURE 7. (A) Flow capacity robustness of four typical networks under deliberate attack. (B) Flow capacity robustness of four typical networks under random attack.
For a deliberate attack (Figure 7A), an “emergent” phenomenon of a low-density ER random network is more obvious, and almost no “emergent” phenomenon occurs for higher network densities, with a smooth decrease in network flow transmission capability. As for a BA scale-free network, although the flow capacity robustness is not as good as that of the high-density ER random network, it also shows a relatively stable downtrend, and the network flow transmission capacity of a low growth rate decreases faster than that of a high-growth network. The network flow transmission capability of an NNC regular network is similar to that of a BA scale-free network, and both show a steady decline. For a WS small-world network, when the network average degree is fixed, the smaller the reconnection probability, the larger is the flow capacity robustness and the more robust is the network. This also reflects small-world network between theeregular network and random network, where the higher the reconnection probability and the closer to random network, the more fragile is the network; conversely, the closer to the regular network, the more stable is the network. When network reconnection probability is fixed, the larger the average degree, the stronger is the network flow transmission capability and the greater is the flow capacity robustness; on the contrary, the weaker the network flow transmission capability and the smaller the flow capacity robustness. It can be seen that there are several small-scale rebounds in the network flow capacity robustness, which is due to the fact that the nodes with the same degree value are not unique and the order of nodes of two adjacent attacks is much more likely different, that is, the
For random attack (Figure 7B), in the ER random network, the low-density network appears “emergent” phenomenon faster, and the trend of change is unstable. In contrast, the growth rate of the BA scale-free network is not as sensitive to the random attack as deliberate attack, and it can be seen that there is little difference in the flow capacity robustness for growth rates of 6 and 16. NNC regular network flow is steadily decreasing with an increasing node damage rate, and the greater the average degree, the greater is the flow capacity robustness, which is basically consistent with the situation of the deliberate attack. The results of the WS small-world network show that after fixing reconnection probability, the larger the average degree, the larger is the flow capacity robustness; after fixing the average degree, the smaller the reconnection probability, the faster the “emergent” phenomenon appears.
Figure 7 shows how the flow capacity robustness indicator of several representative network parameters changes with the increase in the node damage rate under deliberate and random attacks. Furthermore, we conducted experiments on the same network with classical robustness, and the results are shown in Figure 8. Here, we chose the robustness based on the maximum connected subgraph as the classical robustness indicator, which is defined as follows:
where
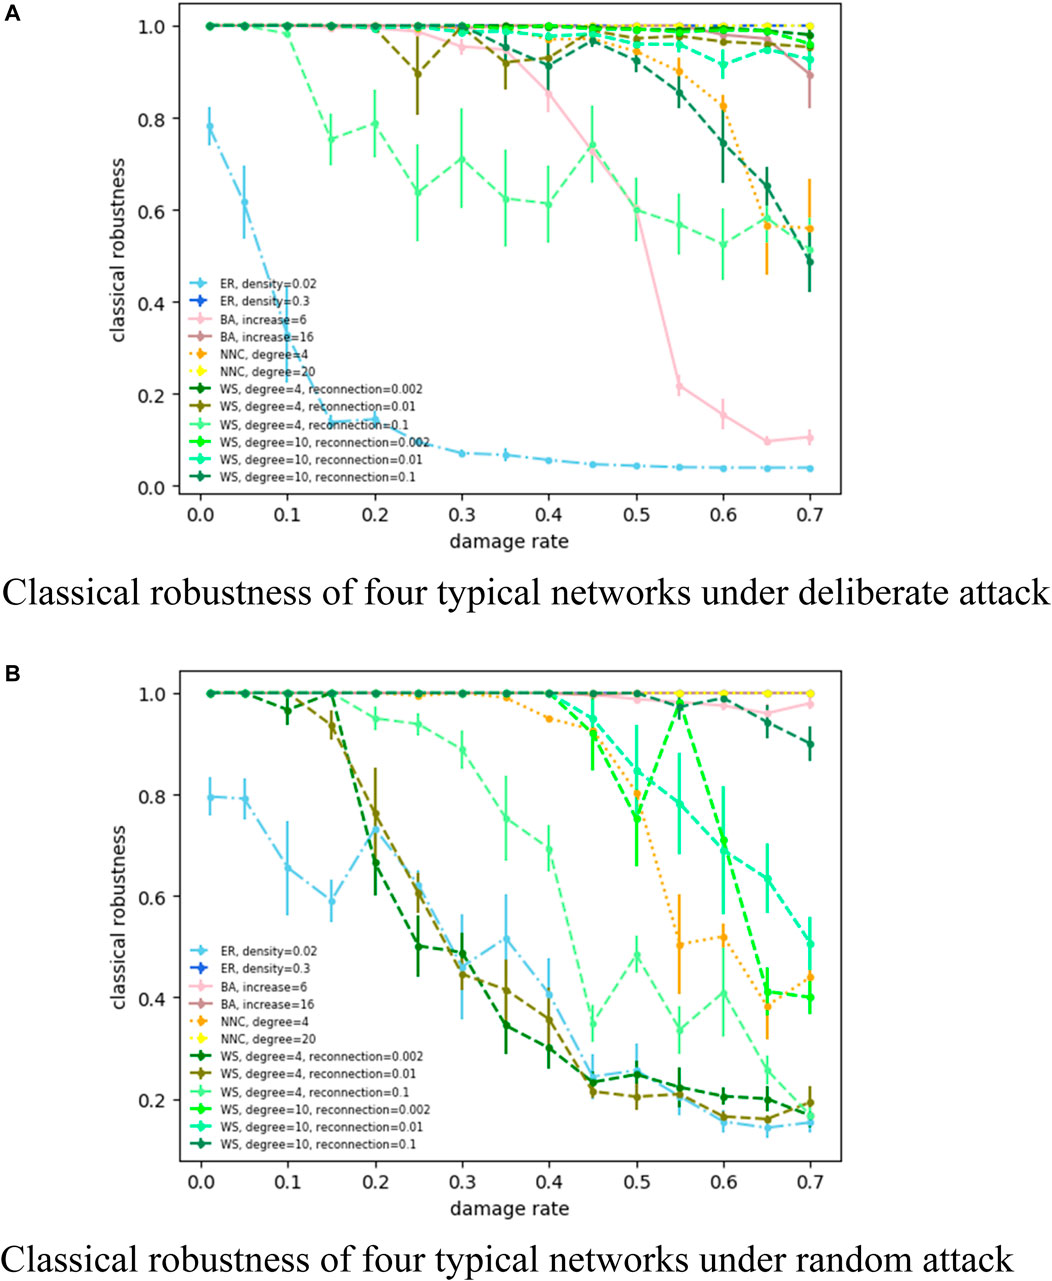
FIGURE 8. (A) Classical robustness of four typical networks under deliberate attack. (B) Classical robustness of four typical networks under random attack.
Figure 8A shows how the classical robustness indicator changes under a deliberate attack. It can be seen that similar to flow capacity robustness, the robustness of a small-density ER random network (network density = 0.02) is relatively poor, and as network density increases, the network robustness increases. Compared with a small increase rate (increase rate = 6), a BA scale-free network is more robust at a large increase rate (increase rate = 16). The robustness of the NNC regular network is also stronger at a large average degree. The reconnection probability of a WS small-world network has little effect on network robustness, while the network average degree has a more significant impact on robustness, with the higher the average degree, the stronger is the robustness. For a random attack (Figure 8B), the classical robustness indicator shows a similar pattern of variation, that is, high network density is stronger than low network density (ER random network), high increase rate is stronger than low increase rate (BA scale-free network), and high network average degree is stronger than low network average degree (NNC regular network, WS small-world network). Compared to the results of flow capacity robustness (Figure 7), due to the different standards of the indicators, the result curves of robustness are not exactly the same, but the trend in relative magnitude of network robustness is basically consistent. This also demonstrates the reasonableness of our method compared with the classical robustness indicator. Figure 8 shows how the classical robustness indicator of several representative network parameters changes with the increase in the node damage rate under deliberate and random attacks.
Analysis of Experimental Results of the Flow Recovery Robustness
We still use two attack strategies, deliberate and random attacks, and the node recovery strategy is based on the non-global information: nodes
Program Network Recovery
Dim is Adjacent As Boolean
For
For
If is Adjacent (
add node
add edge {
End If
End For
End For
End Network Recovery
Figure 9 shows the flow recovery robustness indicator, and its difference varies with the change in the node damage rate and growth rate for the BA scale-free network of size 100. It can be seen that the recovered network flow shows similar changes with the increase in the node damage rate under both two attack strategies; that is, when fewer nodes are damaged (damage rate less than 20%), the network resilience is strong, and almost all of the damaged nodes can be recovered. In this study, we call this damage rate “critical damage rate” for the flow recovery robustness, and the damaged network can be fully recovered when the node damage rate is less than or equal to this critical damage rate. As the number of damaged nodes increases, the recovery ability of the network becomes weaker, and the “emergent” phenomenon appears. At the same time, it can be seen that when the number of attacked nodes reaches a large value (the damage rate is around 70%), the network flow recovered from a deliberate attack is less than that from a random attack. The flow recovery robustness difference increases with the increase in the node damage rate, indicating that as the level of network damage increases, the gap between the random attack and deliberate attack in the recovery ability of the network after damage becomes more and more significant.
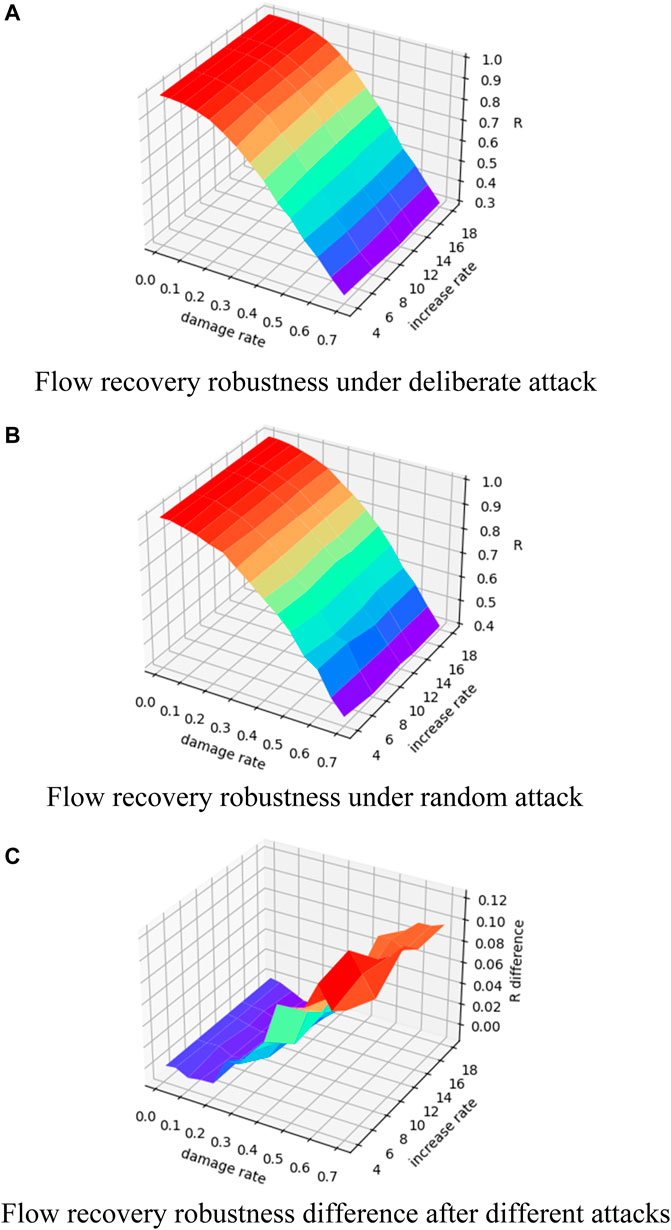
FIGURE 9. Changes of flow recovery robustness of the BA scale-free network. (A) Change in flow recovery robustness under different damage rates and increase rates for BA scale-free network under deliberate attack; (B) change in flow recovery robustness under different damage rates and increase rates for BA scale-free network under random attack; (C) change in the difference between the flow recovery robustness under random attack minus the flow capacity robustness under deliberate attack.
Figure 10 shows the experimental results of the flow recovery robustness of ER random network of size 100 under deliberate and random attacks. The resilience of the network remains strong when the node damage rate is small, and the damaged nodes can be almost fully recovered. As the damage rate increases, the recovered network flow attenuates. In addition, when network density is small (less than 0.1), the number of nodes that cannot be recovered from the initial damage of the ER random network under deliberate attack increases rapidly, that is, the “emergent” phenomenon occurs at the early stage of attack. The flow recovery robustness difference demonstrates the same condition: two attack strategies have a significant difference in the impact of network resilience, that is, a deliberate attack leads to an “emergent” phenomenon in the early stage of damage, but not in a random attack. As the network density increases, the resilience of the ER random network is almost the same for both attacks.
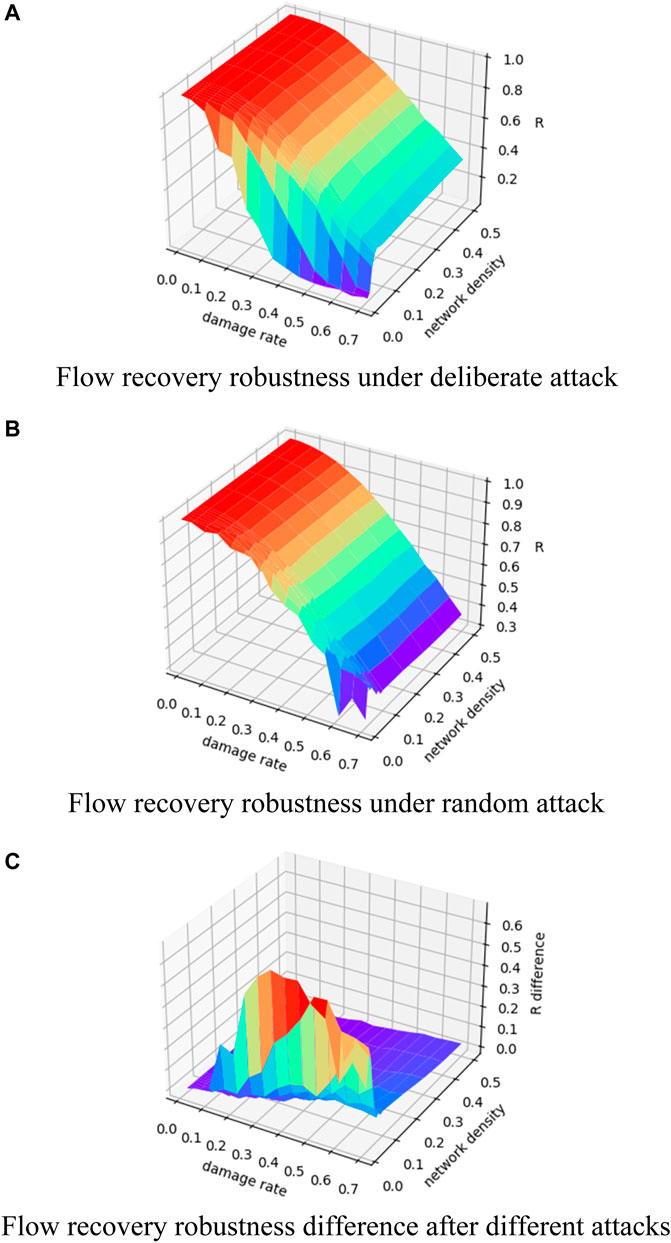
FIGURE 10. Changes in flow recovery robustness of ER random network. (A) Change in flow recovery robustness under different damage rates and network density for ER random network under deliberate attack; (B) change in flow recovery robustness under different damage rates and network density for ER random network under random attack; (C) change in the difference between the flow recovery robustness under random attack minus the flow capacity robustness under deliberate attack.
Figure 11 shows results of the flow recovery robustness for the NNC regular network of size 100. When the network average degree is small, unrecovered nodes increase rapidly at the beginning of damage, showing an “emergent” phenomenon. As a larger average degree, the nodes can recover completely at the initial stage of damage and then the flow recovery robustness begins to decrease smoothly. The flow recovery robustness difference shows that the difference is large only when a small average degree and low damage rate are present at the same time. In other cases, the difference converges to 0, that is, the difference in the impact of the two attack strategies on the network is not significant.
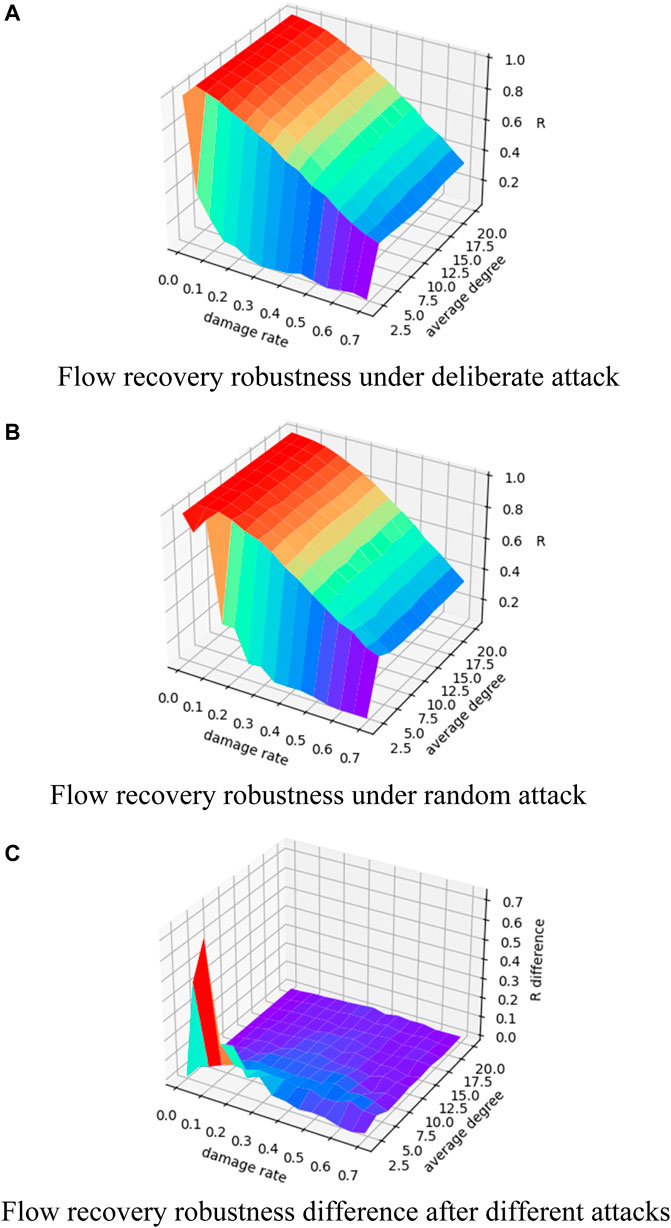
FIGURE 11. Changes in flow recovery robustness of NNC regular network. (A) Change in flow recovery robustness under different damage rates and average degree for NNC regular network under deliberate attack; (B) change in flow recovery robustness under different damage rates and average degree for NNC regular network under random attack; (C) change in the difference between the flow recovery robustness under random attack minus the flow capacity robustness under deliberate attack.
The experimental results of the WS small-world network with fixed mean degree are shown in Figure 12, and we set a network average degree to 10. As the attack level increases, the network recovery flow goes from almost fully recoverable to significantly reduced. We can also find that reconnection probability has almost no effect on the network resilience, especially under random attack. The flow recovery robustness difference also varies with the change in the node damage rate, and there is no significant pattern to follow in the effect of reconnection probability on this difference.
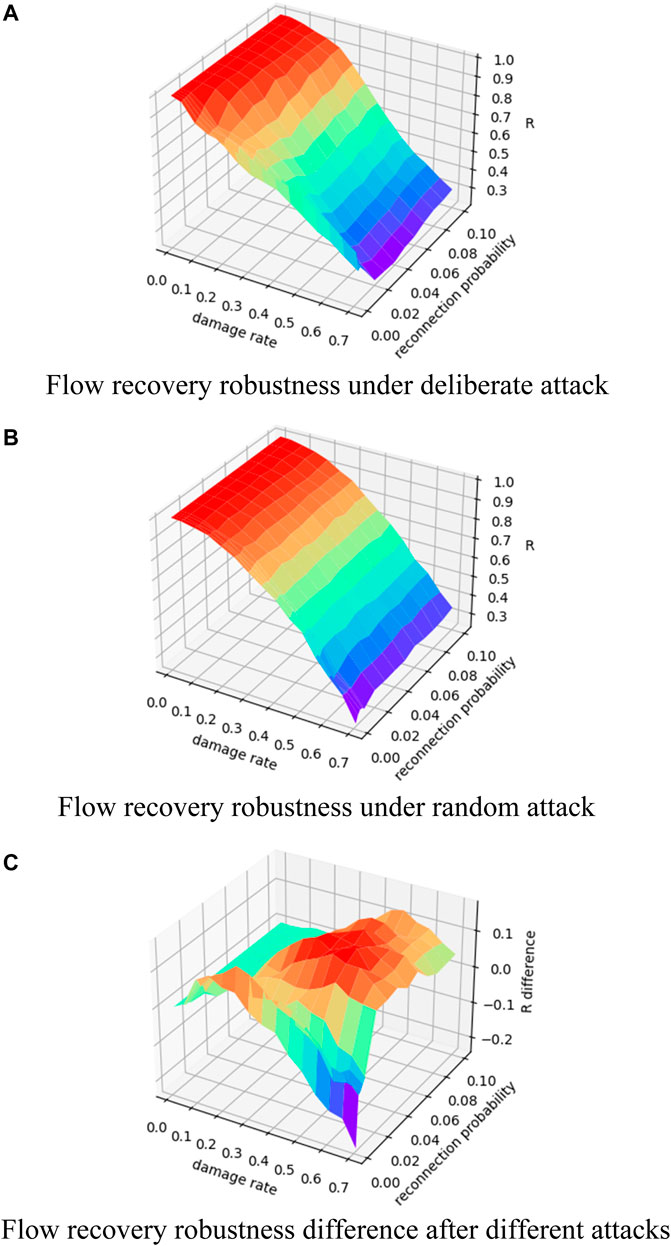
FIGURE 12. Changes of flow recovery robustness of WS small-world network with 10 average degrees. (A) Change in flow recovery robustness under different damage rates and reconnection probability for the WS small-world network with 10 average degrees under deliberate attack; (B) change in flow recovery robustness under different damage rates and reconnection probability for the WS small-world network with 10 average degrees under random attack; (C) change in the difference between the flow recovery robustness under random attack minus the flow capacity robustness under deliberate attack.
Figure 13 shows the experimental results of a WS small-world network with a fixed reconnection probability, which is fixed at 0.1. It can be seen that the resilience of a low–average degree network decreases and is more prone to an “emergent” phenomenon, and during a deliberate attack, as the network average degree increases, the flow recovery robustness shows a downtrend. It can be seen from Figure 13C that when the network average degree is low, the changes of the flow recovery robustness have their own patterns, and after the average degree increases, the difference change shows a certain pattern, that is, the change is more stable.
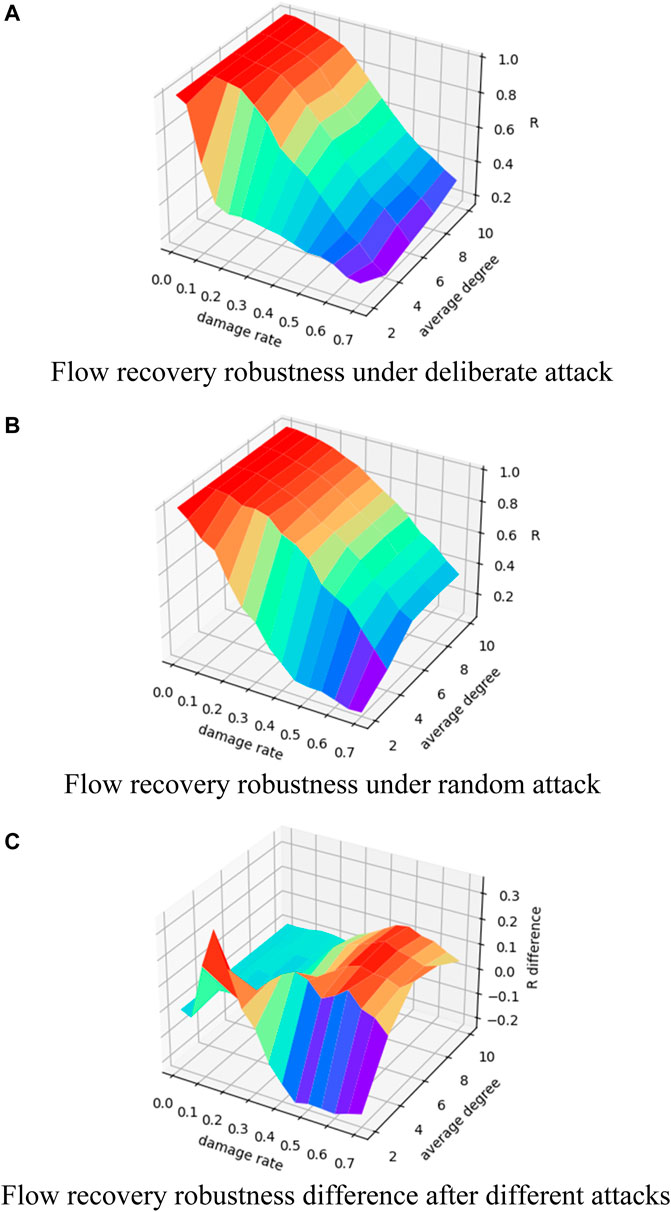
FIGURE 13. Changes in flow recovery robustness of a WS small-world network with 0.1 reconnection probability. (A) Change in flow recovery robustness under different damage rates and average degree for the WS small-world network with 0.1 reconnection probability under deliberate attack; (B) change in flow recovery robustness under different damage rates and average degree for the WS small-world network with 0.1 reconnection probability under random attack; (C) change in the difference between the flow recovery robustness under random attack minus the flow capacity robustness under deliberate attack.
Next, Figure 14 shows the changes of the flow recovery robustness indicator for the network with different parameters. In case of a deliberate attack (Figure 14A), for ER random networks, the low-density network is more unstable than the high-density network in terms of network resilience. Specifically, the flow recovery robustness of the low-density network shows a rapid decline in the early stage, while the recovery ability of the high-density network is almost 100% until the damage rate reaches the critical value (20%), and the flow recovery robustness decreases smoothly after exceeding the critical damage rate. The BA scale-free network, on the other hand, presents an almost coincident resilience with an ER random network of higher density (network density = 0.3), and it can be seen that the growth rate does not have much influence on the flow recovery robustness of the BA scale-free network. The recovery capability of the NNC regular network also shows a steady decrease with the increase in damage rate, and there is no critical damage rate in the NNC regular network, that is, the flow recovery robustness decreases when the network is initially damaged on a small scale (damage rate <20%), especially in the NNC regular network with a small average degree. For the WS small-world network, when the network average degree is fixed, the higher the reconnection probability, the better is the network’s resilience, and there is a corresponding critical damage rate. Conversely, the smaller the reconnection probability, the worse is the recovery capability and there is no corresponding critical damage rate. When the reconnection probability is fixed, the larger is the network average degree, the higher is the flow recovery robustness.
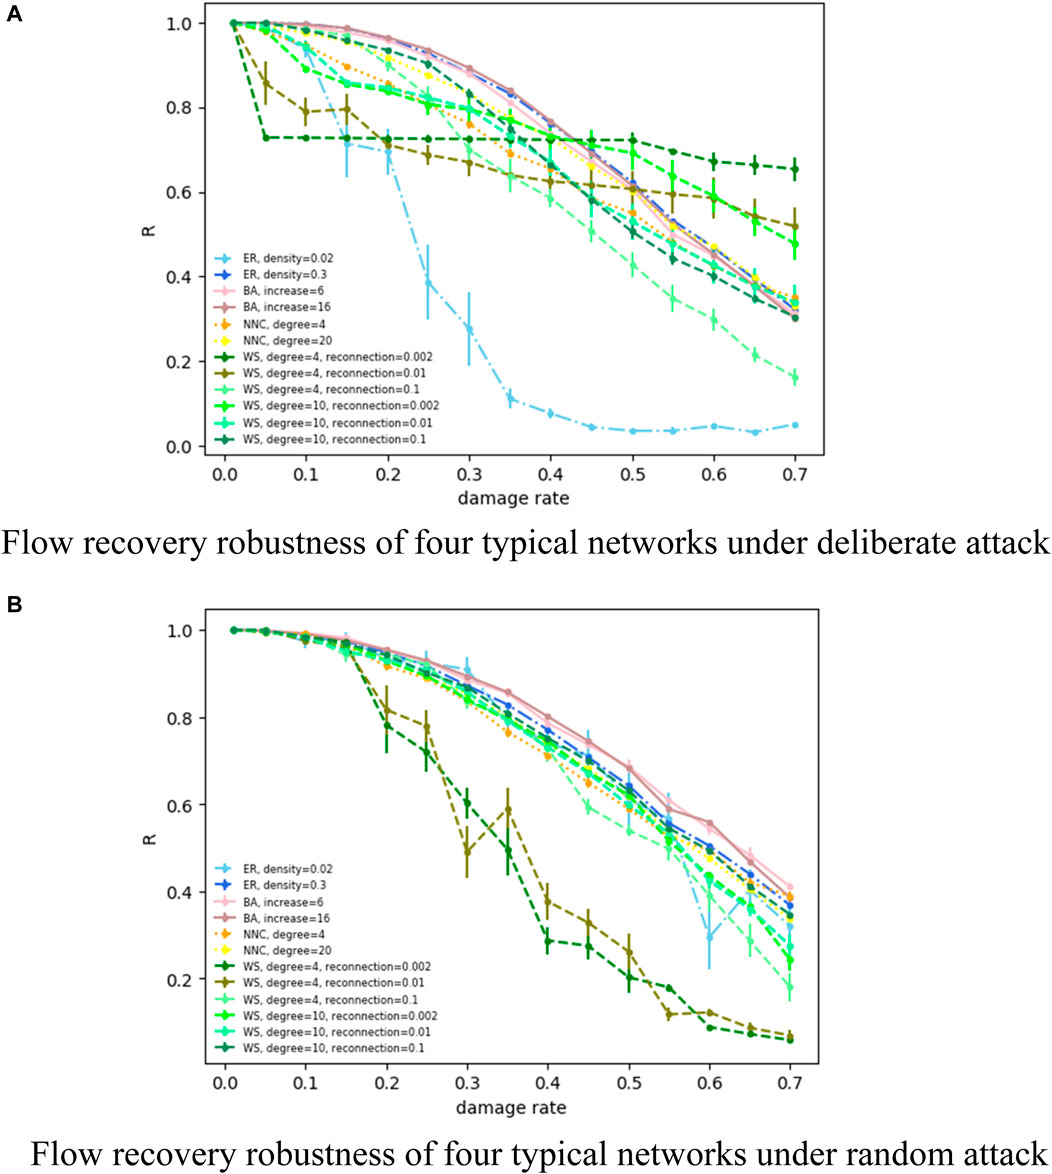
FIGURE 14. (A) Flow recovery robustness of four typical networks under deliberate attack. (B) Flow recovery robustness of four typical networks under random attack.
During a random attack (Figure 14B), the ER random network does not appear as an “emergent” phenomenon similar to the rapid decrease in network recovery ability during a deliberate attack and has a corresponding critical damage rate, regardless of network density. The BA scale-free network shows a steady decline after critical damage rate is reached, and the growth rate does not have a significant impact on recovery ability. Similarly, the NNC regular network shows a trend of strong recovery ability in the early stage and a steady decline in the later stage, and the greater the average network degree, the greater is the flow recovery robustness. For the WS small-world network, the overall trend of the flow recovery robustness is more stable than for deliberate attack, but still, after fixing the network average degree, the flow recovery robustness increases as reconnection probability increases, and the change in resilience is more stable for the network with higher reconnection probability; after fixing reconnection probability, the network average degree increases, and the network’s resilience is enhanced, and the change of the flow recovery robustness is smoother for the network with a larger average degree. It can be seen that a small rebound in the flow recovery robustness during random attack occurs. It is normal for a small rebound to occur because the latter of two adjacent attacks does not based on the previous one but randomly damages a certain percentage of nodes again.
Figure 14 shows how the flow recovery robustness indicator of several representative network parameters changes with the increase in the node damage rate under deliberate and random attacks. Finally, in order to verify the effectiveness of the recovery strategy in this study, we make the difference between the flow recovery robustness and the flow capacity robustness, which is intended to consider the difference between the network flows after network recovery and before recovery. As can be seen from Figure 15, the flow recovery robustness after recovery is greater than the flow capacity robustness before recovery in varying levels for all four typical networks, whether under a deliberate or random attack, which reflects the effectiveness of the recovery strategy based on non-global information.
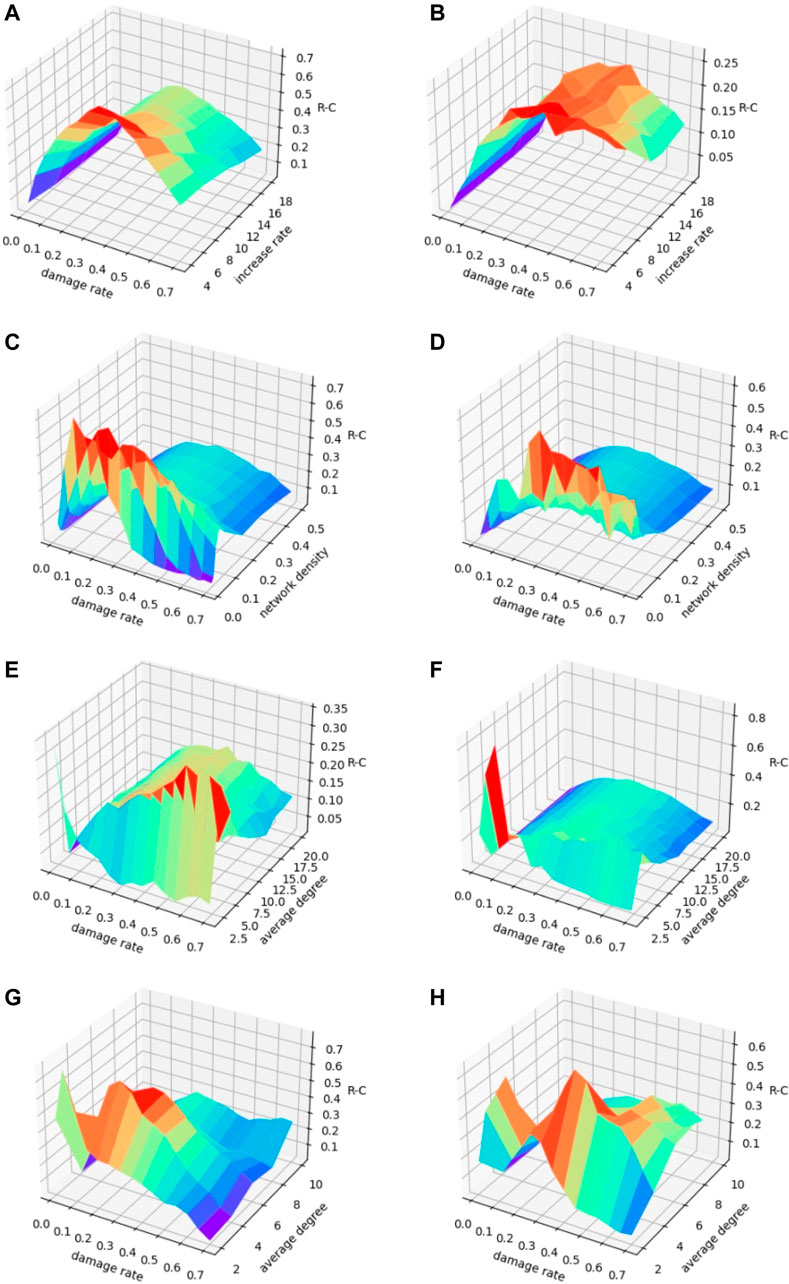
FIGURE 15. Difference between the flow recovery robustness and the flow capacity robustness of four typical networks. (A, B), respectively, show the difference between the flow recovery robustness and the flow capacity robustness in BA scale-free network under deliberate attack and random attack; (C, D), respectively, show the difference between the flow recovery robustness and the flow capacity robustness in ER random network under deliberate attack and random attack; (E, F), respectively, show the difference between the flow recovery robustness and the flow capacity robustness in the NNC regular network under deliberate attack and random attack; (G, H), respectively, show the difference between the flow recovery robustness and the flow capacity robustness in the WS small-world network under deliberate attack and random attack.
Discussion
In this study, we define two types of robustness evaluation indicators based on network maximum flow: the flow capacity robustness, which assesses the ability of the network to resist attack, and the flow recovery robustness, which assesses the ability to rebuild the network after an attack on the network. In order to verify the effectiveness of the proposed robustness evaluation indicators, this study conducts experimental analysis on four typical networks, and the experimental results show that after ER random network is attacked, the high-density network outperforms the low-density network in terms of connectivity and resilience; network growth rate of the BA scale-free network does not have a significant effect on robustness changes in most cases; robustness of the NNC regular network decreases steadily as the node damage rate increases, and the greater the average degree, the greater is the robustness; for the WS small-world network, when we fix the network average degree, the larger the reconnection probability, the better is the connectivity and recovery ability of the network after attack, and when we fix reconnection probability, the bigger the network average degree, the greater is the robustness. When examining the flow recovery robustness, we find that there is a critical damage rate (nodes and edges that are damaged can be almost completely recovered when the node damage rate is less than this critical value), and the critical damage rate is located around 20%. In addition, the decline in robustness based on network maximum flow not only appears an “emergent” phenomenon as the number of attacked nodes increases but also presents a certain “emergent” phenomenon with the change in network structure parameters. Finally, this study also verifies the effectiveness of our adopted non-global information-based recovery strategy for attacked network through difference values between the flow recovery robustness and the flow capacity robustness. The flow capacity robustness and the flow recovery robustness based on network maximum flow proposed in this study enrich the network structure indicator system and more comprehensively describe structural stability of real networks such as interpersonal networks and Internet. The main work in this study focuses on the design of two types of the robustness evaluation indicators based on network maximum flow and the experimental characterization of typical networks, and more in-depth theoretical analysis and quantitative description are the main elements of the subsequent study. Furthermore, we will try to extend our method from static networks to dynamic networks. Methods that have been used to deal with dynamic networks include exponential random graph models [42], stochastic block models [43, 44], continuous latent space models [44, 45], latent feature models [46, 47], and majority dynamics [48]. We will extend our indicators to dynamic networks by referring to existing methods.
Data Availability Statement
The raw data supporting the conclusions of this article will be made available by the authors, without undue reservation.
Author Contributions
MC conceived and put forward the research ideas and carried out the research. JL and YC were in charge of the calculation and experimental data. MC, JL, and YC collected information and wrote the manuscript. All authors have read and agreed to the published version of the manuscript.
Funding
This research was funded by the National Natural Science Foundation of China under Grant No. 71501153, the Innovation Capability Support Project of Shaanxi Province of China under Grant No. 2021KRM135, the Research Fund of Grand Theory and Practical Problem in Philosophy and Social Science of Shaanxi Province of China under Grant No. 2021ND0221, and the Research Fund of the Education Department of Shaanxi Province of China under Grant No. 20JG020.
Conflict of Interest
The authors declare that the research was conducted in the absence of any commercial or financial relationships that could be construed as a potential conflict of interest.
Publisher’s Note
All claims expressed in this article are solely those of the authors and do not necessarily represent those of their affiliated organizations, or those of the publisher, the editors, and the reviewers. Any product that may be evaluated in this article, or claim that may be made by its manufacturer, is not guaranteed or endorsed by the publisher.
References
1. Liu X-M. Research on the Robustness and Controllability of Complex Networks. Wuhan, China: Huazhong University of Science & Technology (2016).
2. Jie J. Study of Robustness in the World. J Syst Eng (2005) 2:153–9. doi:10.3969/j.issn.1000-5781.2005.02.009
3. Albert R, Jeong H, Barabási A-L. Error and Attack Tolerance of Complex Networks. Nature (2000) 406(6794):378–82. doi:10.1016/j.physa.2004.04.03110.1038/35019019
4. Holme P, Kim BJ, Yoon CN, Han SK. Attack Vulnerability of Complex Networks. Phys Rev E (2002) 65(5):056109. doi:10.1103/PhysRevE.65.056109
5. Paul G, Tanizawa T, Havlin S, Stanley HE. Optimization of Robustness of Complex Networks. Eur Phys J B (2004) 38:187–91. doi:10.1140/epjb/e2004-00112-3
6. He C-Q. Research on Robustness during Network Evolution. Shanghai, China: Shanghai Jiaotong University (2009).
7. Du W, Cai M, Du H-F. Study on Indices of Network Structure Robustness and Their Application. J Xi’an Jiaotong Univ (2010) 44(4):93–7.
8. Lu P-L, Dong M, Cao L. Analysis of Influence of Clustering Coefficient as its index on Robustness of Complex Network. J Lanzhou Univ Technol (2019) 45(3):101–7.
9. Zhang J-Y. Robust Analysis of Urban Road Network under Different Attack Conditions. Dalian, China: Dalian Jiaotong University (2020).
10. Dorogovtsev SN, Goltsev AV, Mendes JFF. K-Core Organization of Complex Networks. Phys Rev Lett (2006) 96:040601. doi:10.1103/PhysRevLett.96.040601
11. Morone F, Del Ferraro G, Makse HA. The K-Core as a Predictor of Structural Collapse in Mutualistic Ecosystems. Nat Phys (2019) 15:95–102. doi:10.1038/s41567-018-0304-8
12. Liu Y-Y, Csóka E, Zhou H, Pósfai M. Core Percolation on Complex Networks. Phys Rev Lett (2012) 109:205703. doi:10.1103/PhysRevLett.109.205703
13. Shang Y. Attack Robustness and Stability of Generalized K-Cores. New J Phys (2019) 21:093013. doi:10.1088/1367-2630/ab3d7c
14. Shang Y-L. Generalized K -cores of Networks under Attack with Limited Knowledge. Chaos Solitons Fractals (2021) 152:111305. doi:10.1016/j.chaos.2021.111305
15. Dorogovtsev SN, Mendes JFF, Samukhin AN. Giant Strongly Connected Component of Directed Networks. Phys Rev E (2001) 64(2 Pt 2):025101. doi:10.1103/PhysRevE.64.025101
16. Panduranga NK, Gao J, Yuan X, Stanley HE, Havlin S. Generalized Model for K -Core Percolation and Interdependent Networks. Phys Rev E (2017) 96(3-1):032317. doi:10.1103/PhysRevE.96.032317
17. Linton CF, Stephen PB, Douglas RW. Centrality in Valued Graphs: a Measure of Betweenness Based on Network Flow. Soc Networks (1992) 13(2):141–54. doi:10.1016/0378-8733(91)90017-N
18. Shang Y. Vulnerability of Networks: Fractional Percolation on Random Graphs. Phys Rev E Stat Nonlin Soft Matter Phys (2014) 89(1):012813. doi:10.1103/physreve.89.01281342
19. Cohen R, Erez K, Ben-Avraham D, Havlin S. Resilience of the Internet to Random Breakdowns. Phys Rev Lett (2000) 85(21):4626–8. doi:10.1103/PhysRevLett.85.4626
20. Cohen R, Erez K, Ben-Avraham D, Havlin S. Breakdown of the Internet under Intentional Attack. Phys Rev Lett (2001) 86:3682–5. doi:10.1103/PhysRevLett.86.3682
21. Scott DM, Novak DC, Aultman-Hall L, Guo F. Network Robustness index: a New Method for Identifying Critical Links and Evaluating the Performance of Transportation Networks. J Transport Geogr (2006) 14(3):215–27. doi:10.1016/j.jtrangeo.2005.10.003
22. Tan Y-J, Wu J, Deng H-Z, Zhu D-Z. Invulnerability of Complex Networks: a Survey. Syst Eng (2006) 10:1–5.
23. Lu S. Robust Analysis of Aviation Logistics System Based on Complex Network Theory. Changchun, China: Jilin University (2014).
24. Dong G, Chen Y, Wang F, Du R, Tian L, Stanley HE. Robustness on Interdependent Networks with a Multiple-To-Multiple Dependent Relationship. Chaos (2019) 29(7):073107. doi:10.1063/1.5093074
25. Shi H. Invulnerability Estimation Model of Buildings with Complex Networks under strong Earthquakes. China Earthquake Eng J (2017) 39(6):1024–8.
26. Dong G, Wang F, Shekhtman LM, Danziger MM, Fan J, Du R, et al. Optimal Resilience of Modular Interacting Networks. Proc Natl Acad Sci USA (2021) 118(22):e1922831118. doi:10.1073/pnas.1922831118
27. Mariani MS, Ren Z-M, Bascompte J, Tessone CJ. Nestedness in Complex Networks: Observation, Emergence, and Implications. Phys Rep (2019) 813:1–90. doi:10.1016/j.physrep.2019.04.001
28. Wuellner DR, Roy S, D’Souza RM. Resilience and Rewiring of the Passenger Airline Networks in the United States. Phys Rev E (2010) 82(5):056101. doi:10.1103/PhysRevE.82.056101
29. Liu Y, Sanhedrai H, Dong G, Shekhtman LM, Wang F, Buldyrev SV, et al. Efficient Network Immunization under Limited Knowledge. Natl Sci Rev (2021) 8(1):nwaa229. doi:10.1093/nsr/nwaa229
30. McDaniels T, Chang S, Cole D, Mikawoz J, Longstaff H. Fostering Resilience to Extreme Events within Infrastructure Systems: Characterizing Decision Contexts for Mitigation and Adaptation. Glob Environ Change (2008) 18(2):310–8. doi:10.1016/j.gloenvcha.2008.03.001
31. van der Vegt GS, Essens P, Wahlström M, George G. Managing Risk and Resilience. Amj (2015) 58(4):971–80. doi:10.5465/amj.2015.4004
32. Bai Y-N, Huang N, Sun L-N, Zhang Y (2017). “Failure Propagation of Dependency Networks with Recovery Mechanism,” In: 2017 Annual Reliability and Maintainability Symposium (RAMS), Orlando, FL, January 23–26, 2017 (IEEE), 1–6. doi:10.1109/RAM.2017.7889721
33. Liu R-R, Li M, Jia C-X. Cascading Failures in Coupled Networks: the Critical Role of Node-Coupling Strength across Networks. Sci Rep (2016) 6:35352. doi:10.1038/srep35352
34. Hong S, Lv C, Zhao T, Wang B, Wang J, Zhu J. Cascading Failure Analysis and Restoration Strategy in an Interdependent Network. J Phys A: Math Theor (2016) 49(19):195101–12. doi:10.1088/1751-8113/49/19/195101
35. Wang L-X. Study on Key Fault Node Location and Recovery Technology in Complex Networks. Xi'an, China: Xidian University (2019).
36. Li Zhao Z, Guo Yan-Hui Y-H, Xu Guo-Ai G-A, Hu Zheng-Ming Z-M. Analysis of Cascading Dynamics in Complex Networks with an Emergency Recovery Mechanism. wlxb (2014) 63(15):158901–428. doi:10.7498/aps.63.158901
37. Bohannon J. Counterterrorism's New Tool: 'Metanetwork' Analysis. Science (2009) 325(5939):409–11. doi:10.1126/science.325-40910.1126/science.325_409
38. Wang X-F, Li X, Chen G-R. Complex Network Theory and Application. Beijing: Tsinghua University Press (2006). p. 18.
39. Barabási A-L, Albert R. Emergence of Scaling in Random Networks. Science (1999) 286(5439):509–12. doi:10.1126/science.286.5439.509
40. Erdös P, Rényi A. (2011). On The Evolution of Random Graphs. The Structure and Dynamics of Networks. New Jersey, US: Princeton University Press, 38–82. doi:10.1515/9781400841356.38
41. Watts DJ, Strogatz SH. Collective Dynamics of 'small-World' Networks. Nature (1998) 393(6684):440–2. doi:10.1038/30918
42. Guo F, Hanneke S, Fu W-J, Xing EP(2007). “Recovering Temporally Rewiring Networks: A Model-Based Approach,” In: Proceedings of the 24th International Conference on Machine Learning, Corvallis, USA, January 1, 2007, 321–8.
43. Xing EP, Fu W, Song L. A State-Space Mixed Membership Blockmodel for Dynamic Network Tomography. Ann Appl Stat (2010) 4(2):536–66. doi:10.1214/09-AOAS311
44. Hoff PD. Hierarchical Multilinear Models for Multiway Data. Comput Stat Data Anal (2011) 55(1):530–43. doi:10.1016/j.csda.2010.05.020
45. Sarkar P, Moore AW. Dynamic Social Network Analysis Using Latent Space Models. SIGKDD Explor Newsl (2005) 7(2):31–40. doi:10.1145/1117454.1117459
46. Heaukulani C, Ghahramani Z (2013). “Dynamic Probabilistic Models for Latent Feature Propagation in Social Networks,” In: Proceedings of the 30th International Conference on Machine Learning, Atlanta, US, June 16, 2013, 28, 275–83.
47. Kim M, Leskovec J. Nonparametric Multi-Group Membership Model for Dynamic Networks. Adv Neural Inf Process Syst (2013) 25:1385–93.
Keywords: network robustness, maximum flow, connectivity, resilience, critical damage rate
Citation: Cai M, Liu J and Cui Y (2021) Network Robustness Analysis Based on Maximum Flow. Front. Phys. 9:792410. doi: 10.3389/fphy.2021.792410
Received: 10 October 2021; Accepted: 29 November 2021;
Published: 20 December 2021.
Edited by:
Gaogao Dong, Jiangsu University, ChinaReviewed by:
Guangquan Xu, Tianjin University, ChinaYilun Shang, Northumbria University, United Kingdom
Copyright © 2021 Cai, Liu and Cui. This is an open-access article distributed under the terms of the Creative Commons Attribution License (CC BY). The use, distribution or reproduction in other forums is permitted, provided the original author(s) and the copyright owner(s) are credited and that the original publication in this journal is cited, in accordance with accepted academic practice. No use, distribution or reproduction is permitted which does not comply with these terms.
*Correspondence: Meng Cai, bWVuZ2NhaUBtYWlsLnhqdHUuZWR1LmNu
 Meng Cai
 Jiaqi Liu
 Ying Cui