 Tong Zhu
 Chenyang Liao2
- 1Tongji University College of Electronic and Information Engineering, Shanghai, China
- 2The Third Research Institute of the Ministry of Public Security, Shanghai, China
This paper proposes a new definition method of currency, which further divides the current hot digital currency according to its legitimacy, encryption, centralization, and other characteristics. Among these, we are mainly interested in virtual cryptocurrencies. Virtual cryptocurrency is one of the application directions of blockchain technology. Its essence is a distributed shared ledger database, which generally has the characteristics of decentralization and non-tampering. The technologies supporting the practical application of virtual cryptocurrencies involve multiple scientific and technological fields such as mathematical algorithms, cryptography, Internet communication, and computer software. Since the launch of the first virtual cryptocurrency bitcoin in 2009, it has developed rapidly worldwide. As of August 1, 2021, more than 11,570 virtual cryptocurrencies have been publicly issued and traded globally, with a total value of over \$1.68 trillion. This paper proposes the virtual cryptocurrency trading popularity value system as a standardized index for quantitative analysis of virtual cryptocurrency trading, and the virtual cryptocurrency trading index system as a barometer of the virtual cryptocurrency trading market. It has contributed schemes to the analysis of the market rules of virtual cryptocurrency transactions and the realization and early warning of abnormal virtual cryptocurrency transactions, which are the two main hot research directions of virtual cryptocurrency. To be specific, the popularity value of virtual cryptocurrency transactions provides parameters for analyzing individual virtual cryptocurrencies, and the popularity index of virtual cryptocurrency transactions provides parameters for analyzing the virtual cryptocurrency trading market, so as to prevent major risks of virtual cryptocurrency transactions.
Introduction
In October 2008, Satoshi Nakamoto published “Bitcoin: A Peer-to-Peer Electronic Cash System,” introducing people to a digital currency called bitcoin. On January 12, 2009, bitcoin made its first transaction. Since then, digital finance, especially virtual cryptocurrency, has gradually become one of the most important application scenarios of Blockchain Technology (BT) worldwide. At the same time, the volume of virtual cryptocurrency issuance is growing rapidly around the world. As of midnight on August 1, 2021, more than 689,000 bitcoin blocks have been mined, with a total circulating market value of about \$750 billion. According to the public data of Coinbase (the first bitcoin exchange with formal license in the USA, listed on NASDAQ) and other exchange websites, as of midnight on August 1, 2021, there are 625 public trading platforms in the world, and more than 11,570 virtual cryptocurrencies are publicly issued and traded. Among them, 5,408 are still actively traded, and the total market value of publicly issued and traded virtual cryptocurrencies exceeds \$1.68 trillion.
The continuous innovation and development of digital information technology has accelerated the social process and profoundly influenced the trend of human civilization. Since the advent of virtual cryptocurrencies, combined with the characteristics of blockchain, the transaction mode itself has the characteristics of decentralization, anonymity, multiple currencies, large amount, volatility, difficult to regulate, and so on, resulting in a variety of abnormal transactions. Moreover, there are also abnormal transactions caused by security vulnerabilities such as block bifurcation and theft of numbers and coins.
The main contributions of this paper are briefly summarized as follows:
1) This paper reconstructs the theoretical system of currency definition, reclassifies digital currency, and puts forward a set of definitions mainly applicable to digital currency.
2) This paper will put forward a popularity value system and its algorithm that are actually applied to virtual cryptocurrency, which will help in the field of social public security and effectively enrich the existing virtual cryptocurrency theory.
3) Based on the market data of virtual cryptocurrency as the support, this paper applies the latest research results in the field of artificial intelligence technology to realize the abnormal warning algorithm model of virtual cryptocurrency.
The remainder of the paper is organized as follows: Theoretical System of Abnormal Transaction of Virtual Cryptocurrency section introduces the theoretical system of abnormal transaction of virtual cryptocurrency proposed by us. In Analysis of Abnormal Transaction Situation Based on Virtual Cryptocurrency Popularity Value System section, based on the popular value system of virtual cryptocurrency, this paper designs two algorithms to realize the situation analysis of abnormal transactions of virtual cryptocurrency, and verifies the virtual cryptocurrency market data from 0:00 to 24:00 on August 3, 2021. Conclusion section presents our conclusions and avenues of future research.
Theoretical System of Abnormal Transaction of Virtual Cryptocurrency
The Concept and Definition of Digital Currency, Electronic Currency, and Virtual Currency
There is still no clear authoritative academic definition of the concept of virtual cryptocurrency at home and abroad. Digital Currency, Virtual Currency, Cryptocurrency, Electronic Money, etc., are mostly used to refer to bitcoin-like things. It is urgent to clarify the concepts of digital currency, virtual currency, cryptocurrency, electronic currency, and so on for the same research object by referring to various literature materials. For example, literature [1] puts forward research on the exploration of gold standard credit currency and digital currency, and uses the concept of digital currency to explore the current monetary system and the diversified monetary system of combined gold standard system. Literature [2] proposed that the COMMODITY Futures Trading Commission of the United States issued a consultation on the underwriting scheme of virtual currency, and used the concept of virtual currency to give hints and warnings on how to avoid the potential trading risks of fraud. Literature [3] proposed a study on the fluctuation of cryptocurrency transaction price and investor attention, and used the concept of cryptocurrency to analyze the relationship between investor attention and transaction volatility based on a large data set of about 25 million users. Literature [4] proposed empirical evidence from Indonesia to study the influence of quality and price on the loyalty of Electronic Money users, and the concept of Electronic Money was studied based on the sample of 400 people and model variables on the influence of server reliability and security on the final benefit.
The same concept, at present, also needs to clearly define its scope. For example, before Bitcoin, network game currency is also known as a virtual currency, and at the same time there is a virtual game currency trading at home and abroad research, such as the literature [5] the study of online game virtual currency trading revenue recognition and document [6] the study of digital game virtual currency trading, that also use the concept of virtual currency.
Based on a large number of literature materials, many foreign literatures refer to Bitcoin cryptocurrencies from a technical perspective. From a practical point of view, many domestic literatures call Bitcoin virtual currencies to distinguish it from legal tender. Based on the dual attributes of practicality and technology, this paper calls Bitcoin and other virtual cryptocurrencies. Based on the full absorption of current domestic research results and the development status of cryptocurrencies at home and abroad, the following definitions are proposed: 1) Commodity Currency is a commodity that has value and physical form, which can be traded as an exchange for equivalent value. 2) Digital Currency (DC) is a currency that shows its value attribute in the digital form and corresponds to the commodity currency. It generally refers to all currencies that exist in digital form and can be used as means of payment. It is a general term for electronic money and virtual currency. 3) Electronic Money (Official Digital Currency) is official digital money. Electronic money is a digitized form of fiat money, equivalent to fiat money, for example, electronic money stored in the form of magnetic cards, central bank digital money, and so on. 4) Virtual Currency (Unofficial Digital Currency) is unofficial digital currency. Virtual cryptocurrency is a digital currency issued by a non-statutory authority. It is generally used as a means of payment in a specific virtual space on the Internet, but it does not have the status and value of legal tender, such as QQ coins, online game coins, and so on. 5) Cryptocurrency is a digital currency generated based on cryptography and generally encrypted by cryptography in transactions, storage, and payments, such as Bitcoin and central bank digital currency. 6) Virtual Cryptocurrency is cryptocurrency that does not have legal status among digital currencies, including decentralized cryptocurrencies such as Bitcoin and Ethereum, and centralized cryptocurrencies such as USDT.
After giving each currency qualitative, we classify according to its connotation, generation mechanism, and operation principle according to certain classification standards, delimit its boundaries, and get the relationship between each currency, as Figure 1.
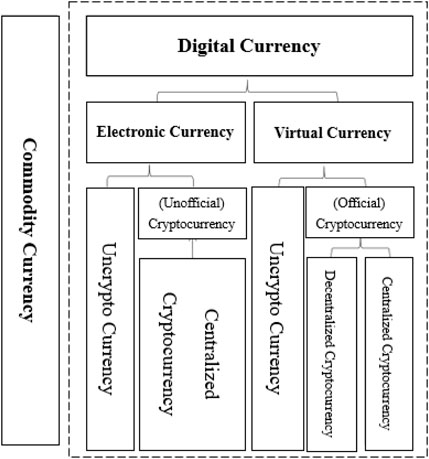
FIGURE 1. Concept and definition of currencies.
The subsequent research of this paper will mainly focus on virtual cryptocurrency.
Development Status of Digital Cryptocurrency
Digital currencies are closely related to blockchain technology [7]. Blockchain is a technology that securely stores transaction records on peer-to-peer networks, rather than storing them at a single site. Blockchain is run by a network of independent servers, called nodes, scattered around the world. The application of blockchain technology has been extended to digital finance, Internet of Things, intelligent manufacturing, supply chain management, digital asset trading, and other fields. At present, major countries around the world are speeding up the layout of blockchain technology development.
Digital currency is the first successful case of blockchain. The characteristics of its decentralization, anonymity, and safety for the user do not depend on banks and other intermediaries, and direct point-to-point trading may provide the biggest advantage to enhance the autonomous control ability of the end user—this in financial history is also a very big change. However, although bitcoin and other digital currencies are also known as money, due to their lack of value connotation and sharp price fluctuations, it is difficult to play the basic functions of money, such as the function of value scale, which makes the current digital currency closer to a financial asset in essence.
With the rapid development of network technology and digital economy, the public’s demand for convenience, security, universality, and privacy of retail payment is increasing day by day. According to the “White paper on the development of China’s Central bank digital currencies” [8] released by the People’s Bank of China in 2021, central banks or monetary authorities in many countries and regions closely follow the development achievements of fintech [9] and actively explore the digital form of legal tender. Legal digital currency is moving from theory to reality.
In the process of the stable development of digital virtual cryptocurrency, non-statutory virtual currency has become a forefront, has a lot of traffic, and has been an extensive concern by speculators, including many speculators through the hype of virtual cryptocurrency to obtain huge profits; the musk is that there is no lack of such capital tycoon and some social celebrities involved, and the platform for them has had a profound impact on the development of virtual cryptocurrencies. The source of virtual cryptocurrency is Bitcoin, also known as virtual cryptocurrency, launched by Satoshi Nakamoto in 2008. Later, on the basis of the currency and virtual encrypted monetary growth development, the etheric fang for the platform of the second generation of virtual cryptocurrency was developed through intelligent core application contract implementation, and now, although only in a few countries, the government expressed support for virtual cryptocurrency, while most of the national governments are in opposition to or are on the sidelines, However, the third generation of virtual cryptocurrencies is still budding. At present, according to incomplete statistics, since the advent of Bitcoin, the private sector has launched a variety of virtual cryptocurrencies, and the online public circulation and issuance of virtual cryptocurrencies has reached more than 10,000, with a total market value of more than \$130 million, and is still increasing at an extremely fast speed.
Research Status of Virtual Cryptocurrency
Virtual cryptocurrencies such as the blockchain technology, P2P technology, and encryption technology, such as hot technology, are declared as “decentralized” and “completely anonymous,” but the lack of value support, price volatility, trading defects such as low efficiency, and large energy consumption limit its hard currency function in our daily life, and at the same time, the virtual cryptocurrency is used for speculation, There are potential risks that threaten financial security and social stability, and it has become a payment tool for illegal economic activities such as money laundering. Virtual cryptocurrency has major defects, and some institutions attempt to launch the so-called “stable currency” by trying to anchor it with sovereign currency to stabilize the currency or related assets, and business plans for global stability of the currency; it will give the international monetary system, the payment and settlement system, and monetary policy, such as cross-border capital flow management, many risks and challenges [10].
At present, many countries in the world are promoting research on virtual cryptocurrency transaction behavior and warning, and analyzing its integration layout with existing economic applications from multiple aspects such as technology and law. For example, literature [11] proposes the investigation and research of the EU’s virtual cryptocurrency regulations on virtual cryptocurrency developers and transaction users; literature [12] studies the impact of Facebook’s launch of Libra virtual cryptocurrency project on financial infrastructure and regulation; literature [13] analyzes the problems and challenges of the cryptocurrency exchange market in India from the perspective of triggering financial risks; literature [14] studies the risks and challenges of virtual cryptocurrency transactions in different jurisdictions and SWIFT transactions; literature [15] studies the virtual cryptocurrencies and gold assets, such as Bitcoins and the diversified investment transactions such as the stock market; literature [16] studies the digital financial assets and the monetary impact on the Russian business transactions in current laws and regulations; literature [17] studies the current stage of the European Union blockchain and virtual cryptocurrency trading regulation, and so on.
At present, the abnormal encryption based on virtual currency trading and warning image data to carry out the relevant analysis is one of the main directions of research hot spots; the researchers are mainly focused on virtual cryptocurrency data exchange through time, frequency, capital flows, the rules of combination of multiple currencies in a variety of ways, and so on, whether virtual cryptocurrency trading volatility and abnormal trading to forecast early warning.
In the analysis based on time, some researchers put forward methods that can improve the accuracy of prediction and warning. Literature [18] is proposed using the Markov switching model window effect of abnormal to virtual cryptocurrency trading to predict warning, by comprehensive research samples within the coefficient and the outside influence on the sample, using the window effect of Markov switching models to predict early warning, and verified in some specific window on the tail that can better realize the precision of forecasting warning. Literature [19] proposed a weighted and pay attention to the memory channel convolution neural network to predict abnormal virtual cryptocurrency trading early warning method, based on the strong correlation between different virtual cryptocurrencies and using the technology of deep learning implementation with a weighted and pay attention to the memory channel convolution neural network model to forecast daily virtual cryptocurrency trading.
In terms of frequency-based analysis methods, some researchers have carried out analysis and prediction of currency transactions of multiple virtual cryptocurrencies. In 2021, Kim et al. proposed to use GARCH and SV random volatility to predict and warn the volatility of abnormal transactions of virtual cryptocurrencies. By studying nine major virtual cryptocurrencies such as Bitcoin, Ethereum, and Bitcoin Cash, the Bayesian Stochastic Volatility (SV) model and GARCH model are implemented to detect trading volatility [20]. Literature [21] proposed a random approximation algorithm and sequence learning method based on volatility dynamics, and proposed a random volatility model with jump return volatility to analyze and warn abnormal transactions of virtual cryptocurrencies. The results proved that these virtual cryptocurrency transactions showed abnormal return fluctuation relationship. Salim Lahmiri et al. proposed to use the method of high frequency trading deep learning to predict and give early warning to virtual cryptocurrency bitcoin trading, and applied the deep forward neural network (DFFNN) to analyze and predict the high frequency trading data of virtual cryptocurrency Bitcoin. Based on this, the influence of standard numerical training algorithm on the accuracy obtained by DFFNN is also studied [22].
In terms of the analysis method based on capital flow, research is carried out on the correlation between capital and abnormal transaction of virtual cryptocurrency. Rahmani et al. drew on the relevant experience of deep learning architecture in financial market prediction and proposed to use deep learning algorithm to predict and give early warning of abnormal capital flow in the direction of virtual cryptocurrency transaction [23]. By constructing LSTM model to predict the daily closing direction of bitcoin and USDT in virtual cryptocurrencies, the researchers also analyzed the accuracy of the model and the risk of trading gains and losses based on the model, and evaluated the impact of MACD index and input matrix dimension on the prediction and warning accuracy.
In terms of analysis methods based on multiple currencies and multiple rule combinations, Kakinaka Shinji et al., based on the asymmetric relationship between price and volatility, is a significant feature of the time series of financial markets. Therefore, they proposed the method of multifractal cross-correlation for virtual cryptocurrency trading and prediction and early warning. Studying these relationships between up-market (bull market) and down-market (bear market) mechanisms in a dynamic way provides a new method for predicting and warning abnormal trading of virtual cryptocurrency [24].
Although some researches on virtual cryptocurrency trading do not directly provide the method of abnormal trading warning, additional variables such as daily return rate, standard deviation, value at risk, conditional value at risk, trading volume, and other dimensions that are very important for the analysis of virtual cryptocurrency trading are introduced. In addition, many innovative methods are proposed for reference in terms of how to analyze the data of virtual cryptocurrency transactions and how to select variables. In literature [25], for example, this paper proposes a virtual encryption based on PROMETHEE II currency trading portfolio selection criterion method, and the model of sample performance with five other kinds commonly used the optimal portfolio model; according to the index of all observed, the proposed model is better than all the other models, where the odds ratio is from 50 to 94%. The literature also suggests the benefits of adopting more currency standards and an appropriate multi-parameter approach in the analysis and selection process of virtual cryptocurrency transaction data.
Some researchers also provide abnormal transaction warning methods of virtual cryptocurrency from other useful perspectives by choosing different data dimensions. For example, in 2021, Kądziołka Kinga proposed a multi-criteria evaluation method for virtual cryptocurrency exchange based on PROMETHEE II and taxonomy with the analysis of the available data published on the Internet website by hierarchical clustering with k-means algorithm [26]. This method can also be used as a supplement to multi-dimensional evaluation of abnormal transaction warning of virtual cryptocurrency.
Based on the stock market index method, this paper innovatively proposes an abnormal movement warning algorithm based on the popularity value system of virtual cryptocurrency. By referring to the sequence similarity comparison algorithm in the field of speech recognition and biological information, the sequence similarity comparison algorithm is improved as an abnormal detection algorithm of virtual cryptocurrency. It provides a new idea for the study of abnormal warning of virtual cryptocurrency.
The Overall Model of Abnormal Transaction of Virtual Cryptocurrency
Virtual cryptocurrency anomaly detection and early-warning star-moon value model is shown in Figure 2. Based on current research results at home and abroad [27–29], this model organically combines the definition, research, and early warning of virtual cryptocurrency anomalies into an overall model.
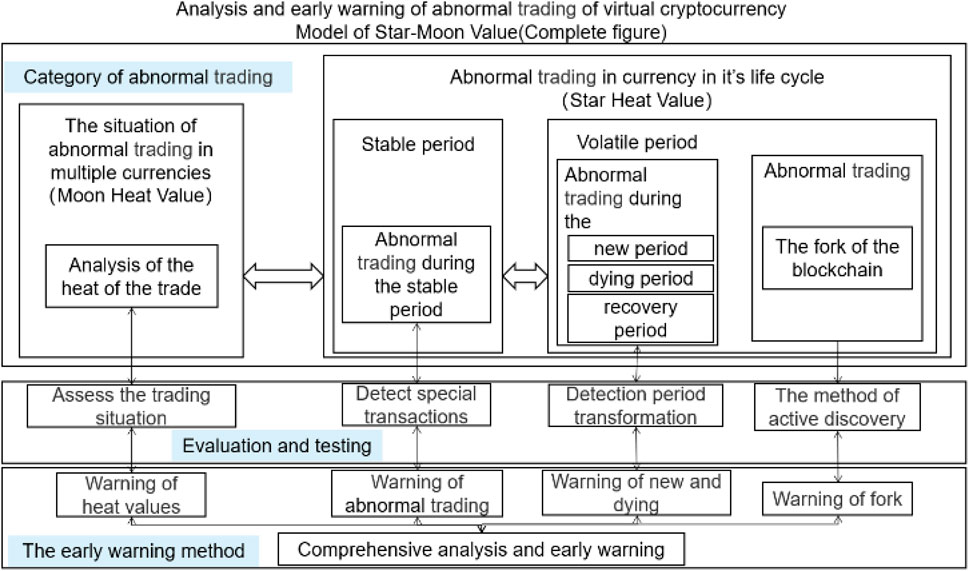
FIGURE 2. Stellaluna value model for anomaly analysis and warning of virtual cryptocurrency.
Normally, in the whole currency virtual cryptocurrencies trading environment, we can think of the influence of external factors on the overall virtual cryptocurrency in a fair level, then we can pass the current transaction data and compare them with the historical transaction data analysis, and calculate the current external factors’ impact on the virtual cryptocurrency trading situation; this is the “virtual cryptocurrency popularity value”. Based on the change of this popularity value, abnormal transactions of virtual cryptocurrency can be further detected and warned. In the case of a single virtual cryptocurrency trading to multi-currency virtual cryptocurrency “trading popularity value” as a “background noise,” a single virtual cryptocurrency is determined based on the elimination of “background noise” transaction in which life cycle stage integrated different life cycle phase virtual cryptocurrency, which, according to the general characteristics of virtual cryptocurrency trading, abnormal transaction behaviors are more likely to occur in the emerging period, extinction period, and recovery period. Therefore, these three periods and the specific event period of the outbreak of blockchain fork are collectively referred to as the volatile period. The abnormal transaction risk of a single virtual cryptocurrency can be warned by detecting the volatile period and cycle transformation. For a single currency in a stable period, on the basis of protecting the privacy of a single transaction, detect and warn whether the virtual cryptocurrency transaction is affected by security factors and leads to abnormal transactions. To be specific, we can design an algorithm to calculate the transaction popularity value of multiple currencies as a benchmark, and each single currency will conduct qualitative detection according to the popularity value. If abnormal transaction characteristics are met, quantitative detection will be carried out further. The model also includes detection, warning, and disposal of abnormal transactions of virtual cryptocurrencies caused by security factors such as blockchain bifurcation.
In general, the model covers the definition, analysis, and early warning of virtual cryptocurrency anomalies to achieve comprehensive early warning on four different levels of abnormal transaction situation of multi-currency virtual cryptocurrency, abnormal transaction cycle risk of a virtual cryptocurrency, an abnormal transaction of virtual cryptocurrency caused by security factors based on privacy protection, and abnormal transaction of virtual cryptocurrency bifurcation.
The main contributions of this paper are briefly summarized as follows: 1) This paper reconstructs the theoretical system of currency definition, reclassifies existing definition of currency, and puts forward a set of definitions mainly applicable to digital currency. 2) This paper will put forward a popularity value system and its algorithm that are actually applied to virtual cryptocurrency, which will help in the field of social public security and effectively enrich the existing virtual cryptocurrency theory. 3) Based on the market data of virtual cryptocurrency as the support, this paper applies the latest research results in the field of artificial intelligence technology to realize the abnormal warning algorithm model of virtual cryptocurrency.
Analysis of Abnormal Transaction Situation Based on Virtual Cryptocurrency Popularity Value System
Virtual Cryptocurrency Popularity Value System
The Concept of Virtual Cryptocurrency Popularity Value
As of midnight on August 1, 2021, more than 11,570 virtual cryptocurrencies have been publicly issued worldwide, among which 5,408 are still actively traded. Unlike stocks, futures, and precious metals, the current “head” effect of virtual cryptocurrency trading is very obvious, with the top 7 accounting for more than 75% of the total cryptocurrency trading, and the top 100 accounting for about 95% of the total cryptocurrency trading. The market capitalization of the top 1,000 accounts for about 99.7% of the entire virtual cryptocurrency trade.
The overheated hype and the legend of overnight wealth have caused “herd behavior” [30–35] in the virtual cryptocurrency market, which has caused many individual investors to blindly enter [36], and also provided opportunities for some criminals to take advantage of blind individual investors’ ignorance of virtual cryptocurrency. The launch of “unstable value virtual cryptocurrencies” has ruined the fortunes of many people who want to get rich quick. The existence of herd behavior and the “thunderbolt” of many virtual cryptocurrencies make people eager for an early warning method to avoid risk.
Based on the actual situation of virtual cryptocurrency trading, we innovatively proposed virtual cryptocurrency trading popularity value. The data of the top 1,000 virtual cryptocurrency transactions in each large virtual cryptocurrency trading market are used as samples to calculate the popularity value of virtual cryptocurrency transactions; to standardize and quantify virtual cryptocurrency, it is intended to serve as a benchmark reference value for abnormal transactions in virtual cryptocurrencies.
Virtual Cryptocurrency Popularity Value System Series Index
Based on the popularity value of each virtual cryptocurrency transaction, we innovatively put forward the series index of virtual cryptocurrency transaction popularity value system, ranking the top 7 (VC7), the top 20 (VC20), the top 100 (VC100), and the top 6 (VC7X) of the 7 excluding the largest market value bitcoin, 13 out of 20 stocks excluding the top 7 market capitalization (VC20X), and 80 out of 100 stocks excluding the top 20 market capitalization (VC100X). A total of 6 groups of indexes, virtual cryptocurrency trading popularity value system series indexes, aimed at reflecting the current performance of virtual cryptocurrency trading. Table 1 shows the compiling rules of the series index of the virtual cryptocurrency trading popularity value system.
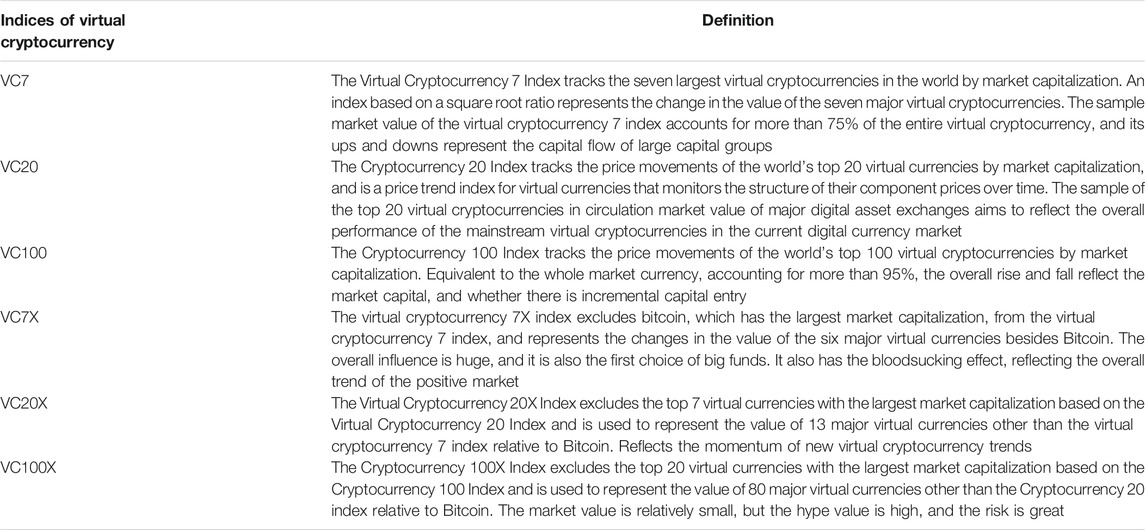
TABLE 1. Rules for compiling series index of virtual cryptocurrency popularity value system.
Calculation of Virtual Cryptocurrency Popularity Value Based on Hybrid Parameter Elite Ant Colony Algorithm
To scientifically evaluate the real-time popularity of virtual cryptocurrency transactions, classical quantitative analysis methods mostly use real-time price or some inherent attribute as its popularity value [37]. This algorithm has a certain scientific nature and objectively reflects its popularity directly through the market, but it also has some defects. It can reflect its popularity through price changes in a certain period of time, but it cannot reasonably reflect its real popularity in a longer period of time. For example, at two different time points, the same virtual cryptocurrency transaction has the same popularity, but because the price base of the two time points is different, under the condition of the same popularity, the final price is not the same, which has a different popularity value from the result. Because the price of virtual cryptocurrencies is not only influenced by the popularity but also by the amount of money they are issued and how they are created, the price base is different. In other cases, two virtual cryptocurrency transactions may have the same popularity for a period of time after launch, but at different prices. In general, this algorithm has some major defects, such as lack of normalization and standardization, which cannot form a comprehensive popularity value system for all currencies of virtual cryptocurrency transactions. It can only reflect the popularity changes of certain virtual cryptocurrency transactions within a period of time.
In the study of virtual cryptocurrency trading, literature [38] mentioned that to weigh the benefits and risks of bitcoin investment, an evaluation index system of virtual cryptocurrency trading activities was established, and the combination weight of comprehensive evaluation was determined by using subjective evaluation method and objective evaluation method comprehensively. However, the algorithm is unable to cope with virtual encrypted mutations situation of currency trading and poor robustness.
This paper proposes an elite ant colony algorithm based on mixed parameters that calculates the popularity value of virtual cryptocurrency transactions. Selection is given priority over virtual cryptocurrency trading market data, virtual cryptocurrency trading chain abnormal data, virtual cryptocurrency trading data, and so on; multi-dimensional data are complementary comprehensive data as a factor, dynamic adjustment factor, and dynamic allocation weights, respectively, combined with the normalized and standardized data processing methods, such as integrated computation virtual cryptocurrency trading phase popularity value. Compared with traditional algorithms that rely on expert experience and fixed factors and factor weights, this method is more scientific and convenient, saving a lot of human and material resources. Relying on machine learning method, the timeliness of trading popularity value system is significantly improved.
On combinatorial optimization problem and optimal solution problem, ant colony algorithm is widely used [39]; to solve the problem of multiple factor weights allocation, this article uses the elite ant colony algorithm based on hybrid parameter dynamic weighting allocation of more factors, using the advantages of the classical ant colony algorithm adaptability that is strong and adapts to the rapid changes of virtual cryptocurrency trading. In classical ant colony algorithm, the information heuristic factor α and expectation heuristic factor β are the same for all individuals. This makes the performance of the algorithm depend sensitively on the setting of some parameters. In addition, the optimal solution may be ignored. To avoid this, classical ant colony algorithms tend to turn up the information heuristic factor α and the expectation heuristic factor β, but this leads to local minima, reducing the likelihood that another, shorter TSP path will be found later. To solve these problems, this paper optimizes the marking rules and α and β parameters of classical ant colony algorithm. We sorted TSP path lengths from small to large. Considering that the market value of currencies at the head of virtual cryptocurrency transactions accounts for too large a proportion, the improved algorithm only allowed the top 20% individuals to leave marks, and the weight was inversely proportional to the path length and multiplied by a factor that decreased linearly with the market value (i.e., the ranking factor). The first-place ranking factor is 1, and the ranking factor is reduced to 0 at 20%. To avoid the optimal TSP path being forgotten, when the first place of this iteration is worse than the optimal TSP path discovered so far, the optimal TSP path is also ranked first as an individual, and the ranking of other individuals is postponed, and marks are left according to the aforementioned rules. This ensures that the optimal TSP path is not forgotten until it is overtaken by a better TSP path.
In this paper, the steps of calculating the popularity value of virtual cryptocurrency transaction using the elite ant colony algorithm based on mixed parameters are as follows:
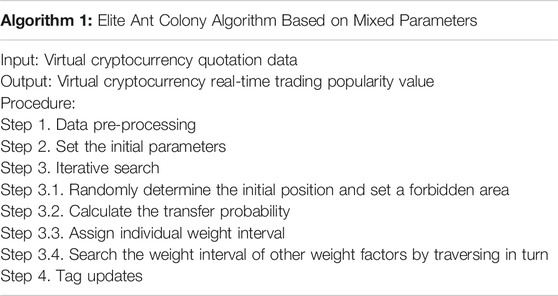
Algorithm 1. Elite Ant Colony Algorithm Based on Mixed Parameters
Step 1 Data pre-processing. Six fields in the market value of virtual cryptocurrency, total trading volume, real-time price, one-hour rise or fall, one-day rise or fall, and one-week rise or fall are taken as weight factors to calculate the popularity value of virtual cryptocurrency trading. The value range of weight is divided into (0,0.01), (0.01, 0.02), …, (0.99, 1.00), then each value range can be expressed as (
Step 2 Set the initial parameters. We set 5 parameters: information elicitation factor—
Step 3 Iterative search. The weight interval of the six factors is searched iteratively in turn, and the process is divided into four steps as follows.
Step 3.1 Randomly determine the initial position and set a forbidden area to ensure that you do not fall into a local loop.
Step 3.2 Equation 1 was used to calculate the transfer probability:
In the formula:
Step 3.3 Assign individual weight interval by random ring algorithm. The specific method is, first, sum the values of probabilities
Step 3.4 Search the weight interval of other weight factors by traversing in turn.
Step 4 Tag updates. In this paper, a model based on global information update is used to calculate and update the markers of each weight interval during each iteration. That is, after all the search is completed, the comprehensive evaluation index under the weight interval selected by each individual is calculated to find the optimal path. Equation 2 is used to update the marks of the selected weight interval, and Equation 3 is used to update the marks of other weight intervals.
In the formula,
DTW-SSC Waveform Similarity Algorithm Based on Virtual Cryptocurrency Popularity Value System
Under the popularity value system of virtual cryptocurrency, anomalies of virtual cryptocurrency are defined in this paper as follows: when the popularity value of a currency deviates greatly from the overall popularity of the market, we believe that the currency may be abnormal, and we need to monitor it. Therefore, the anomaly detection problem of virtual cryptocurrency is then transformed into the question of whether the popularity value curve of a single virtual cryptocurrency is similar to that of the overall market index. Before measuring similarity, this paper first defines similarity.
In Figure 3, the paper considers that y1, y2, and y3 are similar in shape. Specifically, among the three curves, the paper considers that y2 and y3 are the two most similar (because y2 and y3 are the closest in distance).
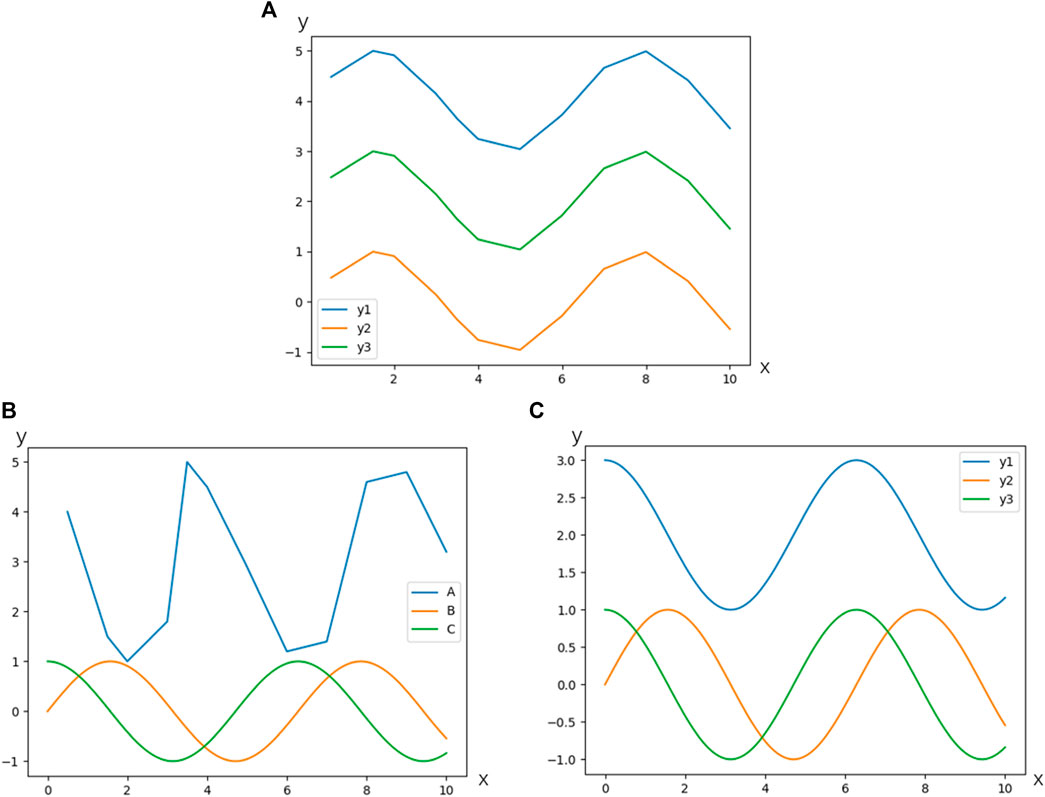
FIGURE 3. Definition of similarity.
Euclidean distance is one of the most widely used basic methods to measure the similarity of two sequences. Euclidean distance is a special case of Minkowski distance, which is used to measure the distance between numerical points and is widely used in many algorithms [40, 41]. For sequences of the same length, calculate the distance between each two points and sum them up. The smaller the distance, the more whole matching. The algorithm is shown in Equations 4 and 5. For sequences of different lengths, there are generally two processing methods:
Subsequence Matching
Find the part of long sequence that is most similar to short sequence. Let the sequence A be
Then find the minimum value of all ρ, and the index of sequence A corresponding to this distance is the part of A that is most similar to B.
Sliding Window
EK, KC et al. from Microsoft proposed that to reduce the algorithm complexity, the B sequence can be copied until it is as long as the A sequence [42]. The paper from Tianjin university points out three shortcomings of Euclidean distance in measuring time series similarity [43]: 1) it cannot distinguish shape similarity, 2) it cannot reflect the similarity of trend dynamic variation amplitude, and 3) the calculation based on point distance cannot reflect the difference of different analysis frequency, as shown in Figure 4.
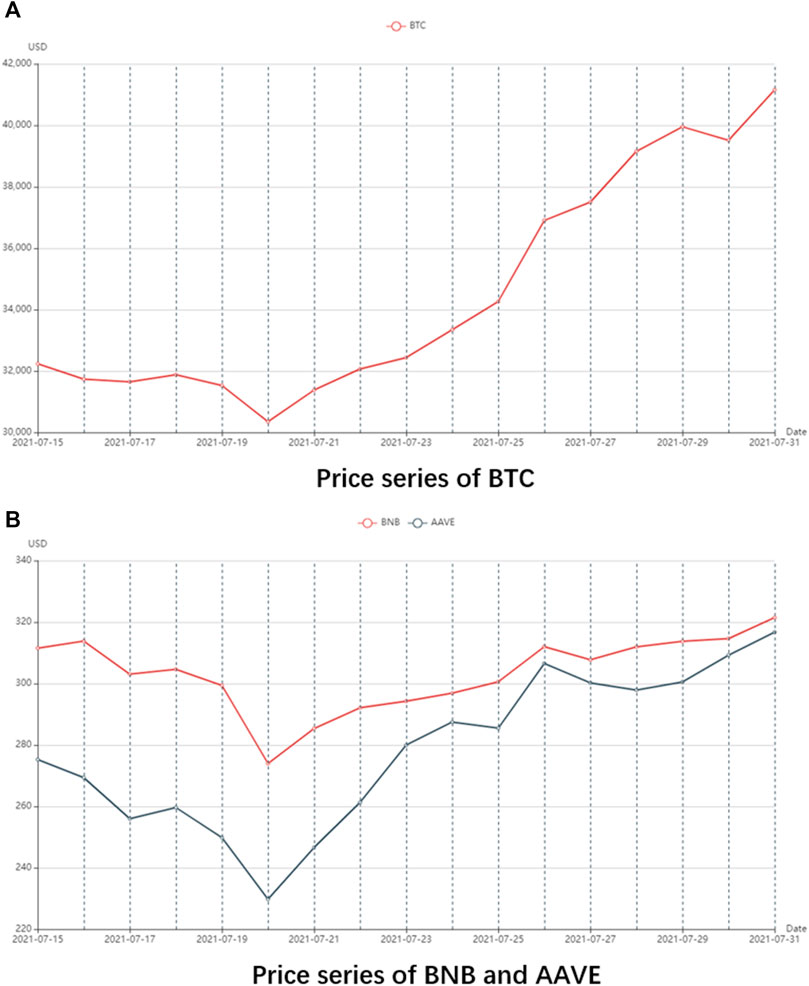
FIGURE 4. Price series from July 15 to July 31. (A) Price series of BTC. (B) Price series of BNV and AAVE.
The change trend of A and B is almost completely opposite, and the change trend of A and C is almost exactly the same. If Euclidean distance is used, then it follows that A and B are the most similar. In fact, the change is that A and C are similar. Figure 5 is the same as mentioned previously. Normally, the closest thing we think of as y1 is y3. In fact, y3 is the result of y1 being shifted down. However, the Euclidean distance between y1 and y2 is 15,832, and the Euclidean distance between y1 and y3 is 15,876. The Euclidean distance calculated tells us that the nearest distance to y1 is y2.
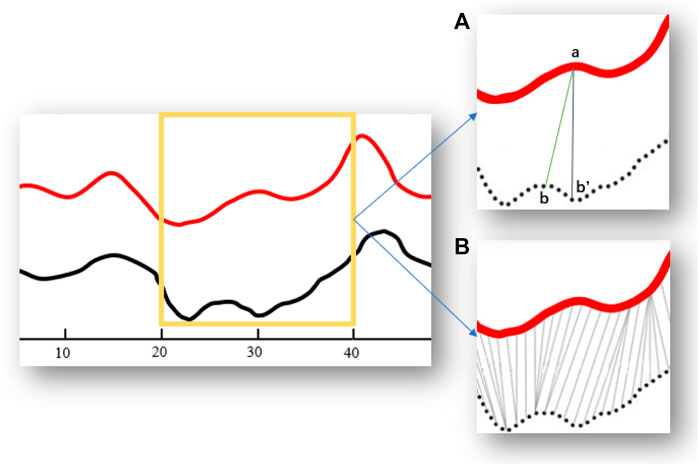
FIGURE 5. DTW looks for waveform alignment points.
Aiming at the defects of Euclidian distance, researchers began to use Pattern distance [44] to quantify similarity. First, the piecewise linear representation algorithm (PLR) was introduced to represent a sequence piecewise linear representation. The state of a sequence can be simply divided into three categories: up, down, and constant. We represent these three states as 1, −1, and 0. For the sequence in Figure 6, it is divided into K segments, and the slope of each segment is calculated. Positive slope means rising, negative slope means declining, and zero means unchanged. At this point, the sequence can be approximated as (−1, −1, 0, −1, 1, 0, 1, 1 …); combining the same adjacent patterns, we get (−1, 0, −1, 1, 0, 1 …) in the sequence.
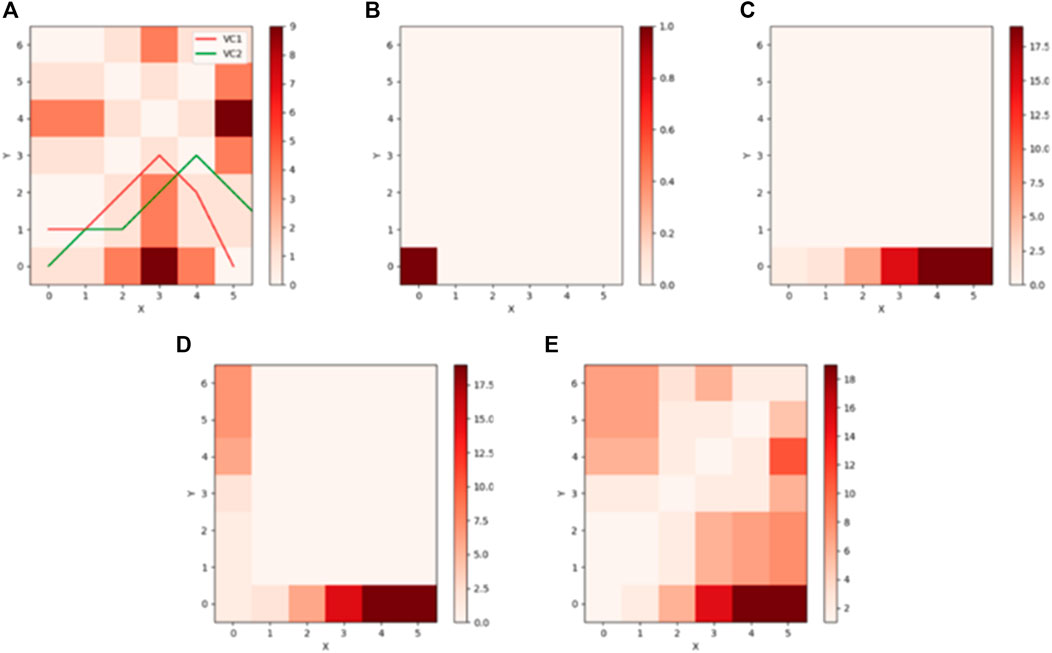
FIGURE 6. Sequence distance matrix calculation.
As for the point segmentation of PLR algorithm, the method of bisecting is directly used. However, it can be seen from Figure 6 that the third mode is represented as 0. In fact, the third mode is a peak that rises first and then declines, so the method of bisecting is not scientific. The bottom-up search method proposed by KEOGH E [45] solves this problem well.
Since we combine the same adjacent patterns, the pattern sequence we get must be 1, −1, 0 interval, and each pattern may span different time lengths. After merging the patterns, sequence S1 may have N patterns and S2 may have M patterns. Now we need to count them.
As shown in Figure 4B, we select BNB and AAVE, two virtual cryptocurrencies with similar prices and higher ranking, and express their price sequences as S1 and S2 after PLR:
Let
When the mode definition is completed, the distance can be calculated. The formula for the mode distance is
Obviously,
Since each mode may span different time lengths, and the longer a mode lasts, the more information it contains in the whole sequence, we improved the aforementioned formula, and the improved mode distance formula is as follows:
where
Based on the pattern distance, Dong et al. proposed the shape distance [43], which further improved the measurement effect. In simple terms, the shape distance is based on the mode distance, adding an amplitude change and resetting the mode sequence. Suppose we have obtained the equal-patterned sequence:
Set amplitude variation sequence as A, then:
The calculation formula of shape distance is
In this case,
Taking virtual cryptocurrencies as an example, we believe that the price trend of virtual cryptocurrencies usually has seven states: {accelerating down, horizontal down, decelerating down, stable, decelerating up, horizontal up, accelerating up}, which is described by the model M = −3, −2, −1, 0, 1, 2, 3). A threshold value
Shape distance is improved on mode distance to be more complex and more realistic because more modes are introduced (7) (Table 2).
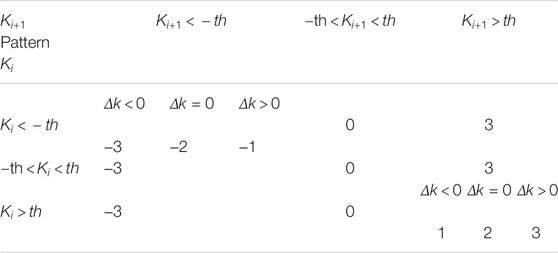
TABLE 2. Shape distance schema table.
When
In addition, to improve the accuracy of the model and reduce the impact of absolute value differences on the whole model, it is generally necessary to standardize the original sequence. Shape distance is also more accurate because of the addition of more patterns, and the effect is better than pattern distance.
In addition to the distance method mentioned previously, there is another very intuitive indicator, correlation coefficient, which can measure not only correlation but also similarity. However, correlation coefficient is generally not used to measure similarity in time series because it cannot solve the problem of graph translation. Figure 8 clearly illustrates this problem.
DTW (Dynamic Time Warping) [46–50] solves this problem. DTW is actually calculating Euclidean distance. As mentioned before, Euclidean distance cannot measure shape similarity well, and all points are directly corresponding according to general Euclidean distance calculation method. DTW is to find the correct corresponding points between the sequences and calculate their distance, as shown in Figure 5A. The solid line and the dashed line are the two speech waveforms of the same word “pen” respectively (separated on the Y-axis for observation). You can see that the overall waveform shape is very similar, but the time line is not aligned. For example, at the 20th time point, point A of the solid line waveform will correspond to point B′ of the dotted line waveform, so the traditional calculation of similarity by comparing distances is obviously unreliable because it is clear that point A on the solid line corresponds to point B on the dotted line. In Figure 5B, DTW can calculate their distance correctly by finding the point where the two waveforms are aligned. The fundamental task of DTW is to match points correctly. The criterion of DTW correct correspondence is that if the points of two sequences are correctly corresponding, their Euclidean distance is minimized. One point of a sequence may correspond to multiple points of another sequence. If all possible points are enumerated to find the most suitable point, it is an NP difficult problem in terms of time complexity. At this time, dynamic programming is introduced to optimize it to solve this problem.
Simulate the market sequence of two virtual cryptocurrencies VC1 and VC2 with different lengths, as shown in Figure 10.
Compute the distance matrix of two sequences. The horizontal axis represents the VC1 sequence, and the vertical axis is the VC2 sequence. The visual representation is shown in Figure 11A.
In the visual distance matrix, the darker the color is, the farther the distance is. Calculate a cumulative distance matrix, as shown in Figure 11B, and minimize the cumulative distance as the ultimate goal. Obviously row 0, column 0 of the cumulative distance matrix is equal to row 0, and column 0 of the distance matrix is equal to 1. If you keep going to the right, then the cumulative distance matrix changes as shown in Figure 11C. If you keep going up, then it will look as shown in Figure 11D because the path only moves in three directions: right, up, and slant to the upper right. If the path moves more than one square to the right or up, this indicates that one point in one sequence corresponds to multiple points in another sequence. So far, we have computed two columns of the cumulative distance matrix. For any other point, the increase in cumulative distance can come from only three directions: left, down, and slant down left. Dynamic programming is to select the direction that minimizes the current travel distance for each step forward. Therefore, for any other point, the cumulative distance can be calculated by the following Eq. 17:
Therefore, the complete cumulative distance matrix is shown in Figure 6E. The best path has been clearly displayed in the cumulative distance matrix, which is the square with the lightest color in the figure. We only need to find the best path by backtracking. The best route is the [(5, 6), (4, 5), (3, 4), (2, 3), (1, 2), (1, 1), (0, 1), (0, 0)]. The DTW algorithm calculates the Euclidean distance of these points as a measure of similarity.
DTW has been widely used in the field of speech recognition due to its outstanding characteristics. Because of a syllable, it may be very long or very short; how to correctly recognize similar sounds or syllables is very important for speech recognition. By the same token, the virtual cryptocurrency in the virtual cryptocurrency market analysis is popular, and because each virtual cryptocurrency differs, the reaction time to the market changes is different also; at this point, the excellent quality of DTW (dynamic time warping) makes up for the defects, using DTW-SSC algorithm based on virtual cryptocurrency popularity value system, through extension and shortening of the time sequence. The similarity between the two popularity value sequences is calculated by using the constructed virtual cryptocurrency popularity value system. To monitor the virtual cryptocurrency market is abnormal. The DTW-SSC algorithm based on the popularity value system of virtual cryptocurrency can also actively discover the non-similar sub-sequences in the sequence. Since the characteristics of the sequence in the long sequence data such as trading quotation data or speech sequence are represented by the whole sequence, the similarity of the sequence must be investigated from the whole similarity. Even if two sequences have very similar local sub-sequences, when the overall similarity level is low, the two sequences are still considered to be dissimilar. When studying the active discovery of virtual cryptocurrency anomalies in a certain period of time, it is necessary to automatically discover some non-similar sub-sequences. The key is to identify the abnormal sub-patterns representing the same sequence as the anomaly discovery region. At this point, it is necessary not only to judge the overall sequence similarity but also to mine the abnormal sub-pattern to judge whether it conforms to the abnormal characteristics of virtual cryptocurrency. Therefore, the DTW-SSC algorithm based on the popularity value system of virtual cryptocurrency is of great significance for the early warning of abnormal virtual cryptocurrency.
This paper first calculates the popularity value of the whole currency of the public virtual cryptocurrency, generates the popularity value series of the whole currency and the index series of the virtual cryptocurrency popularity value system, and calculates the quantitative similarity S of the two sequences using the DTW-SSC algorithm based on the virtual cryptocurrency popularity value system. To judge whether the popularity value sequence of a single currency virtual cryptocurrency is similar to the corresponding exponential popularity value sequence, the smaller the quantitative similarity S is, the more similar the two sequences are; the larger the quantitative similarity S is, the more dissimilar the two sequences are. At this point, we believe that if the sequences are not similar, the virtual cryptocurrency is abnormal.
EXPERIMENTAL DESIGN AND RESULT
Experimental Design
All the experiments in this paper were run on a PC with a CPU of 3 GHz Inter Core I9-10980XE, GPU of NVIDIA GeForce RTX 3090 with 24 GB video memory, operating system of Windows10, and memory size of 32 GB. The algorithm is implemented in Python. The experimental data use the virtual cryptocurrency quotation data from 0:00 to 24:00 on August 3, 2021.
The data in this paper are from the Internet, including Coinbase, Tokenview, FeiXiaoHao, and other virtual cryptocurrency market data sites as well as Kaggle, Tushare, XBlock, and other big data science sites. The data dimension mainly includes the quotation data of virtual cryptocurrency, block data on the chain of virtual cryptocurrency, known abnormal transaction data, known abnormal transaction address, open smart contract data, public news of virtual cryptocurrency, etc. Each dimension can be subdivided again; for example, the quotation data of virtual cryptocurrency can be subdivided into price, rise and fall, trading volume, and other dimensions. The cumulative size of all experimental data exceeds 1 TB.
Experimental Result
In this article, we put forward the virtual cryptocurrency system of popularity value, and according to a study in the system with virtual cryptocurrency popularity value anomaly detection algorithm, by building the system, virtual cryptocurrency can be seen clearly in the popularity of the global, and can judge the development trend of virtual cryptocurrency, according to the system. A new abnormal research method for virtual cryptocurrency is innovatively proposed. Through the popularity value system of virtual cryptocurrency, the popularity value of each currency and the popularity value index of each virtual cryptocurrency are calculated, and the similarity comparison algorithm is used to warn abnormal virtual cryptocurrency. The index chart of the virtual cryptocurrency popularity value system on August 3 is shown in Figure 7.
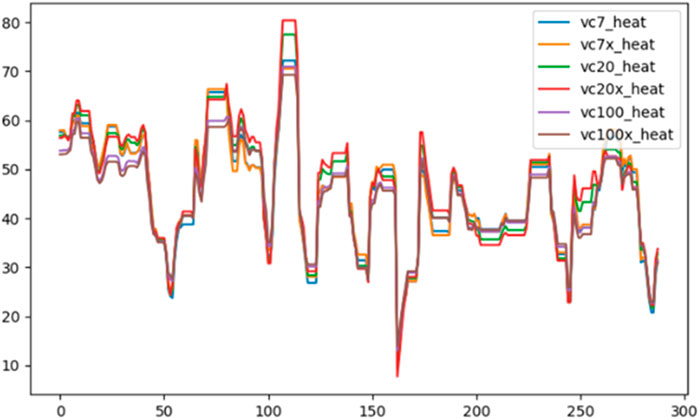
FIGURE 7. Comparison of six trading popularity indices on August 3, 2021.
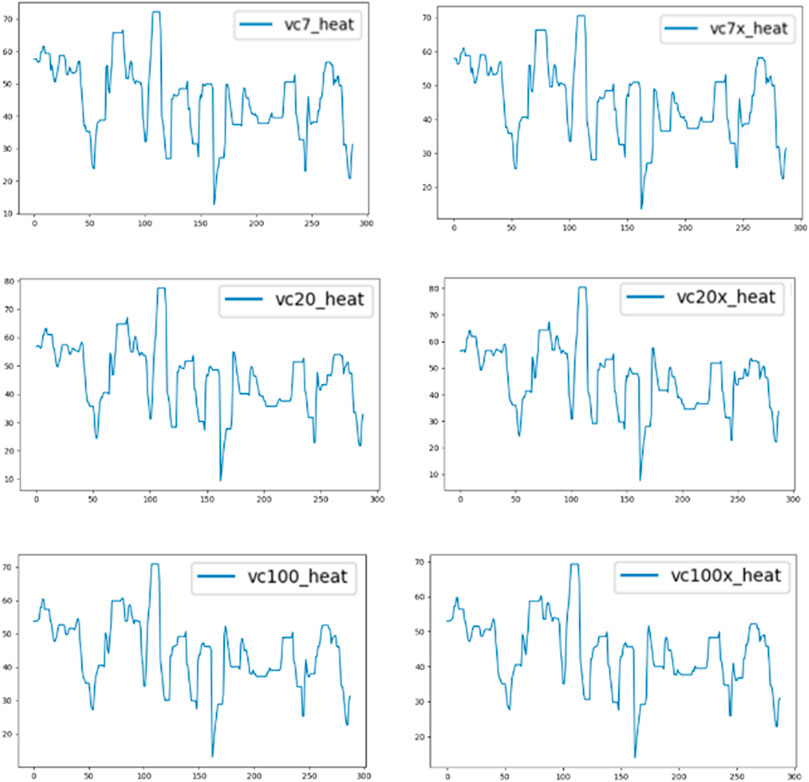
FIGURE 8. August 3, 2021 six trading popularity indices.
To verify the guiding effect of the virtual cryptocurrency popularity value index on the trend of the virtual cryptocurrency popularity value, three groups of normal virtual cryptocurrency and one group of abnormal virtual cryptocurrency with different ranking locations were selected for the experiment.
According to the experimental results of virtual cryptocurrency popularity value calculation in recent 3 months, the definition of similarity degree is given through cluster analysis and error estimation of quantified similarity value. The similarity value between 0 and 1,000 is considered High Similarity. The similarity value between 1,000 and 2,000 is considered More Similarity. The similarity value between 2,000 and 3,500 is considered Similarity. The similarity value between 3,500 and 4,500 is considered Low Similarity. Also, the similarity value greater than 4,500 is considered No Similarity.
First of all, among the top seven virtual cryptocurrencies in the total market value of the virtual cryptocurrency market, three representative virtual cryptocurrencies, BTC, XRP, and DOGE, were selected as a group for the experiment, and the popularity value sequence of these three virtual cryptocurrencies was compared with three indexes VC7, VC20, and VC100. According to the DTW-SSC algorithm based on the popularity value system of virtual cryptocurrencies, the quantitative similarity S of the popularity value sequence of BTC, ETH, and DOGE and the three indexes is calculated: The corresponding trend and the quantitative similarity S are shown in Figure 9.
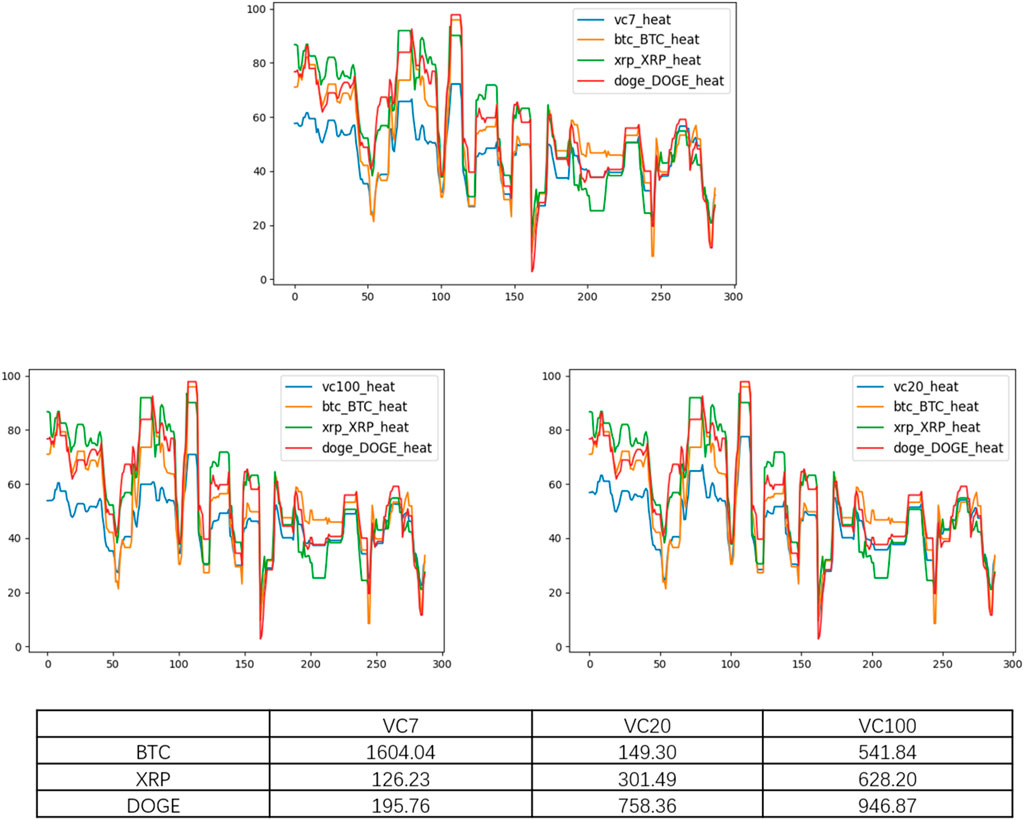
FIGURE 9. Comparison of BTC, XRP, and DOGE popularity value with the three indexes on August 3.
It can be clearly seen from Figure 9 that the popularity values of BTC, XRP, and DOGE were compared with the three indices, and the overall trend of change was consistent. Then the similarity is quantitatively analyzed.
According to the analysis of quantitative Similarity results, it can be found that except the quantitative Similarity of BTC and VC7, the other eight quantitative Similarity indexes are all lower than 1,000, belonging to High Similarity, while BTC and VC7 belong to More Similarity. It indicates that the prices of BTC, XRP, and DOGE were relatively stable on August 3. BTC may have short-term fluctuations different from VC7, but it still conforms to the general fluctuation trend. By observing XRP and DOGE, it can be found that the quantitative similarity values of XRP and VC7, VC20, and VC100 increase in turn, and the similarity degree decreases in turn, which also conforms to the standard of the index.
We select MATIC, LTC, and WBTC as a group of virtual cryptocurrencies ranked from 8 to 20 in the total market value of the virtual cryptocurrency market, and compare the popularity value sequence of these three virtual cryptocurrencies with the four indices VC7, VC20, VC100, and VC20X. According to the DTW-SSC algorithm based on the popularity value system of virtual cryptocurrency, the sequence of the popularity value of MATIC, LTC, and WBTC and the quantitative similarity S of the three indexes were calculated respectively. The corresponding trend and the quantitative similarity S are shown in Figure 10.
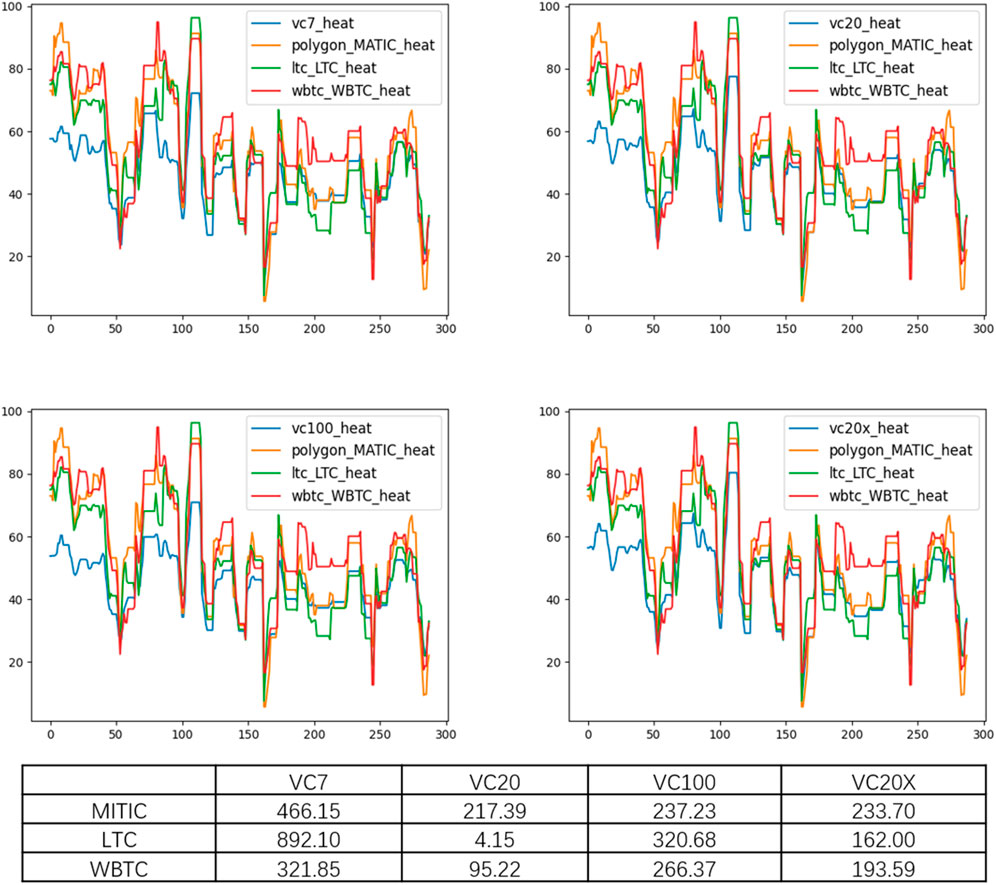
FIGURE 10. MATIC, LTC, and WBTC popularity values compared with the four indexes on August 3.
It can also be clearly seen from Figure 10 that the popularity values of MATIC, LTC, and WBTC are compared with the four indexes, and the overall change trend is consistent, and then the similarity is quantitatively analyzed.
According to the analysis of quantitative similarity results, we found that the quantitative similarity values of MATIC, LTC, and WBTC with VC7 were the highest in the comparison of the four indexes, indicating that their similarity with VC7 was low. The quantitative similarity values with VC20 were the lowest in the comparison of the four indexes, indicating that their similarity with VC20 was the highest. According to the definition of VC7 index and VC20 index, the experimental results are reasonable and all quantitative Similarity index values conform to High Similarity, indicating that the prices of MATIC, LTC, and WBTC were very stable on August 3, in line with the general fluctuation trend.
Among the virtual cryptocurrencies ranked from 21 to 100 in the total market capitalization of the virtual cryptocurrency market, we selected three representative virtual cryptocurrencies, FTT, MKR, and SNX, as a group, and compared the popularity value sequence of these three virtual cryptocurrencies with four indexes, VC7, VC20, VC100, and VC100X. According to the DTW-SSC algorithm based on the popularity value system of virtual cryptocurrencies, the quantitative similarity S of the popularity value sequence of BTC, ETH, and DOGE and the three indexes is calculated. The corresponding trend and the quantitative similarity S are shown in Figure 11.
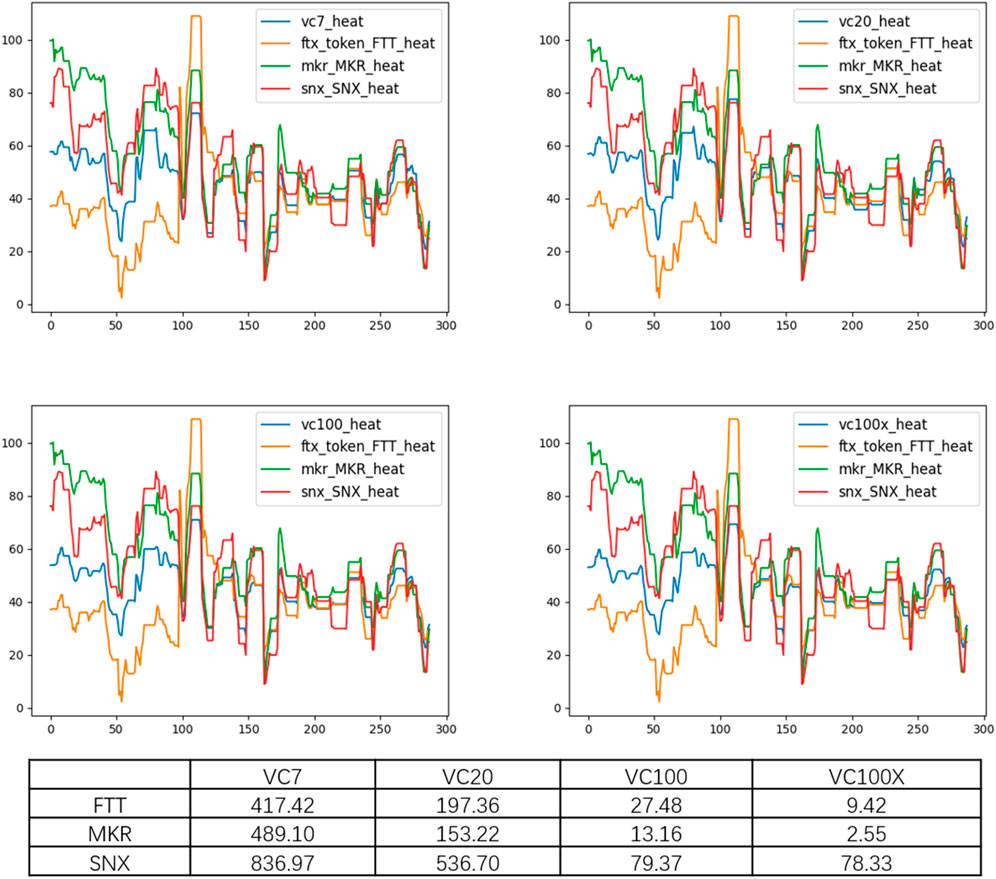
FIGURE 11. FTT, MKR, and SNX popularity values compared with the four indexes on August 3.
It can be clearly seen from Figure 11 that the popularity values of FTT, MKR, and SNX are compared with the four indexes, and the overall trend of change is consistent. Then, the similarity is quantitatively analyzed.
According to the analysis of quantitative Similarity results, it is found that the quantitative Similarity values of FTT, MKR, and SNX and the four indices decrease successively in the table. According to the index formulation rules, the experimental results are reasonable, and all the quantitative Similarity index values conform to High Similarity. This shows that MATIC, LTC, and WBTC prices were very stable on August 3, in line with the general trend of volatility.
We randomly selected ZEN, NANO, and WRX as a group of virtual cryptocurrencies outside the top 100 in the total market capitalization of the virtual cryptocurrency market, and compared the popularity value sequence of these three virtual cryptocurrencies with the six indexes. According to the DTW-SSC algorithm based on the popularity value system of virtual cryptocurrencies, the quantitative similarity S of ZEN, NANO, and WRX popularity value sequences and the three indexes is calculated. The corresponding trend and the quantitative similarity S are shown in Figure 12.
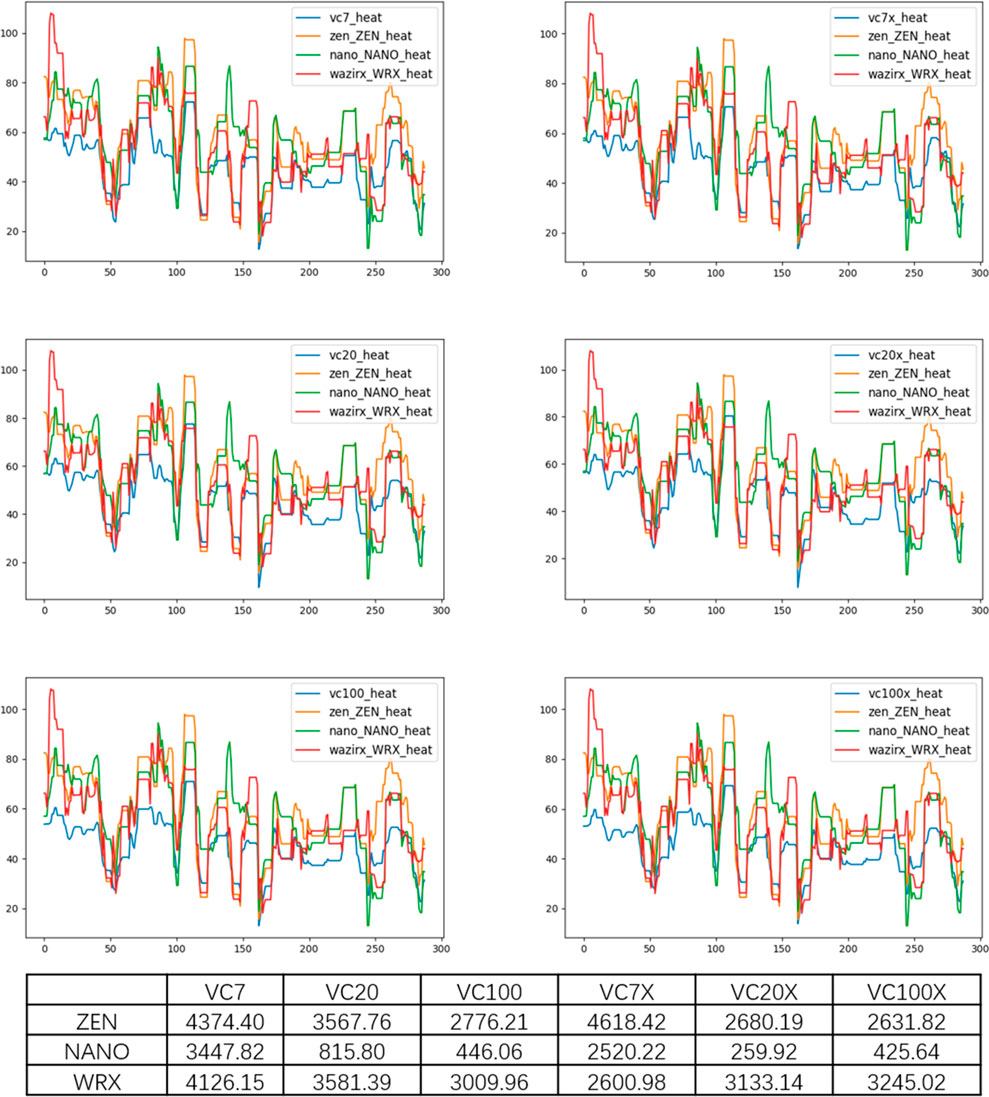
FIGURE 12. August 3 ZEN, NANO, and WRX Popularity Value vs. Six Index comparison.
It can be clearly seen from Figure 12 that when ZEN, NANO, and WRX popularity values are compared with the six indexes, there are some differences in the overall variation trend, but the amplitude is small and there is no significant difference. The overall trend is roughly consistent, and then the similarity is quantitatively analyzed.
According to the analysis of quantitative Similarity results, we find that the quantitative Similarity values of ZEN, NANO, and WRX and the six indexes are relatively High, among which four conform to High Similarity, all of which are from NANO. The quantitative Similarity between NANO and VC7 and VC7X indexes is Low Similarity. According to the experimental results and index compilation rules, NANO basically conforms to the general trend of fluctuation, while the experimental results of ZEN and WRX show that the quantitative Similarity between them and the six indexes is Low Similarity. It indicates that ZEN and WRX had a certain difference with the market on August 3, but the difference level is not unusual.
By observing the activities of the virtual cryptocurrency market on August 3, this paper finds out a virtual cryptocurrency that is significantly believed to be manipulated for experiment. We find RFR as an abnormal virtual cryptocurrency and compare its popularity value sequence with six indexes. According to the DTW-SSC algorithm based on the popularity value system of virtual cryptocurrency, the quantitative similarity S of RFR popularity value sequence and six indexes is calculated. The corresponding trend and the quantitative similarity S are shown in Figure 13.
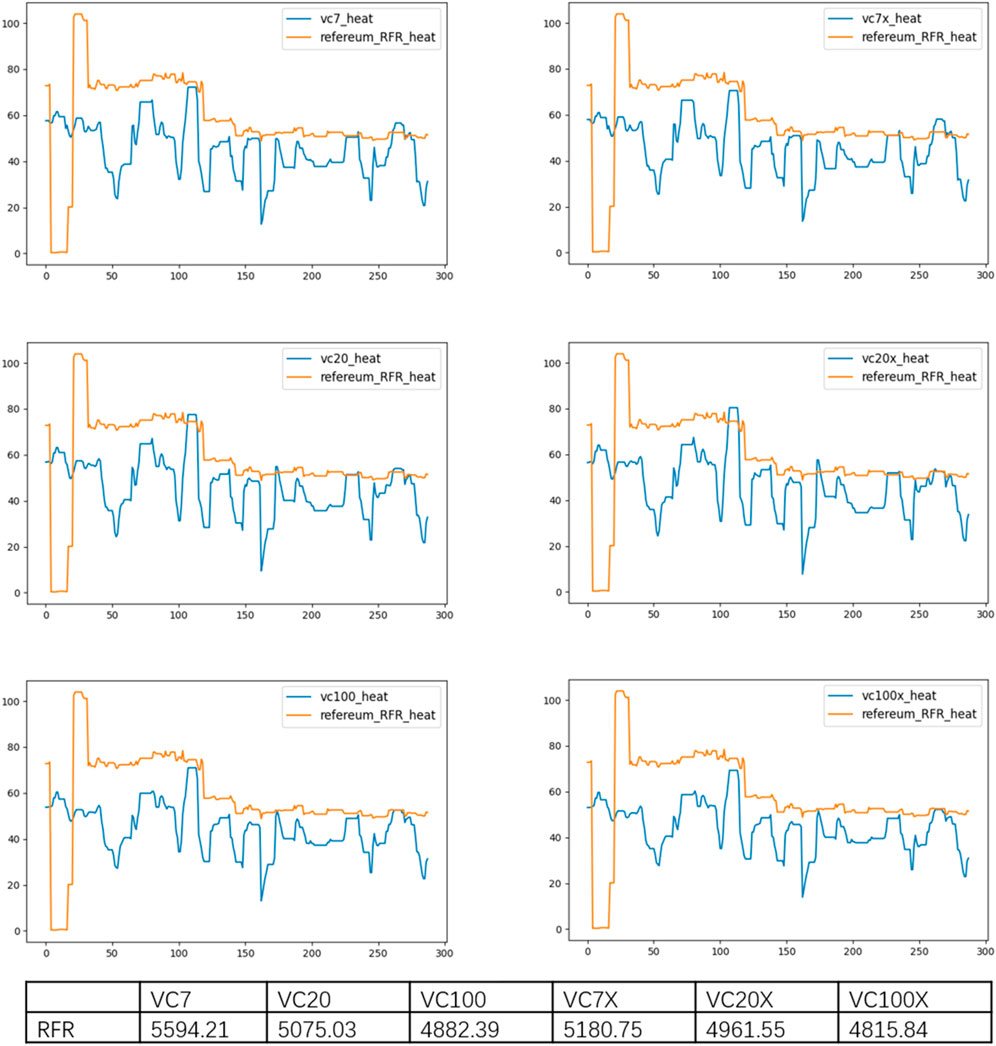
FIGURE 13. August 3 abnormal currency RFR popularity value and six index comparisons.
It can be clearly seen from Figure 13 that the overall variation trend of RFR popularity value is significantly different from that of the six indices, and then the similarity is quantitatively analyzed.
According to the analysis of quantitative Similarity results, we found that the quantitative Similarity values of abnormal virtual cryptocurrency RFR and the six indexes belong to No Similarity. Experimental results proved that the virtual cryptocurrency was abnormal on August 3.
Conclusion
The virtual cryptocurrency transaction popularity value system has a broad application prospect in the research of virtual cryptocurrency. At present, there is an urgent problem of abnormal transaction warning of virtual cryptocurrency in practical applications such as virtual cryptocurrency transaction, which has a great impact on the risk of virtual cryptocurrency transaction. On the basis of summarizing the characteristics and laws of current virtual cryptocurrency transactions, this paper conducts quantitative analysis on virtual cryptocurrency transactions, and studies and constructs the virtual cryptocurrency transaction popularity value system covering multiple currencies. Moreover, the paper specifically studies the elite ant colony algorithm based on mixed parameters to calculate the popularity value of virtual cryptocurrency trading and constructs the virtual cryptocurrency trading popularity value index system on this basis. Taking the popularity value of virtual cryptocurrency transaction as an indicator, combined with the DTW-SSC waveform similarity algorithm of the popularity value system of virtual cryptocurrency transaction, the paper detects whether there are external factors leading to abnormal transaction of global virtual cryptocurrency, and realizes real-time warning of abnormal transaction of global virtual cryptocurrency. Experimental results show that our proposed early-warning method has great application potential in the field of virtual cryptocurrency.
Data Availability Statement
The raw data supporting the conclusions of this article will be made available by the authors, without undue reservation.
Author Contributions
TZ and CL contributed to conception and design of the study. ZZ organized the database. CL performed the statistical analysis. XL and QZ wrote sections of the article. All authors contributed to article revision, read, and approved the submitted version.
Conflict of Interest
The authors declare that the research was conducted in the absence of any commercial or financial relationships that could be construed as a potential conflict of interest.
Publisher’s Note
All claims expressed in this article are solely those of the authors and do not necessarily represent those of their affiliated organizations, or those of the publisher, the editors, and the reviewers. Any product that may be evaluated in this article, or claim that may be made by its manufacturer, is not guaranteed or endorsed by the publisher.
References
1. He S. Exploration of Gold Standard, Credit Currency and Digital Currency. Finan Mar (2020) 5(4):316. doi:10.18686/fm.v5i4.2962
2. Rosenfeld R, Lakatos A, Beam D, Carlson J, Flax N, Niehoff P, et al. Commodity Futures Trading Commission Issues Advisory for Virtual Currency Pump-And-Dump Schemes. J Investment Compliance (2018) 19:42. doi:10.1108/JOIC-04-2018-0033
3. Guindy MA. Cryptocurrency price Volatility and Investor Attention. Int Rev Econ Finance (2021) 76(1):556–70. doi:10.1016/j.iref.2021.06.007
4. Putra P, Jayadi R, Steven I. The Impact of Quality and Price on the Loyalty of Electronic Money Users: Empirical Evidence from Indonesia. J Asian Finance Econ Business (2021) 8(3):1349–59. doi:10.13106/jafeb.2021.vol8.no3.1349
5. Liu S. Recognition of Virtual Currency Sales Revenue of Online Game Companies. Acad J Humanities Soc Sci (2019) 2(7):29–36. doi:10.25236/AJHSS.2019.020704
6. Guo H, Hao L, Mukhopadhyay T, Sun D. Selling Virtual Currency in Digital Games: Implications for Gameplay and Social Welfare. Inf Syst Res (2019) 30(2):430–46. doi:10.1287/isre.2018.0812
7. Liiv I. Data Science Techniques for Cryptocurrency Blockchains, Vol. 9. Singapore: Springer Nature (2021). doi:10.1080/17538963.2020.1870282
8. Tong W, Jiayou C. A Study of the Economic Impact of central Bank Digital Currency under Global Competition. China Econ J (2021) 14(12):1–24. doi:10.1080/17538963.2020.1870282
9. Davoodalhosseini SM. Central Bank Digital Currency and Monetary Policy. J Econ Dyn Control (2021) 104150. doi:10.1016/j.jedc.2021.104150
10. Xu Z, Tang C. Challenges and Opportunities in the Application of China's Central Bank Digital Currency to the Payment and Settle Account System. Fin For (2021) 9(4):233. doi:10.18282/ff.v9i4.1553
11. Dahlberg T. What Blockchain Developers and Users Expect from Virtual Currency Regulations: A Survey Study. IP (2019) 24(4):453–67. doi:10.3233/ip-190145
12. Brühl V. Libra - A Differentiated View on Facebook's Virtual Currency Project. Intereconomics (2020) 55(1):54–61. doi:10.1007/s10272-020-0869-1
13. Derlyatka A, Fomenko O, Eck F, Khmelev E, Elliott MT. Bright Spots, Physical Activity Investments that Work: Sweatcoin: a Steps Generated Virtual Currency for Sustained Physical Activity Behaviour Change. Br J Sports Med (2019) 53(18):1195–6. doi:10.1136/bjsports-2018-099739
14. Yousuf Javed M, Husain R, Khan BM, Azam MK. Crypto-currency: Is the Future Dark or Bright? J Inf Optimization Sci (2019) 40(5):1081–95. doi:10.1080/02522667.2019.1641894
15. Guesmi K, Saadi S, Abid I, Ftiti Z. Portfolio Diversification with Virtual Currency: Evidence from Bitcoin. Int Rev Financial Anal (2019) 63:431–7. doi:10.1016/j.irfa.2018.03.004
16. Bashilov B, Galkina M, Berman A. Digital Financial Assets and Digital Currency: Legal Nature and Legal Regulation of Turnover. In: SHS Web of Conferences; 15–16.4.2021; Yekaterinburg, Russia, Vol. 106. EDP Sciences (2021). doi:10.1051/shsconf/202110602005
17. Miseviciute J. Blockchain and Virtual Currency Regulation in the EU. J Investment Compliance (2018) 19:33–38. doi:10.1108/joic-04-2018-0026
18. Wu C. Window Effect with Markov-Switching GARCH Model in Cryptocurrency Market. Chaos, Solitons & Fractals (2021) 146:110902. doi:10.1016/j.chaos.2021.110902
19. Zhang Z, Dai H-N, Zhou J, Mondal SK, García MM, Wang H. Forecasting Cryptocurrency Price Using Convolutional Neural Networks with Weighted and Attentive Memory Channels. Expert Syst Appl (2021) 183:115378. doi:10.1016/j.eswa.2021.115378
20. Kim J-M, Jun C, Lee J. Forecasting the Volatility of the Cryptocurrency Market by GARCH and Stochastic Volatility. Mathematics (2021) 9(14):1614. doi:10.3390/math9141614
21. Huang ZJ, James Huang Z, Xu L. Sequential Learning of Cryptocurrency Volatility Dynamics: Evidence Based on a Stochastic Volatility Model with Jumps in Returns and Volatility. Q J Finance (2021) 11:2150010. doi:10.1142/s2010139221500105
22. Lahmiri S, Bekiros S. Deep Learning Forecasting in Cryptocurrency High-Frequency Trading. Cogn Comput (2021) 13(2):485–7. doi:10.1007/s12559-021-09841-w
23. Rahmani Cherati M, Haeri A, Ghannadpour SF. Cryptocurrency Direction Forecasting Using Deep Learning Algorithms. J Stat Comput Simulation (2021) 91:1–15. doi:10.1080/00949655.2021.1899179
24. Kakinaka S, Umeno K. Exploring Asymmetric Multifractal Cross-Correlations of price-volatility and Asymmetric Volatility Dynamics in Cryptocurrency Markets. Phys A Stat Mech Appl (2021) 581:126237. doi:10.1016/j.physa.2021.126237
25. Aljinović Z, Marasović B, Šestanović T. Cryptocurrency Portfolio Selection—A Multicriteria Approach. Mathematics (2021) 9(14):1677. doi:10.3390/math9141677
26. Kądziołka K. The Promethee II Method in Multi-Criteria Evaluation of Cryptocurrency Exchanges. Econ Reg Studies/Studia Ekonomiczne i Regionalne (2021) 14(2):131–45. doi:10.22004/ag.econ.313138
27. Li S, Li Y, Han W, Du X, Guizani M, Tian Z. Malicious Mining Code Detection Based on Ensemble Learning in Cloud Computing Environment. Simul Model Pract Theor (2021) 113:102391. doi:10.1016/j.simpat.2021.102391
28. Li S, Zhang Q, Wu X, Han W, Tian Z. Attribution Classification Method of APT Malware in IoT Using Machine Learning Techniques. Security Commun Netw (2021) 2021:1–12. doi:10.1155/2021/9396141
29. Yang H, Li S, Wu X, Lu H, Han W. A Novel Solutions for Malicious Code Detection and Family Clustering Based on Machine Learning. IEEE Access (2019) 7:148853–60. doi:10.1109/access.2019.2946482
30. Shen X-L, Zhang KZK, Zhao SJ. Herd Behavior in Consumers' Adoption of Online Reviews. J Assn Inf Sci Tec (2016) 67(11):2754–65. doi:10.1002/asi.23602
31. Romero DM, Reinecke K, Robert LP. The Influence of Early Respondents: Information cascade Effects in Online Event Scheduling. In: Proceedings of the Tenth ACM International Conference on Web Search and Data Mining; 6–10.2.2017; New York, NY (2017). p. 101–10.
32. Borst I, Moser C, Ferguson J. From Friendfunding to Crowdfunding: Relevance of Relationships, Social media, and Platform Activities to Crowdfunding Performance. New Media Soc (2018) 20(4):1396–414. doi:10.1177/1461444817694599
33. Gao C, Liu J. Network-based Modeling for Characterizing Human Collective Behaviors during Extreme Events. IEEE Trans Syst Man Cybernetics: Syst (2016) 47(1):171–83. doi:10.1109/TSMC.2016.2608658
34. Kyriazis NA. Herding Behaviour in Digital Currency Markets: An Integrated Survey and Empirical Estimation. Heliyon (2020) 6(8):e04752. doi:10.1016/j.heliyon.2020.e04752
35. King T, Koutmos D. Herding and Feedback Trading in Cryptocurrency Markets. Ann Oper Res (2021) 300(1):79–96. doi:10.1007/s10479-020-03874-4
36. Akyildirim E, Aysan AF, Cepni O, Darendeli SPC. Do investor Sentiments Drive Cryptocurrency Prices? Econ Lett (2021) 206:109980. doi:10.1016/j.econlet.2021.109980
37. Yang H, Hu J, Huai X, Ma F, Ma Z Landslide Warning Method Based on Local Anomaly Coefficient of Multivariable Time Series. South North Water Transfer Water Sci Techn (2021) 19(6):1227–37. doi:10.13476/j.cnki.nsbdqk.2021.0125
38. Brière M, Oosterlinck K, Szafarz A. Virtual Currency, Tangible Return: Portfolio Diversification with Bitcoin. J Asset Manag (2015) 16(6):365–73. doi:10.1057/jam.2015.5
39. Liu Y, Gao C, Zhang Z, Lu Y, Chen S, Liang M, et al. Solving NP-Hard Problems with Physarum-Based Ant colony System. IEEE/ACM Trans Comput Biol Bioinf (2017) 14(1):108–20. doi:10.1109/tcbb.2015.2462349
40. Wang D, Gao X, Wang X. Semi-supervised Nonnegative Matrix Factorization via Constraint Propagation. IEEE Trans Cybern (2016) 46(1):233–44. doi:10.1109/TCYB.2015.2399533
41. Bronstein MM, Bruna J, LeCun Y, Szlam A, Vandergheynst P. Geometric Deep Learning: Going beyond Euclidean Data. IEEE Signal Process Mag (2017) 34(4):18–42. doi:10.1109/msp.2017.2693418
42. Keogh E, Chakrabarti K, Pazzani M, Mehrotra S. Dimensionality Reduction for Fast Similarity Search in Large Time Series Databases. Knowledge Inf Syst (2001) 3(3):263–86. doi:10.1007/pl00011669
43. Dong XL, Gu CK, Wang ZO. Research on Shape-Based Time Series Similarity Measure. In: 2006 International Conference on Machine Learning and Cybernetics; 13–16.8.2006; Dalian, China. IEEE (2006). p. 1253–8. doi:10.1109/icmlc.2006.258648
44. Jonoska N, Nabergall L, Saito M. Patterns and Distances in Words Related to DNA Rearrangement. Fundam Inform (2017) 154(1-4):225–38. doi:10.3233/fi-2017-1563
45. Keogh E. Fast Similarity Search in the Presence of Longitudinal Scaling in Time Series Databases. In: Proceedings Ninth IEEE International Conference on Tools with Artificial Intelligence; 3–8.11.1997; Newport Beach, CA. IEEE (1997). p. 578–84.
46. Kim S, Lee H, Ko H, Jeong S, Byun H, Oh K. Pattern Matching Trading System Based on the Dynamic Time Warping Algorithm. Sustainability (2018) 10(12):4641. doi:10.3390/su10124641
47. Shokoohi-Yekta M, Hu B, Jin H, Wang J, Keogh E. Generalizing DTW to the Multi-Dimensional Case Requires an Adaptive Approach. Data Min Knowl Disc (2017) 31(1):1–31. doi:10.1007/s10618-016-0455-0
48. Sharma A, Sundaram S. An Enhanced Contextual DTW Based System for Online Signature Verification Using Vector Quantization. Pattern Recognition Lett (2016) 84:22–8. doi:10.1016/j.patrec.2016.07.015
49. Sharma A, Sundaram S. On the Exploration of Information from the DTW Cost Matrix for Online Signature Verification. IEEE Trans Cybern (2018) 48(2):611–24. doi:10.1109/TCYB.2017.2647826
Keywords: blockchain, virtual cryptocurrencies, popularity value, data-driven, social physics
Citation: Zhu T, Liao C, Zhou Z, Li X and Zhang Q (2022) Fast Popularity Value Calculation of Virtual Cryptocurrency Trading Stage Based on Machine Learning. Front. Phys. 9:788508. doi: 10.3389/fphy.2021.788508
Received: 02 October 2021; Accepted: 02 December 2021;
Published: 25 January 2022.
Edited by:
Chao Gao, Southwest University, ChinaReviewed by:
Jun Wu, Shanghai Jiao Tong University, ChinaZhuo Sun, Beijing University of Posts and Telecommunications (BUPT), China
Copyright © 2022 Zhu, Liao, Zhou, Li and Zhang. This is an open-access article distributed under the terms of the Creative Commons Attribution License (CC BY). The use, distribution or reproduction in other forums is permitted, provided the original author(s) and the copyright owner(s) are credited and that the original publication in this journal is cited, in accordance with accepted academic practice. No use, distribution or reproduction is permitted which does not comply with these terms.
*Correspondence: Tong Zhu, emh1dG9uZy5nYXNzQGdtYWlsLmNvbQ==