- 1Research Institute of Zhejiang University-Taizhou, Taizhou, China
- 2Chernivtsi National University, Chernivtsi, Ukraine
- 3Physics Research Institute, Odessa II Mechnikov National University, Odessa, Ukraine
The paper proposes a new approach that enables the structure analysis and reconstruction of a rough surface where the height of inhomogeneities (from the depression to the upper point) varies within the spread about 20 nm. For the surface diagnostics, carbon nanoparticles are used, which serve as sensitive probes of the local surface height. A single nanoparticle can be positioned at a desirable point of the studied surface with the help of an optical tweezer employing the He-Ne laser radiation. Then the particle is illuminated by the strongly focused exciting beam of 405 nm wavelength, with the waist plane precisely fixed at a certain distance from the surface base plane. The particle’s luminescence response (in the yellow-green spectral range) strongly depends on the distance between the exciting beam waist and the particle, thus indicating the local height of the surface. After scanning the surface area and the consecutive interpolation, the surface “vertical” landscape can be reconstructed with a high accuracy: the numerical simulation shows that the RMS surface roughness is restored with an accuracy of 6.9% while the landscape itself is reconstructed with the mean error 7.7%.
Introduction
In the past years, a significant progress occurs in the development of a new branch of optical technology directed to the fabrication of thin, light and flexible electronic elements. In this regard, additional requirements are imposed on the materials used and the methods of their preparation. A critical point in the creation of such devices is the glass substrate, which forms the basis for displays, touch sensors, photovoltaics, thin-film transistors, and lighting. With growing degree of the devices’ integration, the influence of the substrate on the functionality of devices, and, naturally, on their manufacturing processes, becomes increasingly subtle and sensitive. Taking into account the mechanical and, especially, the optical properties of the substrate becomes important even at the initial stages of the production process.
Properly prepared and selected glass substrates provide the necessary hermeticity, sufficient thermal stability enabling the high-temperature processes to be performed as required in some devices, and the specific optical properties. The latter imply high optical transmission with a weak wavelength dependence in the visible range, and the high homogeneity with a submicron-level resolution and layer-to-layer alignment over the entire device. Diagnostics of such surfaces with especial attention to their quality, assessment of their structure inhomogeneity, etc. are extremely important for producing fine electronic components, e.g., in the technology of glass substrates for thin multifunctional screens [1].
Presently, as substrates for displays, texture surfaces are used [2] characterized by the RMS roughness in a range from 5 to 75 nm and a correlation length of the surface texture in a range from 5 to 150 nm. Among the existing methods that are widely used for the surface roughness diagnostics, the contact and non-contact approaches can be distinguished. Contact measurements, which include stylus profilers or atomic force microscopes (AFM) [3, 4], enable to measure the surface inhomogeneities with an accuracy of 5 nm but may cause the surface damage during measurement due to the occurrence of contact stress between the probe and the surface [3, 5].
Usually, optical methods are contactless and non-destructive. In optical methods, information about the surface roughness is contained in the optical beam, obtained via the scattering of the probe radiation by the probed surface [6]. Among the optical approaches, the most common are methods [7] using optical profilometers [8, 9], interference techniques [10–13], methods based on the speckle-correlation [14, 15] and the light scattering phenomena [16]. It is the optical methods that enable the permanent on-line monitoring of the surface state in the course of technological process. Typically, the applicability of such methods is limited by the lateral resolution up to the Rayleigh diffraction limit [11, 12].
With decreasing scale of inhomogeneities, the known non-contact methods become unsatisfactory with respect to their accuracy and resolution, and the necessity emerges in the search of new approaches to the surface roughness control and diagnostics. In particular, such problems arise in the technologies of glass panels for the flat screens, functional units of modern sensor displays, screens of the monitors and TV sets, where the lightness and flexibility are among the main requirements, together with the high optical transmission, hermeticity, thermal stability and the surface quality [1, 17].
Recently, we have proposed an optical method that makes it possible to test and evaluate the degree of surfaces’ inhomogeneity of the order of tens of micrometers by using carbon nanoparticles [18–20]. The method is based on the property of laser radiation, scattered by a rough (structured) surface, to form a speckle pattern [12, 13, 21], and carbon nanoparticles are employed for the study of this pattern. The synthesized carbon nanoparticles [20], about 50–70 nm in size, with a significant absorption at the wavelength of 405 nm and moderate absorption at the wavelength of He-Ne laser radiation, are able to move within aqueous suspensions under the action of optical forces generated by the internal energy flows in the light field [21, 22]. Intensively absorbing the radiation of the semiconductor laser (405 nm), the particles can be kept at the special regions of the optical intensity distribution under the action of the gradient optical forces [22, 23]. Significant luminescence of the particles in the yellow-green spectral range enables to visualize their location. Thus, the structure-forming points of the optical field (singularity points) can be recorded, which made it possible to reconstruct the amplitude and phase distribution of the optical field, practically in a real time. The obtained distribution was used to estimate the pattern of inhomogeneities of the surface under investigation.
However, this method is only applicable for surfaces, where sizes of inhomogeneities are comparable with the wavelength. For glass substrates, being the object of this work and characterized by a thinner surface structure, one needs to develop more accurate and reliable methods for assessing the surface inhomogeneities. In the current literature, the promising approaches are described based on the combination of a light sectioning microscope and a computer vision system [24], or involving the depolarization effects in the interference methods [25], which offer new contactless techniques for diagnostics of surface inhomogeneities and can be applied for investigation of thin screens. However, the main limitations, associated with the lateral resolution dependence on the height of the surface structures [26], still remain insistent.
In this context, the search of the ways to overcome the difficulties related to the limited lateral resolution has led to the new proposition. In this paper, we discuss additional possibilities to involve the fluorescent particles as sensitive probes of the surface relief. The main idea is that a single particle can be efficiently localized at any point of the investigated surface with the help of a proper optical tweezer [27]; the necessary lateral manipulation can be realized, e.g., with the techniques used for the probe manipulation in the AFM [3]. Kept at this point of the horizontal plane by the tweezer, the particle’s vertical position is determined by the local surface height. Then, the particle is illuminated by the strongly focused laser beam with the precisely fixed waist position with respect to the surface. This beam with the properly chosen wavelength excites the particle luminescence whose intensity depends on the distance between the particle and the beam waist, and thus the information on the local height of the surface can be derived.
This procedure can be realized with the same carbon nanoparticles that were used for visualization of the singular light-field structure [20], which show efficient absorption at 405 nm, intense light emission at 530 nm and can be manipulated by the light of He-Ne laser. Its implementation includes several steps: 1) digital modeling of the surface profile via the set of heights measured at a discrete set of points and formulation of the corresponding requirements to the probe particle localization with the sufficient lateral resolution; 2) the exciting beam localization with precise fixation of the horizontal position of its axis and vertical position of the waist; 3) calibration of the luminescence signal dependence on the particle-waist distance and 4) numerical reconstruction of the surface relief based on the measured luminescence data. All these steps are considered in detail in the subsequent sections.
Digital Characterization of the Surface Relief
Simulation of the plate surface inhomogeneity was performed in the MATHEMATICA environment with employing the second-order spline interpolation [28]. A glass surface has been supposed with the RMS roughness of the order [2, 29].
Using the limit correlation radius rcorr = 75 nm, the correlation length
is supposed, which agrees with the data of [2].
Let the dimensions of the investigated region be 1 × 1 μm2. Based on the known values of Rq and lcorr, a two-dimensional array of random heights in the (x, y) plane is generated, separated by distances comparable to the correlation radius. A set of random values of heights is generated, which corresponds to the normal (Gaussian) distribution law. The variance of the heights’ distribution corresponds to the RMS value (Eq. 1); the range of the height variation is ±20 nm. The use of the second-order spline interpolation allows modeling a continuous distribution from the obtained discrete set of values, which corresponds to an inhomogeneous glass surface (Figure 1).
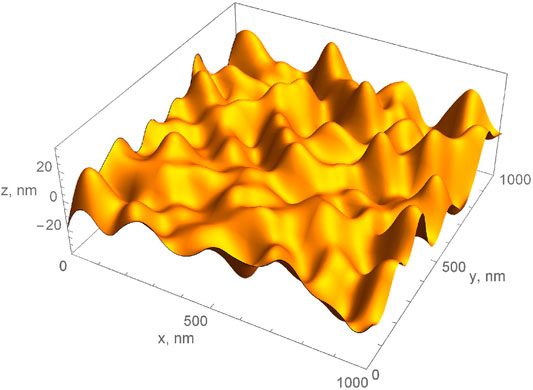
FIGURE 1. A surface region with a correlation length of 150 nm in the distribution of inhomogeneities on an area of 1 × 1 μm2.
In order to study the surface landscape, the continuous height distribution of Figure 1 is replaced by discrete sampling via employment of the standard functions DiscretizeGraphics or DiscretizeRegion of the Mathematica environment. The choice of the shape, size, and the number of sections is set by the condition of obtaining the same areas of all sections, within an error of 0.5–1%, and the possibility of covering the entire investigated surface. Moreover, the size of the area should be consistent with the necessary limits of the probe particle localization (lateral resolution), which was specified as 50–70 nm.
The result of such a layout is a set of areas, mainly in the form of right-angled triangles. The dimensions of the areas are approximately 75 nm in the legs and 106 nm in the hypotenuse. The average area size is 0.0281 μm2. There are 338 such sites in total, which with a 92% probability covers the entire studied surface (Figure 2).
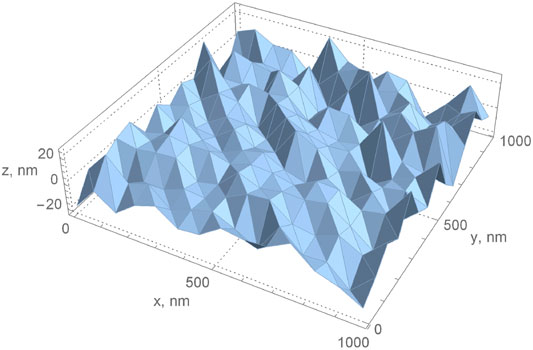
FIGURE 2. Representation of the surface of Figure 1 by the set of discrete areas.
Positioning the Probe Particle on the Surface
As an object of study, we use textured flexible glass surfaces, up to 100 µm thick [1, 17]. With such thicknesses, the number of internal defects in the plate is small, and the plate can be treated as optically homogeneous [30]. As the probe particles, we use the synthesized carbon nanoparticles [18–20] of the size 2a = 50–70 nm (a is the particle radius) suspended in the immersion liquid (water). To perform the surface characterization with the necessary lateral resolution, the probe particle positions should be agreed with the discrete surface representation: one to three benchmark positions within each discrete area of Figure 2 (Figure 3). The spacing between the probe-particle positions is dictated by the particle size and coarsely equals to it; the exact locations of the particle are not principal and are determined by the abilities of the lateral-manipulation techniques employed. The only requirement is that the “network” of the lateral locations be sufficient for the consecutive profile retrieval with the assigned resolution, i.e. 50–70 nm.
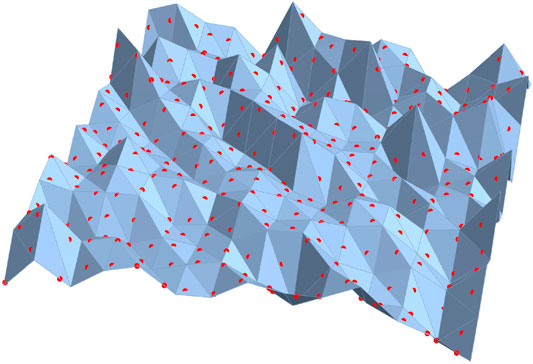
FIGURE 3. Red points show the possible probe particle positions on the discrete areas selected during the surface discrete sampling (cf. Figure 1).
The next problem is to keep the particle at a desirable location with the desirable accuracy. Let the medium permittivity be ε, and a particle with radius a is situated inside the light-wave field. We can accept the condition that a is much less than the wavelength, a << λ, under which the particle experiences the action of the gradient force [23]
where we is the local electric energy density
Here εp is the particle permittivity, and
In our special case, the medium (immersion liquid) is water with the refractive index n = 1.33 and permittivity ε = n2 = 1.77 whereas the particle permittivity for the He-Ne laser wavelength [18–20, 31] and the parameter q value are
The positive value of q means that, despite the absorptive character, such particles are trapped in the intensity maxima, and the optical-tweezer effect can be realized, e.g., by the focused Gaussian laser beam with the radially symmetric complex amplitude distribution [22].
where Φ is the total beam energy flow (power), c is the vacuum light velocity,
so that the energy-density gradient has a radial direction and equals to
Therefore, near the axis r = 0, the transverse gradient force (Eq. 3) can be approximated as
Normally, this force “prevents” the particle from any off-axial displacement and keeps it at the point r = 0. However, thermal fluctuations may impart the particle certain energy sufficient for its deviation from the beam axis, which would result in indeterminacy of the trapped particle’s position. Now our problem is to evaluate the conditions for which such indeterminacy will not destroy the necessary quality of the particle localization. For example, we assume that the particle’s occasional displacement r should not exceed a: this corresponds to the position indeterminacy ±a, which agrees with the overall transverse resolution limited by the particle size 2a. At this displacement, the potential energy of the particle in the force field (Eq. 9) equals to
Since this energy can be supplied by thermal fluctuations, we should compare U with the mean thermal energy kBT where kB is the Boltzmann constant and T is the absolute temperature [32]. Then, the light power sufficient for the particle to be efficiently localized at the axis, immediately follows from equating (Eq. 10) to kBT, which gives
Under the conditions accepted in the paper, the required transverse spatial resolution is limited by the particle size (50–70 nm), so it is possible to take the particle radius a = 25 nm. The size of the focused beam is determined by the focusing conditions. We use the micro-objective with the input pupil and the focal distance, correspondingly,
the corresponding input beam width of the Gaussian envelope is accepted
for the data of (Eq. 12) and He-Ne laser radiation with λ = 633 nm, is b0 = 132 nm, and, due to Eq. 7, its dependence on the longitudinal displacement from the waist cross section z = 0 can be expressed as
For simplicity, we estimate the expression (Eq. 11) for the waist conditions where b = b0. Then, as c = 3·108 m/s and at the room temperature kBT = 4.11·10−21 J [32], from (11) it follows
According to (Eq. 5), the “material” factor 1/nq = 2.15, which means that the trapping-beam power ∼10 mW enables that the particle with high probability will be kept at the beam axis, and the Brownian motion will hardly be able to displace it essentially. But one can easily increase the beam power 2, 3 or even 10 times, which practically warrants the reliable lateral localization of the particle at a desirable place, even in view of multiple simplifying assumptions made during the above calculation. In particular, Eqs. 11, 15 show that any reasonable variation of the particle size a (±20%) will not essentially change the conditions for its trapping and the necessary beam parameters (power, width) can easily be adjusted. Similarly, if the longitudinal position of the particle deviates from the focused-beam waist (which is inevitable in view of the inhomogeneous surface relief) by ±(0.2–0.3)zR, the focused beam radius (14) will grow up to ∼1.1b0, which is not critical, and the particle is still reliably kept by the tweezer beam of properly adapted power. Moreover, it is reasonable to make the longitudinal position of the focused beam waist controllable: when the particle is fixed at a certain lateral location, the waist is adjusted beneath the surface (cf. Figure 4B) so that the energy gradient is directed towards the sample and “presses” the particle to it. This action, in combination with the gravitational and adhesion forces, guarantees the particle’s contact with the surface, so that its vertical coordinate characterizes the local surface height. In contrast, when the particle is to be moved, the waist cross section is “lifted” a bit above the surface thus enabling the particle to “float”.
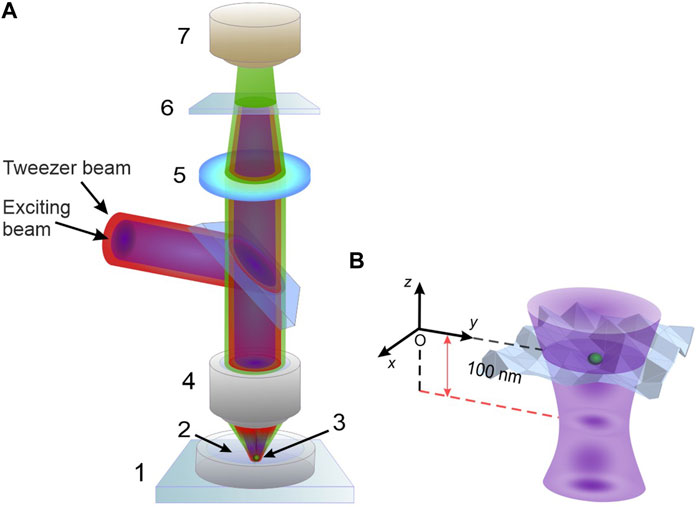
FIGURE 4. (A) Optical arrangement for the particle guiding and luminescence detection: 1, inspected plate; 2, immersion liquid layer; 3, probe particle (rests on the plate surface being the bottom of the immersion layer); 4, microscopic objective; 5, collector; 6, spectral filter; 7, luminescence detector. (B) Illustration of the particle excitation by the violet-light exciting beam.
To sum up the reasoning of this Section, we can conclude that the standard gradient-force optical-tweezer technique enables the efficient and controllable localization of a single fluorescent particle for probing the surface landscape.
Measurement of the Probe Particle Vertical Position
In the above Section, it was demonstrated how the probe particle can be trapped and positioned at arbitrary point of the sample surface with the help of the optical-tweezer beam focused by the micro-objective. Then, to measure the particle’s vertical coordinate, it is illuminated by the exciting light (λ = 405 nm) formed with the help of the similar micro-objective with approximately the same parameters (Eq. 12). This micro-objective forms the focused beam waist at a fixed distance below the base surface plane equaling approximately 100 nm (Figure 4). In this geometry, the waist cross section is, in fact, imaginary but this does not affect the light field acting on the particle (the radiation reflected and scattered by the surface propagates off-surface and practically is not “felt” by the particle “attached” to the sample). Importantly, the vertical gradient of the exciting field intensity supplies additional longitudinal force which, together with the optical-tweezer force (see the previous Section), prevents the particle’s off-surface displacement. Contrary to the tweezer beam, the exciting beam waist position is not variable but strictly fixed and forms the reference level for the surface profile measurements. The exciting beam induces the particle’s fluorescence; the emitted light is collected and transmitted to the luminescence detector. The whole measuring module including the micro-objective as well as the luminescence collection optics is mounted on the movable stage (Figure 4) which enables 3D positioning with necessary lateral and vertical resolution.
The exciting beam size at the waist be0 is determined by Eq. 13 with k replaced by the exciting radiation wavenumber ke corresponding to λ = 405 nm (the input beam size is still determined by the input pupil size, i.e. bi = 8.4 mm as for the tweezer beam); accordingly, be0 = 84 nm. With the distance from the waist plane, the beam size grows according to Eqs. 7, 14,
where
(see Figure 5). Figure 5 shows that variations of z (vertical position of the particle → local height of the surface) in the range 5–10 nm induce remarkable (nearly 3–5%) changes in the exciting intensity and, therefore, in the luminescence emittance, which is sufficient for the reliable surface diagnostics with the required accuracy. Actually, the curve of Figure 5 serves as the calibration curve for determination of the local surface height deviation from the base surface plane and, therefore, is the crucial instrument for the solution of the main problem of the study: surface relief detection with 50-nm lateral and 5-nm vertical resolution.
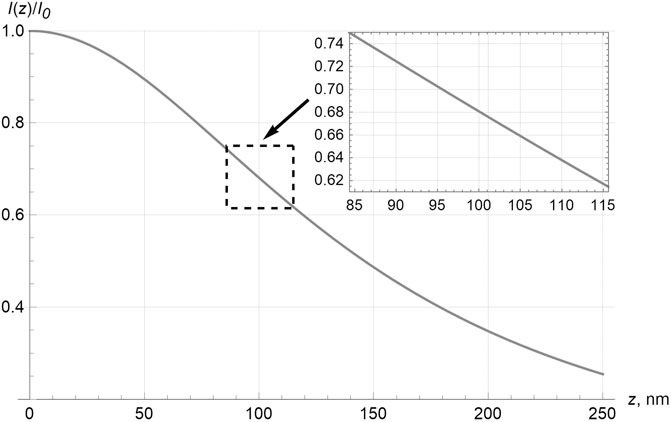
FIGURE 5. Dependence of the exciting beam intensity on the distance from the waist of the focused exciting beam. Inset: magnified region of the dependence near the distance 100 nm.
Surface Profile Reconstruction
The results of the measured intensity of luminescence at different points of the surface area of Figures 1–3 are presented in Figure 6. The relative values of the luminescence response are indicated by the 3D stem diagram. The difference between the luminescence responses in different points is immediately interpreted as the difference in the surface height (Figure 7). As was noted above, the difference in the luminescence of 3–5% is sufficient for diagnostics of 5–10 nm surface inhomogeneities. This means that the inverse problem of the surface relief reconstruction is solved; the modeling results confirm this conclusion.
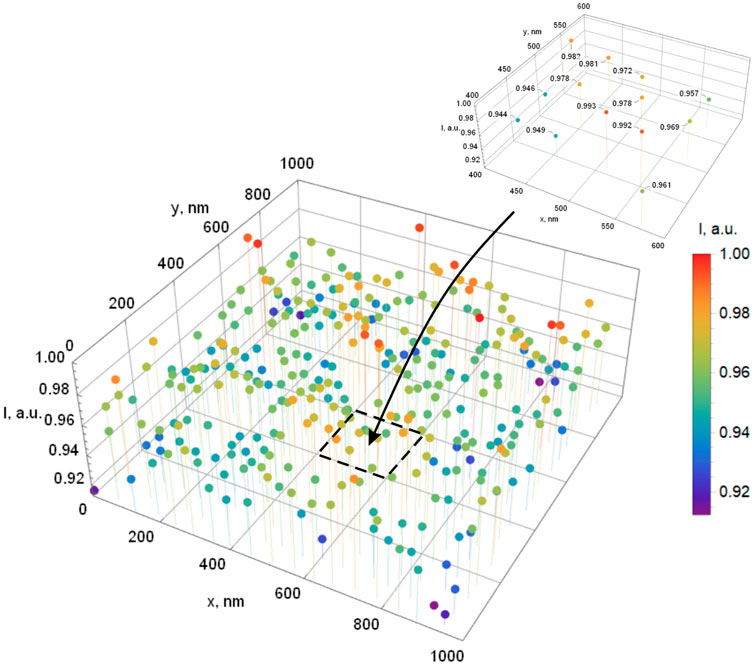
FIGURE 6. Diagram illustrating the luminescence intensity of the carbon nanoparticle in different points of the surface region shown in Figure 1. Inset: magnified area 0.2×0.2 μm2, relative luminescence response is indicated near each point.
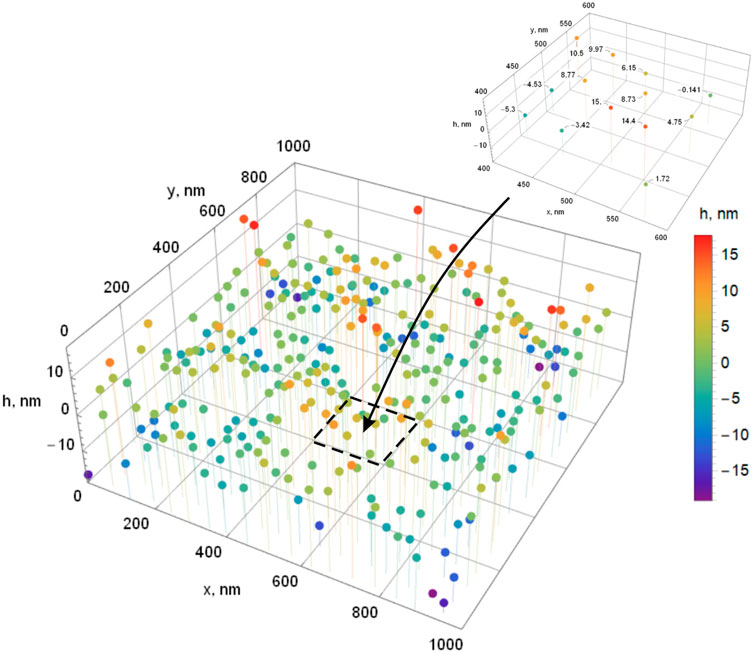
FIGURE 7. Diagram illustrating the results of the surface inhomogeneity reconstruction. Inset shows numerical values of heights in nanometers for the points of the selected area 0.2 × 0.2 μm2 (cf. Figure 6) with respect to the base surface plane.
To recalculate the height and build a map of the surface inhomogeneities, we use the following algorithm. We select a point for which the luminescence intensity is minimal (
where x is the scanning direction. Having the measured values hj in N points xj, the coefficients of the function (Eq. 17) can be determined as [34].
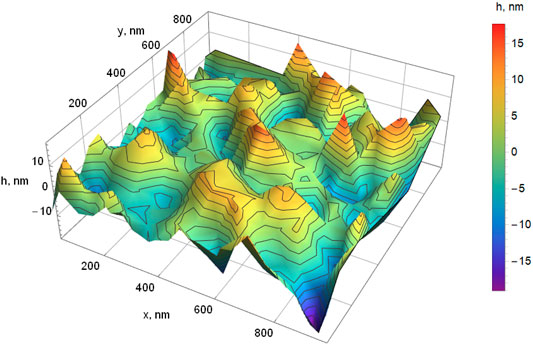
Plausibility of the described approach is confirmed by the numerical simulation of the surface relief reconstruction, which shows, for the RMS surface roughness (Eq. 1), the accuracy of the order Rq = 10 nm ± 6.9%. The modeling results enable to obtain the 3D map of the surface under consideration (Figure 8), and comparison with the input surface data of Figure 1 show that the mean relative deviation amounts to 7.74%.
Conclusion
In this work, a new approach to the surface roughness diagnostics is described, applicable to surfaces with the RMS roughness Rq ≤ 10 nm. The high roughness sensitivity and surface-inhomogeneity detection accuracy are available due to the use of carbon nanoparticles characterized by luminescence in the yellow-green spectrum region; the particles can be trapped and located, by means of an optical tweezer, at any point of the surface with the lateral resolution of 50–70 nm. Such a particle serves as a sensitive diagnostic probe; it can be excited by the 405 nm light, and the luminescence response depends on the particle distance from the fixed waist plane of the exciting beam. As a result, a set of discrete points at different transverse positions is formed with known surface heights. Consequently, the standard means of 2D interpolation enable to reconstruct a three-dimensional landscape of the studied surface with the vertical accuracy of 3–5 nm and the lateral resolution 50–70 nm.
Another peculiar advantage of using the single fluorescent nanoparticle as a movable probe is that in this situation it is possible to construct a spatial model of the studied surface, i.e. obtain its three-dimensional landscape. This fundamental difference distinguishes the proposed approach from the existing techniques described earlier [10–16] where only the data on the rough surface inhomogeneity is available.
The useful features of the presented approach are directly associated with the employment of the high-precision optical tweezer, which is one of the numerous examples of structured light fields that constitute a set of new, extremely suitable instruments for nano-scale diagnostics and technologies [21, 35–37]. In the optical tweezer discussed above, the light’s spatial structure plays a decisive role; however, the complex polarization and spectral structures of probing light fields offer additional promising possibilities in the roughness diagnostics. In particular, the complicated and potentially error-sensitive procedure of the probe particle manipulation may be omitted, if a number of identical particles can be placed upon the rough surface with the density sufficient for the necessary lateral resolution (this situation can be illustrated by Figure 3 if the red points are considered as the real probe particles). Then the main task remains to enable the selective excitation of luminescence from a single deliberately chosen particle. This can be achieved by using the principles of stimulated emission depletion (STED) microscopy [38, 39]: then, instead of the “driving” tweezer beam of Figure 4, a “depleting” beam with the ring-like spatial structure should be applied. Accordingly, during the surface illumination by the coaxial exciting (e.g., of the Gaussian spatial shape) and depleting (e.g., Laguerre-Gaussian, [22, 37, 38]) beams, the conditions can be obtained when only within a small area of the radius ∼10–20 nm, the luminescence is not suppressed. In other words, only one particle is emitting, and analysis of its signal enables to determine the exact vertical position of this particle, i.e. the exact local height of the surface.
The main problem in realization of this idea is to find the nanoparticle species admitting efficient luminescence excitation by the exciting beam and equally efficient luminescence suppression by the depleting one. This problem can be solved, e.g., if one uses plasmonic (high-conductivity) particles of a certain size or morphology, covered by a dielectric layer with built-in fluorophore clusters, provided that the particle’s geometry matches its excitation characteristics [40–42]. In such particles, the radiation with a wavelength of the fluorophore excitation will excite the luminescence, while the radiation with a wavelength of the plasmon resonance will quench it.
On the other hand, the use of anisotropic nanoparticles opens possibilities for the polarization-dependent control of the particle luminescence. For example, if the particle is formed by the high-conductivity nanorod core and the fluorophore shell of the type discussed in the above paragraph, the external light, polarized along the nanorod axis (longitudinally) will excite the fluorescence, whereas when the light is polarized orthogonally (in the transverse plane), the transverse plasmon resonance will be excited, which leads to the luminescence quenching [40]. When such particles are used as the probe particles, their uniform orientation can be achieved due to their anisotropic polarizability and intrinsic dipole moments [43–47], e.g., by means of a static electric field oriented vertically in the geometry corresponding to the arrangement of Figure 4.
Then, the “polarization-dependent” principle of the “single-beam” STED microscopy can be realized. In particular, in a strongly-focused Laguerre-Gaussian beam, the field is no longer paraxial but contains both the transverse (x, y) and longitudinal (z) components [21, 48]. Just near the axis, the electric field is non-zero and polarized longitudinally; this geometry serves to the particle excitation. But with any minor deviation from the beam axis, the longitudinal field decays whereas the transverse components grow essentially [48], which efficiently suppresses the luminescence signal from off-axial particles. Again, the “pure” signal of a single chosen particle can be observed, which gives the information on the local surface height. The detailed analysis and practical realization of these possibilities require further investigations as well as meets certain technological problems, which will be considered in the future.
Data Availability Statement
The original contributions presented in the study are included in the article/Supplementary Material, further inquiries can be directed to the corresponding author.
Author Contributions
OA, CZ, and VT contributed conception and design of the study; DI and VT performed the calculations; DI and JZ organized the database on the surface modeling and reconstruction. CZ wrote the first draft of the manuscript; AB and JZ wrote Introduction and Conclusion; JZ, OA, and VT wrote sections 2 and 5; AB and CZ wrote section 3, DI wrote section 4. All authors contributed to manuscript revision, read and approved the submitted version.
Funding
Research Institute of Zhejiang University–Taizhou, Center for Modern Optical Technology, China.
Conflict of Interest
The authors declare that the research was conducted in the absence of any commercial or financial relationships that could be construed as a potential conflict of interest.
Publisher’s Note
All claims expressed in this article are solely those of the authors and do not necessarily represent those of their affiliated organizations, or those of the publisher, the editors and the reviewers. Any product that may be evaluated in this article, or claim that may be made by its manufacturer, is not guaranteed or endorsed by the publisher.
Acknowledgments
The authors are grateful to Volodymyr Chegel, V. E. Lashkaryov Institute of Semiconductor Physics, National Academy of Science of Ukraine, Kyiv, for fruitful discussions.
References
1. Garner S, Glaesemann S, Li X. Ultra-slim Flexible Glass for Roll-To-Roll Electronic Device Fabrication. Appl Phys A (2014) 116:403–7. doi:10.1007/s00339-014-8468-2
2. Nolan DS, Ravichandran V, Roudas IG, Wolcott CC. Textured Surfaces for Display Applications. United States patent US 10302841B2 (2019). Avaliable at: https://patentimages.storage.googleapis.com/2f/ed/0f/594c99bf70fee9/US10302841.pdf (Accessed December, 2021).
3.Wikipedia. Atomic Force Microscopy (2021). Avaliable at: https://en.wikipedia.org/wiki/Atomic_force_microscopy (Accessed August, 2021).
4. Binnig G, Quate CF, Gerber C. Atomic Force Microscope. Phys Rev Lett (1986) 56:930–3. doi:10.1103/physrevlett.56.930
5.HUATEC GROUP. Roughness Measuring Instrument Handheld. Surface Roughness Tester. Roughness Tester Machine. Beijing (2021). Avaliable at: http://www.huatecgroup.com/sale-12243301-roughness-measuring-instrument-handheld-surface-roughness-tester-roughness-tester-machine.html (Accessed August, 2021).
6. Gao F, Leach RK, Petzing J, Coupland JM. Surface Measurement Errors Using Commercial Scanning white Light Interferometers. Meas Sci Technol (2008) 19(1):015303. doi:10.1088/0957-0233/19/1/015303
7. Aulbach L, Salazar Bloise F, Lu M, Koch A. Non-contact Surface Roughness Measurement by Implementation of a Spatial Light Modulator. Sensors (2017) 17:596. doi:10.3390/s17030596
8. Wyant JC, Koliopoulos CL, Bhushan B, George OE. An Optical Profilometer for Surface Characterization of Magnetic media. A S L E Trans (2008) 27:101–13. doi:10.1080/05698198408981550
9. Wyant JC, Koliopoulos CL, Bhushan B, Basila D. Development of a Three-Dimensional Noncontact Digital Optical Profiler. J Tribol (1986) 108:1–8. doi:10.1115/1.3261137
10. Angelsky OV, Maksymyak PP, Zenkova CY, Hanson SG, Zheng J. Current Trends in Development of Optical Metrology. Opt Mem Neural Networks (2020) 29:269–92. doi:10.3103/s1060992x20040025
11. Angelsky OV, Maksymyak PP, Hanson SG. The Use of Optical-Correlation Techniques for Characterizing Scattering Object and Media. Bellingham, USA: SPIE Press (1999).
12. Angelsky OV, Maksimyak PP. Optical Correlation Diagnostics of Surface Roughness. In: Optical Correlation Applications and Techniques. Bellingham: SPIE Press (2007).
13. Angelsky OV, Maksimyak PP. Optical Correlation Diagnostics of Surface Roughness in Coherent-Domain Optical Methods. In: VV Tuchin, editor. Handbook of Coherent-Domain Optical Methods. Biomedical Diagnostics, Environmental and Material Science, Chapter 2. Boston: Kluwer Academic Publishers (2004).
14. Ruffing B. Application of Speckle-Correlation Methods to Surface-Roughness Measurement: A Theoretical Study. J Opt Soc Am A (1986) 3:1297–304. doi:10.1364/josaa.3.001297
15. Muramatsu M, Eiju T, Shirai T, Matsuda K. Application of a Liquid crystal Spatial Light Modulator on Optical Roughness Measurements by a Speckle Correlation Method Using Two Refractive Indices. Opt Laser Techn (1997) 29:271–3. doi:10.1016/s0030-3992(97)00019-4
16. Brodmann R, Thurn G. Roughness Measurement of Ground, Turned and Shot-Peened Surfaces by the Light Scattering Method. Wear (1986) 109:1–13. doi:10.1016/0043-1648(86)90247-4
17. Garner S, Chowdhury D, Lewis S. Ultrathin Glass Substrates for Thin, Lightweight, Flexible OLED Lighting. Inf Display (2019) 35(4):9–13. doi:10.1002/msid.1045
18. Angelsky OV, Zenkova CY, Hanson SG, Ivansky DI, Tkachuk VM, Zheng J. Random Object Optical Field Diagnostics by Using Carbon Nanoparticles. Opt Express (2021) 29:916–28. doi:10.1364/oe.411118
19. Angelsky OV, Zenkova CY, Ivansky DI, Tkachuk VM, Zheng J. Carbon Nanoparticles for Study Complex Optical fields. J Optoelectron Adv Mater (2021) 23:209–15.
20. Maksimyak PP, Zenkova CY, Tkachuk VM. Carbon Nanoparticles. Production, Properties, Perspectives of Use. PCSS (2020) 21:13–8. doi:10.15330/pcss.21.1.13-18
21. Angelsky OV, Bekshaev AY, Hanson SG, Zenkova CY, Mokhun I, Jun Z. Structured Light: Ideas and Concepts. Front Phys (2020) 8:114. doi:10.3389/fphy.2020.00114
22. Bekshaev A, Bliokh KY, Soskin M. Internal Flows and Energy Circulation in Light Beams. J Opt (2011) 13:053001. doi:10.1088/2040-8978/13/5/053001
23. Bekshaev AY. Subwavelength Particles in an Inhomogeneous Light Field: Optical Forces Associated with the Spin and Orbital Energy Flows. J Opt (2013) 15:044004. doi:10.1088/2040-8978/15/4/044004
24. Abouelatta OB. 3D Surface Roughness Measurement Using a Light Sectioning Vision System. In: Proceedings of the World Congress on Engineering, London, United Kingdom, June 30–July 2, 2010, 1 (2010). p. 698–703.
25. Pöller F, Salazar Bloise F, Jakobi M, Wang S, Dong J, Koch AW. Non-Contact Roughness Measurement in Sub-micron Range by Considering Depolarization Effects. Sensors (2019) 19(10):2215. doi:10.3390/s19102215
26. Lehmann P, Tereschenko S, Xie W. Fundamental Aspects of Resolution and Precision in Vertical Scanning white-light Interferometry. Surf Topogr.: Metrol Prop (2016) 4:024004. doi:10.1088/2051-672x/4/2/024004
27. Dienerowitz M, Mazilu M, Dholakia K. Optical Manipulation of Nanoparticles: a Review. J Nanophoton (2008) 2:021875. doi:10.1117/1.2992045
28.Wolfram. Wolfram MATHEMATICA Online (2021). Avaliable at: https://www.wolfram.com/mathematica/online/ (Accessed August, 2021).
29. Otte E, Tekce K, Lamping S, Ravoo BJ, Denz C. Polarization Nano-Tomography of Tightly Focused Light Landscapes by Self-Assembled Monolayers. Nat Commun (2019) 10:4308. doi:10.1038/s41467-019-12127-3
30.NgpeDia. Great Encyclopedia of Oil and Gas. Electric Strength. Glass (2021). Avaliable at: https://www.ngpedia.ru/id347726p2.html (Accessed August, 2021).
31. Bond TC, Bergstrom RW. Light Absorption by Carbonaceous Particles: An Investigative Review. Aerosol Sci Techn (2006) 40(1):27–67. doi:10.1080/02786820500421521
32.Wikipedia. kT Energy (2021). Avaliable at: https://en.wikipedia.org/wiki/KT_(energy) (Accessed August, 2021).
33.Gentec-EO. The Beginner’s Guide on Spot Size of Laser Beam (2021). Avaliable at: https://www.gentec-eo.com/blog/spot-size-of-laser-beam (Accessed August, 2021).
34. Grigor’ev AY. Physics and Microgeometry of Technical Surfaces. Minsk: Belaruskaya Navuka (2016). p. 247.
35. Rubinsztein-Dunlop H, Forbes A, Berry MV, Dennis MR, Andrews DL, Mansuripur M, et al. Roadmap on Structured Light. J Opt (2017) 19:013001. doi:10.1088/2040-8978/19/1/013001
36. Angelsky OV, Zenkova CY, Hanson SG, Zheng J. Extraordinary Manifestation of Evanescent Wave in Biomedical Application. Front Phys (2021) 8:159. doi:10.3389/fphy.2020.00159
37. Angelsky OV, Bekshaev AY, Dragan GS, Maksimyak PP, Zenkova CY, Zheng J. Structured Light Control and Diagnostics Using Optical Crystals. Front Phys (2021) 9:715045. doi:10.3389/fphy.2021.715045
38. Hell SW, Wichmann J. Breaking the Diffraction Resolution Limit by Stimulated Emission: Stimulated-Emission-Depletion Fluorescence Microscopy. Opt Lett (1994) 19(11):780–2. doi:10.1364/OL.19.000780
39. Novotny L, Hecht B. Spatial Resolution and Position Accuracy. In: Principles of Nano-Optics. Cambridge: Cambridge University Press (2006). p. 89–133. doi:10.1017/CBO9780511813535.005
40. Ming T, Zhao L, Yang Z, Chen H, Sun L, Wang J, et al. Strong Polarization Dependence of Plasmon-Enhanced Fluorescence on Single Gold Nanorods. Nano Lett (2009) 9(11):3896–903. doi:10.1021/nl902095q
41. Demchenko A. Excitons in Carbonic Nanostructures. C-J Carbon Res (2019) 55(4):71. doi:10.3390/c5040071
42. Kamanina NV, Shurpo NA, Likhomanova SV, Timonin DN, Serov SV, Barinov OV, et al. Features of the Nanostructured Composites. In: Tenth International Conference on Material Technologies and Modeling. Ariel, Israel: Ariel University (2011). p. 77–85. Avaliable at: https://www.ariel.ac.il/sites/conf/mmt/ws2011/service%20files/papers/77-85.pdf.
43. Otani M, Okada S, Okamoto Y. Intrinsic Dipole Moment on the Capped Carbon Nanotubes. Phys Rev B (2009) 80:153413. doi:10.1103/PhysRevB.80.153413
44. Martin JW, Slavchov RI, Yapp EKY, Akroyd J, Mosbach S, Kraft M. The Polarization of Polycyclic Aromatic Hydrocarbons Curved by Pentagon Incorporation: The Role of the Flexoelectric Dipole. J Phys Chem C (2017) 121:27154–63. doi:10.1021/acs.jpcc.7b09044
45. Kutrovskaya S, Chestnov I, Osipov A, Samyshkin V, Sapegina I, Kavokin A, et al. Electric Field Assisted Alignment of Monoatomic Carbon Chains. Sci Rep (2020) 10:9709. doi:10.1038/s41598-020-65356-8
46. Lethiec C, Laverdant J, Vallon H, Javaux C, Dubertret B, Frigerio J-M, et al. Measurement of Three-Dimensional Dipole Orientation of a Single Fluorescent Nanoemitter by Emission Polarization Analysis. Phys Rev X (2014) 4:021037. doi:10.1103/physrevx.4.021037
47. Lotito V, Sennhauser U, Hafner CV, Bona G-L. Interaction of an Asymmetric Scanning Near Field Optical Microscopy Probe with Fluorescent Molecules. Pier (2011) 121:281–99. doi:10.2528/PIER11091703
Keywords: rough surface, inhomogeneity diagnostics, carbon nanoparticles, optical manipulation, luminescent probe, particle position, surface reconstruction
Citation: Angelsky OV, Bekshaev AY, Zenkova CY, Ivansky DI, Zheng J and Tkachuk VM (2022) Fluorescence Record Diagnostics of 3D Rough-Surface Landscapes With Nano-Scale Inhomogeneities. Front. Phys. 9:787821. doi: 10.3389/fphy.2021.787821
Received: 01 October 2021; Accepted: 21 December 2021;
Published: 13 January 2022.
Edited by:
Venu Gopal Achanta, Tata Institute of Fundamental Research, IndiaReviewed by:
Richa Goel, Tata Institute of Fundamental Research, IndiaArindam Dasgupta, Missouri University of Science and Technology, United States
Copyright © 2022 Angelsky, Bekshaev, Zenkova, Ivansky, Zheng and Tkachuk. This is an open-access article distributed under the terms of the Creative Commons Attribution License (CC BY). The use, distribution or reproduction in other forums is permitted, provided the original author(s) and the copyright owner(s) are credited and that the original publication in this journal is cited, in accordance with accepted academic practice. No use, distribution or reproduction is permitted which does not comply with these terms.
*Correspondence: J. Zheng, ZGJ6akBuZXRlYXNlLmNvbQ==; A. Y. Bekshaev, YmVrc2hhZXZAb251LmVkdS51YQ==
 O. V. Angelsky
 A. Y. Bekshaev
 C. Yu. Zenkova
 D. I. Ivansky2
 J. Zheng