- 1Center of Applied Laser, Technical Institute of Physics and Chemistry, Chinese Academy of Sciences, Beijing, China
- 2University of Chinese Academy of Sciences, Beijing, China
The blood flow in the coronary artery (CA) is pulsatile and much higher than that measured in the brain, retina, and skin before. Its quantitative measurement is medically significant in the coronary artery bypass grafting (CABG). Here, to the best of our knowledge, we first detect the pulsatile flow using the laser speckle contrast imaging technique. Since the factors influencing the flow rate in the CA are complex, we developed a comprehensive model, a speckle triangle assessment (STA), to assess the characteristics of the flow: the speckle flow index (SFI), mean flow index (MFI), and pulsatility index (PI). The phantom experiment was performed and found that our customized setup possessed high dynamic range of the velocity measurement with good sensitivity. It also indicated that the pulsatile flow estimated by the speckle triangle assessment is promising to obtain a more accurate assessment of a coronary artery’s patency in the CABG.
Introduction
The heart works like a pump, performing the alternating activities of contraction and relaxation to provide energy for the blood circulation. Unfortunately, the gradually increasing coronary heart disease has been severely threatening the normal blood circulation. Medically, the coronary artery bypass grafting (CABG) is the main method for the treatment of severe coronary heart disease [1–3], where the accurate blood flow monitoring of the coronary artery before and after CABG is significant.
For the blood flow quantitative measurement, laser speckle blood flow imaging (LSBFI) as a minimally invasive full-field imaging technique has attracted extensive attention. A number of methods have been used to measure the blood flow including laser speckle contrast imaging (LSCI) [4–7], multi-exposure speckle imaging (MESI) [8, 9], dynamic light scattering imaging (DLSI) [10], time varied illumination laser speckle contrast imaging (TVI–LSCI) [11], and dynamic light scattering laser speckle contrast imaging (DLS–LSCI) [12]. These methods were performed in relatively small vessels, such as the cerebrum, the retina, and the skin. Furthermore, since those vessels are elastic and the vessels are far from the beating heart, the blood flow velocity is nearly steady.
However, the blood flow of the coronary artery (CA) is significantly different from the small vessels measured before. First, the inner diameter is much larger. Second, the flow rate is much higher. Third, the flow speed of the CA, as the secondary artery, is pulsatile. In CABG, there are multiple factors that can affect the blood flow velocity. Physiological factors like spasm in the graft or native coronary, mean arterial pressure, and run-off in the myocardium will affect the flow velocity. The size of the vessels and a patient’s weight are also factors that will affect the flow rate. Technical problems such as thrombus formation, twist or kinks of the graft, or air bubbles, and misapplied stitches will reduce the flow. Medically, all the factors are summarized to a triangle assessment model: mean flow (MF), pulsatile index (PI), and diastolic filling percentage (DF) using the transit time flow measurement (TTFM) technology [13]. Nevertheless, TTFM is limited to measure the graft other than the CA. In addition, TTFM cannot map the spatial distribution of the blood flow velocity. Since LSCI has been widely attempted in many clinical and biomedical applications during recent years [14–16], the LSCI technology is promising to detect the flow of the CA and has not been reported. In this study, to obtain a more accurate assessment of the pulsatile flow of the CA, we developed a speckle triangle assessment using the LSCI model: the speckle flow index (SFI), mean flow index (MFI), and pulsatility index (PI). The phantom experiment is performed. First, the system parameter and the scattering type of the sample were determined. Second, the measurable dynamic range and the sensitivity of velocity measurement were calibrated and improved. Finally, the three parameters were calculated by analyzing the dynamic speckle patterns to synthetically assess the different pulsatile flows.
Principles
Laser speckle contrast imaging (LSCI) maps the two-dimensional blood flow rapid changes based on analyzing speckle contrast linked to the electric field autocorrelation time of the fluctuating speckle. The speckle contrast changes in accordance with the movement of the scatters, and it is larger at smaller velocities, and vice versa. Theoretically, the speckle contrast (K) is characterized by the standard deviation of intensity normalized with the mean intensity given as follows:
where σI is the standard deviation and <I> is the average of the speckle intensity. Assuming that the static scattering component is completely removed, the speckle decorrelation time τc can be derived in the following way [17, 18]:
where K is the speckle contrast, T is the exposure time, and the constant β is a normalization factor depending on the speckle size, pixel size, the source, and additional factors of the experimental setup. The inverse correlation time (1/τc) is considered to be proportional to the speed of the moving particles (such as red blood cells). Hereby we term the T/τc as speckle flow index (SFI) to represent the flow velocity.
For the coronary artery (CA), factors influencing the blood flow are complex: the artery pressure, the size of the vessel, the quality of the coronary bed, and so on. Looking at only the flow velocity may not be enough. It is necessary to “see the whole picture.” Here, we evaluated three parameters to assess the blood flow: speckle flow index (SFI), mean flow index (MFI), and pulsatility index (PI).
When the dynamic SFI distribution is averaged, the mean flow index (MFI) can be obtained. In addition, the pulsatility index, or PI, is defined as the difference between the maximum (SFImax) and minimum flow (SFImin) divided by the mean flow (MFI). A large difference between the maximum and minimum flow will lead to a high PI value. The expression is given as follows:
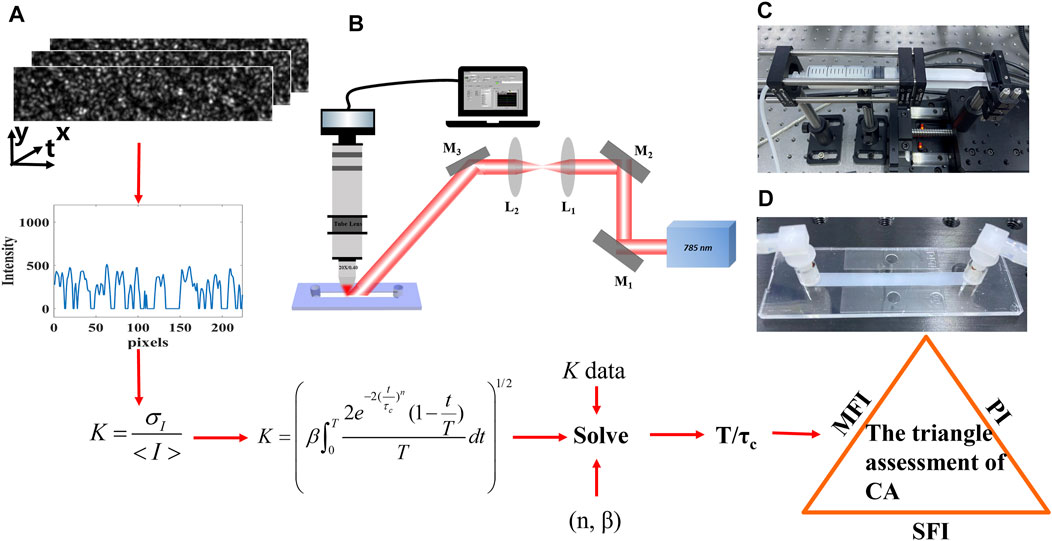
The details on the derivation process are illustrated in Figure 1A: First, we convert the raw speckle images to speckle contrast images using Eq. 1. Second, we compute the β and the dynamic scattering type n by the dynamic light scattering imaging technique. Third, we substitute the β and n to Eq. 2, and the inverse correlation time (T/τc) is solved to represent the flow velocity. Eventually, we assess the flow with the SFI, MFI, and PI.

FIGURE 1. Schematic of the experiment. (A) Flowchart of the model and derivation process. (B) Diagram of the illuminating and imaging system. M, mirror; L, lens. (C) Step motor. (D) Microfluidic device.
Experimental Setup
We implemented a phantom experiment with the 1% concentration intralipid fluid in Figure 1B. A laser diode (λ = 785 nm) was placed on a mount with a thermoelectric cooling stage (LDM56, Thorlabs, United States). The laser spot was collimated and expanded, illuminating on a microfluidic device. The scattered speckle was recorded by the customized imaging system, which consists of an objective lens (5X, Nikon, Japan), tube lens (TTL200, Thorlabs, United States), and a high-speed camera (Mikrotron, German). Besides, a polarizer and filter were assembled to increase the contrast. In addition, the high-speed camera combined with an image acquisition card (KAYA Instrument, Israel) was used to record the dynamic scattering light. A customized software along with the data acquisition card DAQ (NI USB–6251) was written to control the timing of the step motor (Zolix, KA050, China) and synchronize it with image acquisition. The speckle size was larger than the camera pixel size [19, 20]. The CCD’s exposure time was set to 26 μs with a frame rate of 2000 Hz.
The 1% concentration intralipid fluid was pumped by the step motor (Figure 1C) whose movement undergoes the acceleration stage and then the deceleration stage with different peak velocities. The microfluidic device is shown in Figure 1D. Its cross section is rectangular (50 mm × 5 mm × 0.4 mm). The dimensions were adopted to mimic the coronary artery (cross-sectional area 2 mm2), which is usually chosen for bypass in the CABG.
Results and Discussion
High Dynamic Range and Sensitivity of the Velocity Measurements
When the laser speckle contrast imaging (LSCI) technique is used to quantify the flow velocity, the range and the sensitivity of the flow speed estimation have been shown to depend on many experimental parameters such as the coherence factor β, exposure time, the static scattering, light intensity, and the camera noise [8, 21, 22]. For the phantom experiment, the static scattering component was removed from the surface of the microfluidic device. Besides, since light absorption is much lower than the tissue, the intensity on the imaging plane is higher than the camera noise, and thus, a high signal-to-noise ratio can be obtained. Therefore, the effects of the light intensity and camera noise are ignored here. We focus on the first two factors.
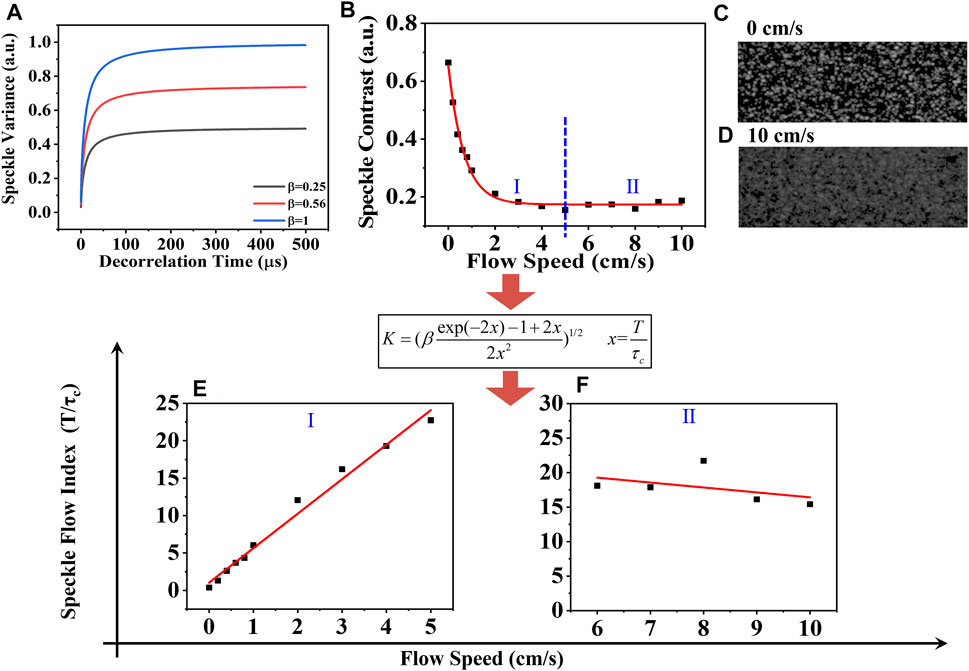
In Figure 2A, we theoretically show speckle contrast K versus the speckle decorrelation time τc for different β values. There is a rapid increase in all three curves when τc is small. When β is equal to one, speckle contrast approaches 1, which means the maximum velocity range estimation can be measured with β equal to one. When β becomes smaller to 0.56 and 0.25, speckle contrast approaches 0.74 and 0.43, respectively, with a decreased measurable range. Therefore, the coherence factor β determines the range of the flow speed estimation. The β value of the setup can be obtained using two methods: Firstl, according to Eq. 2, when x tends to zero, the spatial speckle variance K will tend to β, so β can be obtained by computing the local speckle contrast in the corresponding spatial windows [21, 22]. Second, it can be calculated as a fitting parameter with the dynamic scattering light imaging (DSLI) technique [10]. Here, the parameter β of our setup was determined to be 0.56 using the DSLI method in our previous work [12].

FIGURE 2. (A) Speckle contrast as a function of the decorrelation time τc by Eq. 2. (B) Speckle contrast varies with the different flow velocities. (C) and (D) Speckle patterns at 0 cm/s and 10 cm/s. The relationship between the SFI and the actual velocity in the range from (E) 0 cm/s to 5 cm/s and (F) 5 cm/s to 10 cm/s. Black squares represent experimental data, and red solid lines represent fitting curve.
To further validate the measurable velocity range with our experimental setup, the varying flow velocity from 0 cm/s to 10 cm/s was separately driven by the step motor. The increasing step was first set to be 0.1 cm/s from 0 cm/s to 1 cm/s and then 1 cm/s from 1 cm/s to 10 cm/s. Because a long exposure time decreases the speckle contrast signal resulting in a low SNR, the exposure time here is set to be 26 μs. Figure 2B shows that the speckle contrast K decreased from 0.68 to 0.15 with the increasing velocity from 0 cm/s to 5 cm/s, termed as Ⅰ, and eventually fluctuated around 0.17 with further increasing velocity, termed as Ⅱ. The black squares represent the experimental data. The red line is the fitting curve, K = 0.48e(-v/0.67) + 0.17. The speckle patterns at 0 cm/s and 10 cm/s are shown in Figures 2C, D.
Afterward, we computed the speckle flow index (SFI: T/τc) using Eq. 2. In Figures 2E,F, we show the relationship between the SFI and the actual velocity. The black squares correspond to the experimental data. The red line is the fitting curve. In part Ⅰ, one can observe the linear response range as the velocity increases from 0 cm/s to 5 cm/s, during which the fitting function is SFI = 1.03 + 4.61v. It was found that the sensitivity of the velocity measurements remained nearly constant. While in part Ⅱ, the SFI slightly decreased with the increasing velocity. This is because the scattered light from the static scattering medium under the microfluidic device always affects the relative flow speed estimation. Another possible reason is that the spatial correlation between the pixels exists, that is, the speckle size is larger than one pixel size, which is necessary for obtaining a larger coherent parameter β to measure lower flow velocity. A trade-off is needed here. Therefore, the maximum speed that could be obtained was greatly improved to be 5 cm/s with our setup. Although the range and the sensitivity decrease with velocity due to the presence of noise, this is the highest dynamic range of flow speed measurement, to the best of our knowledge.. Afterward, the following experiment with the velocity from 0 cm/s to 5 cm/s can be conducted.
Pulsatile Flow Measurement by a Speckle Triangle Assessment
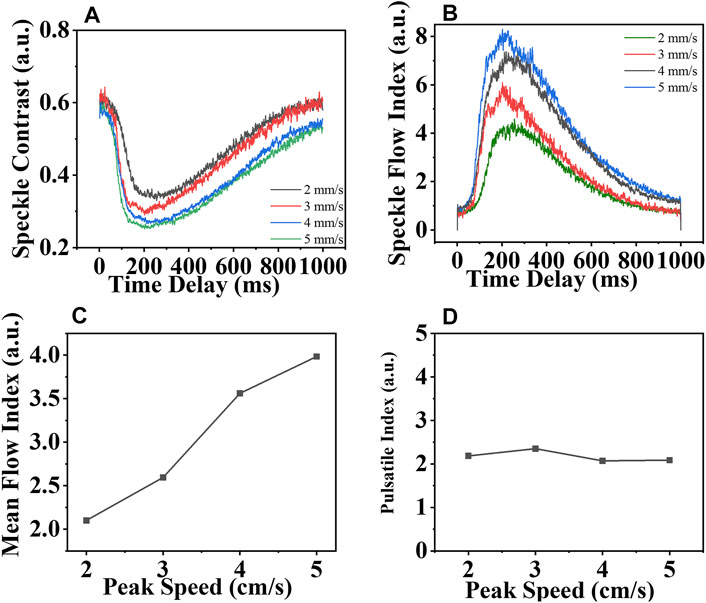
To accurately mimic the characteristics of the pulsatile flow velocity, the step motor was programmed to drive the sample, with which the image acquisition was strictly synchronized. The peak velocities varied from 2 cm/s to 5 cm/s in the step of one. As shown in Figure 3A, due to the characteristics of the flow velocity, the speckle contrast decreased initially and then showed an increasing trend with time, which was termed as “time delay.” Using the speckle contrast data, the pulsatile SFI (T/τc) was obtained using Eq. 2 in Figure 3B; first rising up and then slowing down, which mimicked the characteristics of the diastolic blood flow of the coronary artery. Because the diastolic filling percentage (DF%) cannot be measured without the electrocardiogram (ECG) connected to the system in this phantom experiment, the SFI is obtained instead. Once the speckle triangle assessment is conducted with the ECG, the SFI estimation can be easily converted to DF%. Afterward, the mean flow index, MFI, was calculated, as shown in Figure 3C. The MFI increased with the velocity linearly. Similar to the SFI estimation, MFI is not only an indication of a compromised CA but also part of the flow information. Eventually, in Figure 3D, the pulsatile index (PI) was obtained using Eq. 3. despite the different SFI profiles and the increasing MFI, the PI remained constant at 2.17 ± 0.13. Normally, the PI value is less than 5.0 [13]. Higher or lower PI indicates the possible error in CABG, which introduces one to correct it. We contended that the blood flow changes in the physiology characterized by the speckle triangle assessment would take on more comprehensive information about the flow velocity of the CA than the MFI estimation before.

FIGURE 3. (A) Speckle contrast and (B) Speckle flow index vary with time; (C) mean flow index and (D) pulsatile index varies with the pulsatile velocity whose peak velocity increases from 2 cm/s to 5 cm/s.
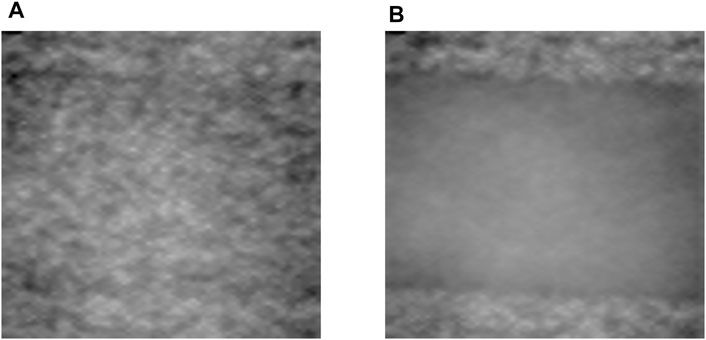
More than the quantitative assessment for the flow velocity, the LSCI technology can image the spatial distribution of the flow speed. We replaced the microscopic imaging system with an f–50 mm imaging lens for a larger viewing field. Figure 4 shows the speckle image when the sample is flowing at 0 cm/s and 5 cm/s. It is obvious that the higher flow speed produced less speckle, making the outline of the vessel clear. That indicates the two-dimension flow distribution of the CA in CABG is possible. Because the blood vessels are covered by the tissue (static scattering component), we would further obtain the dynamic SFI map with the pulsatile speed cycle under different static scattering in our next work.
Conclusion
In conclusion, we presented a new model, to the best of our knowledge, speckle triangle assessment (STA), to comprehensively account for the characteristics of pulsatile flow velocity to mimic the coronary artery (CA). The calculation of the STA model is based on the laser speckle contrast imaging (LSCI) technology. The coherent parameter β of our customized speckle imaging instrument was first calibrated and measured, which enables the velocity measurements not only to be more sensitive to the velocity changes (0.1 cm/s) but also to be of much higher dynamic range (up to 5 cm/s). Coupled with the ability to discriminate flows in the pulsatile mode, the STA model, speckle flow index (SFI), mean flow index (MFI), and pulsatile index (PI) were separately computed, among which SFI helped to obtain the diastolic filling percentage (DF%) when the electrocardiogram (ECG) was connected; the MFI was used to quantify the dynamic flow speed, and the PI value was used to check possible technical errors in CABG. We contended that the STA model would enable us to obtain a more comprehensive estimation of the pulsatile flow for further animal CABG experiment, and that would be compatible with the future embedded speckle blood flow device. In addition, this customized setup can be applied to ghost imaging [23, 24] and ghost cytometry [25] in biological engineering.
Data Availability Statement
The original contributions presented in the study are included in the article/Supplementary Material; further inquiries can be directed to the corresponding author.
Author Contributions
YY was responsible for article conception, model building, code implementation, and writing; YB was responsible for guidance and model construction; XG was responsible for constructing the optical path and help take some data; and WG, corresponding author, was responsible for guidance and revision work.
Funding
The Special Project of Central Government Guiding Local Science and Technology Development in Beijing 2020 (Z20111000430000); Key-Area Research and Development Program of Guangdong Province (2019B010926001); and National Key Research and Development Program of China (2016YFb0402000).
Conflict of Interest
The authors declare that the research was conducted in the absence of any commercial or financial relationships that could be construed as a potential conflict of interest.
Publisher’s Note
All claims expressed in this article are solely those of the authors and do not necessarily represent those of their affiliated organizations, or those of the publisher, the editors, and the reviewers. Any product that may be evaluated in this article, or claim that may be made by its manufacturer, is not guaranteed or endorsed by the publisher.
References
1. Uva MS, Neumann FJ, Ahlsson A, Alfonso F, Banning AP, Benedetto U, et al. ESC Scientific Document Group, “Guidelines on Myocardial Revascularization”. Eur Heart J (2018) 25:4–90. doi:10.1093/eurheartj/ehy394
2. Hillis LD, SmithSmith PK, Anderson JL, Bittl JA, Bridges CR, Byrne JG, et al. 2011 ACCF/AHA Guideline for Coronary Artery Bypass Graft Surgery. A Report of the American College of Cardiology Foundation/American Heart Association Task Force on Practice Guidelines. Developed in Collaboration with the American Association for Thoracic Surgery, Society of Cardiovascular Anesthesiologists, and Society of Thoracic Surgeons. J Am Coll Cardiol (2011) 58(23):e123–210. doi:10.1016/j.jacc.2011.08.009
3. Paluszkiewicz L, Kwinecki P, Jemielity M, Szyszka A, Dyszkiewicz W, Cieśliński A. Myocardial Perfusion Correlates with Improvement of Systolic Function of the Left Ventricle after CABG. Dobutamine Echocardiography and Tc-99m-MIBI SPECT Study. Eur J Cardiothorac Surg (2002) 21(1):32–5. doi:10.1016/s1010-7940(01)01078-8
4. Goodman JW. Speckle Phenomena in Optics: Theory and Application. Roberts and Company Publishers. United states. (2007).
5. Duncan DD, Kirkpatrick SJ, Wang RK. Statistics of Local Speckle Contrast. J Opt Soc Am A (2008) 25:9–15. doi:10.1364/josaa.25.000009
6. Dunn AK, Bolay H, Moskowitz MA, Boas DA. Dynamic Imaging of Cerebral Blood Flow Using Laser Speckle. J Cereb Blood Flow Metab (2001) 21:195–201. doi:10.1097/00004647-200103000-00002
7. Le TM, Paul JS, Al-Nashash H, Tan A, Luft AR, Sheu FS, et al. New Insights into Image Processing of Cortical Blood Flow Monitors Using Laser Speckle Imaging. IEEE Trans Med Imaging (2007) 26:833–42. doi:10.1109/tmi.2007.892643
8. Parthasarathy AB, Tom WJ, Gopal A, Zhang X, Dunn AK. Robust Flow Measurement with Multi-Exposure Speckle Imaging. Opt Express (20081989) 16(3):1975. doi:10.1364/oe.16.001975
9. Kazmi SMS, Balial S, Dunn AK. Optimization of Camera Exposure Durations for Multi-Exposure Speckle Imaging of the Microcirculation. Biomed Opt Express (2014) 5(7):2157–71. doi:10.1364/boe.5.002157
10. Postnov DD, Tang J, Sefik Evren E, Erdener SE, Kılıç K, Boas DA. Dynamic Light Scattering Imaging. Sci Adv (2020) 6:eabc4628. doi:10.1126/sciadv.abc4628
11. Siket M, Jánoki I, Demeter K, Földesy MP, Peter F. Time Varied Illumination Laser Speckle Contrast Imaging. Opt Lett (2021) 46(4):713. doi:10.1364/ol.413767
12. Yuan Y, Bi Y, Gao XC, Sun MY, Gao WN. High-dynamic-range Blood Flow Rate Measurement in a Large-Diameter Vessel. Appl Opt (2021) 60(23):6837–42. doi:10.1364/ao.432846
13. Kieser TM, Teresa M. Graft Quality Verification in Coronary Artery Bypass Graft Surgery: How, when and Why? Curr Opin Cardiol (2017) 32:722–36. doi:10.1097/HCO.0000000000000452
14. Hecht N, Müller M-M, Sandow N, Pinczolits A, Vajkoczy P, Woitzik J. Infarct Prediction by Intraoperative Laser Speckle Imaging in Patients with Malignant Hemispheric Stroke. J Cereb Blood Flow Metab (2016) 36:1022–32. doi:10.1177/0271678x15612487
15. Ringkamp M, Wooten M, Carson BS, Lim M, Hartke T, Guarnieri M. Laser Speckle Imaging to Improve Clinical Outcomes for Patients with Trigeminal Neuralgia Undergoing Radiofrequency Thermocoagulation. Jns (2016) 124:422–8. doi:10.3171/2015.1.jns14408
16. Milstein DMJ, Ince C, Gisbertz SS, Boateng KB, Geerts BF, Hollmann MW, et al. Laser Speckle Contrast Imaging Identifies Ischemic Areas on Gastric Tube Reconstructions Following Esophagectomy. Medicine (2016) 95:e3875. doi:10.1097/md.0000000000003875
17. Boas DA, Dunn AK. Laser Speckle Contrast Imaging in Biomedical Optics. J Biomed Opt (2010) 15(1):011109. doi:10.1117/1.3285504
18. Bandyopadhyay R, Gittings AS, Suh SS, Dixon PK, Durian DJ. Speckle-visibility Spectroscopy: A Tool to Study Time-Varying Dynamics. Rev Scientific Instr (2005) 76:093110. doi:10.1063/1.2037987
19. Kirkpatrick SJ, Duncan DD, Wells-Gray EM. Detrimental Effects of Speckle-Pixel Size Matching in Laser Speckle Contrast Imaging. Opt Lett (2008) 33:2886–8. doi:10.1364/ol.33.002886
20. Yuan Y, Bi Y, Sun MY, WangWang DZ, WangWang DD, Gao WN, et al. Speckle Evaluation in Laser Display: From Speckle Contrast to Speckle Influence Degree. Opt Commun (2020) 454:124405. doi:10.1016/j.optcom.2019.124405
21. Wang Y, Wen D, Chen X, Huang Q, Chen M, Lu J, et al. Improving the Estimation of Flow Speed for Laser Speckle Imaging with Single Exposure Time. Opt Lett (2017) 42:57. doi:10.1364/ol.42.000057
22. Wang Y, Lv W, Chen X, Lu J, Li P. Improving the Sensitivity of Velocity Measurements in Laser Speckle Contrast Imaging Using a Noise Correction Method. Opt Lett (2017) 42:4655. doi:10.1364/ol.42.004655
23. Yu Hang H, Zhang AX, Fei Li M, Huan YY, Quan BG, Zhang Li D. Ling an Wu and Li Ming Chen, “High-Resolution Sub-sampling Incoherent X–ray Imaging with a Single-Pixel Detector”. APL Photon (2020) 5:056102.
24. He Y-H, Wu L-A, Chen L-M, Wang B-B. Tabletop X-ray Ghost Imaging with Ultra-low Radiation. Optica (2018) 5(4):374. doi:10.1364/optica.5.000374
Keywords: pulsatile flow measurement, laser speckle, speckle triangle assessment, speckle flow index, pulsatile index
Citation: Yuan Y, Bi Y, Gao XC and Gao WN (2021) Pulsatile Flow Measurement by a Speckle Triangle Assessment. Front. Phys. 9:785540. doi: 10.3389/fphy.2021.785540
Received: 29 September 2021; Accepted: 26 October 2021;
Published: 29 November 2021.
Edited by:
Yufei Ma, Harbin Institute of Technology, ChinaReviewed by:
Qiang Liu, Tsinghua University, Beijing, ChinaJin Yu, Aerospace Information Research Institute (CAS), China
Copyright © 2021 Yuan, Bi, Gao and Gao. This is an open-access article distributed under the terms of the Creative Commons Attribution License (CC BY). The use, distribution or reproduction in other forums is permitted, provided the original author(s) and the copyright owner(s) are credited and that the original publication in this journal is cited, in accordance with accepted academic practice. No use, distribution or reproduction is permitted which does not comply with these terms.
*Correspondence: Wei Nan Gao, d25nYW9AbWFpbC5pcGMuYWMuY24=
 Yuan Yuan
 Yong Bi1