
95% of researchers rate our articles as excellent or good
Learn more about the work of our research integrity team to safeguard the quality of each article we publish.
Find out more
ORIGINAL RESEARCH article
Front. Phys. , 10 December 2021
Sec. Low-Temperature Plasma Physics
Volume 9 - 2021 | https://doi.org/10.3389/fphy.2021.779204
This article is part of the Research Topic Numerical Simulations of Plasma Thrusters and/or Related Technologies View all 8 articles
Energy losses in a magnetic nozzle radiofrequency plasma thruster are investigated to improve the thruster efficiency and are calculated from particle energy losses in fully kinetic simulations. The simulations calculate particle energy fluxes with a vector resolution including the plasma energy lost to the dielectric wall, the plasma beam energy, and the divergent plasma energy in addition to collisional energy losses. As a result, distributions of energy losses in the thruster and the ratios of the energy losses to the input power are obtained. The simulation results show that the plasma energy lost to the dielectric is dramatically suppressed by increasing the magnetic field strength, and the ion beam energy increases instead. In addition, the divergent ion energy and collisional energy losses account for approximately 4%–12% and 30%–40%, respectively, regardless of the magnetic field strength.
Magnetic nozzle radiofrequency (RF) plasma thrusters have been developed worldwide for future high-power electric propulsion systems [1–7] and low-power small thrusters [8–11]. The main components of the magnetic nozzle RF plasma thruster are an RF antenna, a dielectric tube, and a solenoid. The thruster does not have a cathode or an external neutralizer, i.e., a completely electrodeless configuration. Therefore, electrode wear, which limits the lifetime, does not occur, enabling the long lifetime in space. The magnetic nozzle RF plasma thrusters are expected to be utilized instead of conventional electric thrusters, such as ion and Hall thrusters, as the long-term operational propulsion system.
In the magnetic nozzle RF plasma thrusters, the electric power is delivered to the plasma from the RF antenna wound around the source tube, where the solenoid or the permanent magnets are set to produce the magnetic field in the source and the magnetic nozzle [1, 12–14]. The plasma is accelerated through the magnetic nozzle toward the downstream direction and obtains the axial momentum. In the magnetic nozzle, an azimuthal current is induced by the diamagnetic effect and produces the axial Lorentz force with the radial magnetic field [15–19].
Thruster efficiencies of magnetic nozzle RF plasma thrusters are summarized in Ref. [4], and a recent study reported a thruster efficiency approaching 20% at the maximum for the RF power of 6 kW [20]. However, Hall thrusters show a thruster efficiency of 35%–60% for an input power of 1.5–4.5 kW [21] and have been already utilized successfully on satellites and space probes [22, 23]. The thruster efficiency of magnetic nozzle RF plasma thrusters is still relatively poor compared with that of Hall thrusters, although magnetic nozzle RF plasma thrusters have the advantage of not requiring cathodes and an external neutralizer. Therefore, further improvement of thruster efficiency is an important challenge.
Considering that Hall thrusters achieve a thruster efficiency of 60% at maximum, magnetic nozzle RF plasma thrusters do not utilize the input power efficiently compared with Hall thrusters. In magnetic nozzle RF plasma thrusters, the power is supplied from only the RF antenna because of the completely electrodeless configuration. The RF power is mainly absorbed by electrons in the inductively coupled or helicon modes [1]. Note that the neutral energy is negligibly small because the neutral temperature is roughly 300 K, while the measured ion and electron temperatures are 0.1–1 eV [24] and 1–20 eV [25, 26], respectively. In addition, the magnetostatic field produced by the solenoid supplies no energy to the plasma. Therefore, to impart the axial momentum to ions and obtain the thrust, the electron energy heated by the RF electromagnetic fields should be converted to the axial ion energy in the magnetic nozzle. In the case of a low thruster efficiency, it is expected that the electron energy is not converted to the axial ion energy efficiently and lost in the thruster. Here, possible energy losses are energy fluxes on the dielectric wall, a divergent plasma beam energy that does not contribute to the thrust, a rotation plasma energy, and collisional energy losses. To improve the thruster efficiency of magnetic nozzle RF plasma thrusters, it is necessary to know where and how the energies are lost in the thruster and to identify the major process of the energy loss.
The energy balance in the thruster has been analyzed by a global discharge model, implying significant energy losses to the wall, where the inner diameter of the thruster is 3.2–3.25 cm, the RF power is 300–2,000 W, and the magnetic field strength is 0–269 G [27]. An individual measurement of the axial force imparted to the lateral dielectric wall showed that a non-negligible axial momentum is lost there, where the inner diameter of the thruster is 6.4 cm, the RF power is 1 kW, and the magnetic field strength is 0–750 G [28]. Moreover, the energy lost to the lateral dielectric wall was measured by using a momentum vector measurement instrument and Langmuir probes and accounted for 20%–60% of the input power depending on the magnetic field strength, where the inner diameter of the thruster is 9.5 cm, the RF power is 400 W, and the magnetic field strength is 0–300 G [29]. However, other energy losses besides the energy lost to the dielectric wall have not been fully understood yet.
In this study, fully kinetic simulations of a magnetic nozzle RF plasma thruster are conducted to investigate the energy losses in the thruster. Because the current simulations have the limitation of the thruster size and the input power, this study shows how the energy losses are distributed in the thruster and their ratios to the input power depending on the magnetic field strength. The simulations obtain energy fluxes by ions and electrons with a vector resolution, which are directly calculated from particle motions in the simulations. Collisional energy losses are also calculated in the simulations. First, the calculation model of fully kinetic simulations employed in this paper is briefly described. Then the energy losses in the thruster and their ratios to the input power are reported. The simulation results show that the ion and electron energies lost to the dielectric wall are suppressed by increasing the magnetic field strength and instead the thruster efficiency dramatically increases from 2.1% to 27.4%, which are qualitatively consistent with previous experiments [29].
We have employed two-dimensional (x-y) and bidirectional calculation models to reduce the calculation cost [19, 30]. Although bidirectional thrusters are different from the common thruster, they are proposed for space debris removal [31]. The numerical model has an infinite length in the z-direction, and the simulation results are discussed in the unit length of the z-direction. The plasma kinetics in the thruster is analyzed using particle-in-cell and Monte Carlo collisions (PIC-MCC) techniques. Details of the calculation model and simulation method were given in previous papers [19, 30, 32, 33], and a brief description is written in this paper.
Figure 1A shows a schematic of the calculation area employed in this paper. The calculation area is 2.5 cm × 0.56 cm including the dielectric and divided into 50 μm × 50 µm cells, i.e., a 501 × 113 grid. The solenoid produces the magnetic field lines as shown by the solid black lines in Figure 1A. The solenoid current is set to 0.1, 0.4, and 2.0 kA to investigate the dependence of the magnetic field strength. The magnetic field strength at 2.0 kA is shown as a colormap in Figure 1A, and the magnetic field strengths on the x-axis for the solenoid currents of 0.1, 0.4, and 2.0 kA are shown in Figure 1B. The plasma absorbs the RF power supplied from the RF antenna and maintains the discharge. Simulation results are averaged over 30 µs.
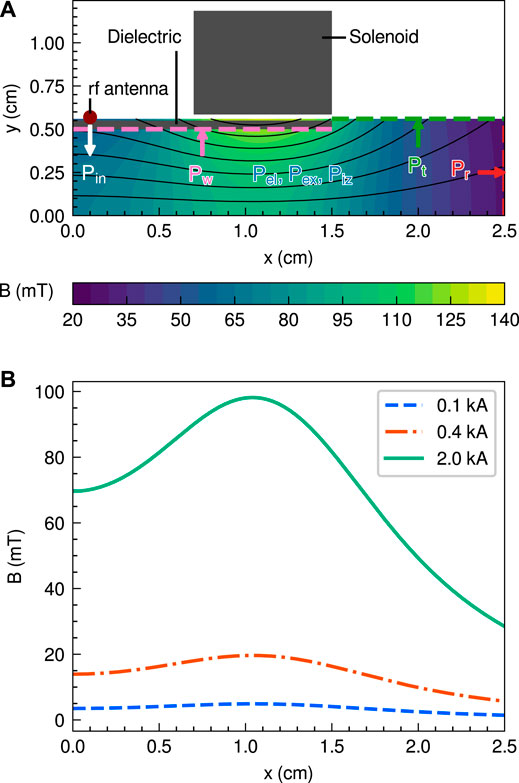
FIGURE 1. (A) A schematic of the calculation area and a magnetic field strength produced by the solenoid current of 2.0 kA. Solid black lines show the magnetic field lines. Energy fluxes and collisional energy losses in the magnetic nozzle radiofrequency (RF) plasma thruster are also plotted. Pin is the input power from the RF antenna (a white arrow). Pw, Pr, and Pt are energy losses per unit time from colliding with the lateral dielectric wall (a pink arrow), from colliding with the right boundary at x = 2.5 cm (a red arrow), and from colliding with the top boundary at y = 0.56 cm (a green arrow), respectively. These energy losses per unit time are calculated independently from particle motions for ions and electrons and the x-, y-, and z-directions. Pel, Pex, and Piz are the elastic, excitation, and ionization energy losses per unit time, respectively (a blue font). Because the left and bottom boundaries are assumed to be symmetrical, particles are reflected at the boundaries, and the particle energies are not lost. (B) Magnetic field strengths on the x-axis for the three solenoid currents of 0.1 (a dashed blue line), 0.4 (a dotted-dashed orange line), and 2.0 kA (a solid green line).
Ions and electrons are lost to the lateral dielectric wall, the right boundary at x = 2.5 cm, or the top boundary at y = 0.56 cm, from colliding with these boundaries. Because the calculation area is symmetric about the x- and y-axes, ions and electrons are reflected at the left boundary at x = 0 cm and the bottom boundary at y = 0 cm. The motions of ions and electrons are solved by using the Boris method [34]. In the simulations, single charged xenon ions, Xe+, and electrons, e−, are treated. Their time steps are set to 0.125 ns and 3.57 ps, respectively. In addition, electron-neutral collisions including elastic, excitation, and ionization collisions are solved by using the null-collision method [35] and cross-sections in [36–38]. The neutral density is a spatiotemporal constant in the simulations and set to 2.0 × 10¹⁹ m−3. The RF frequency is set to 80 MHz, and the power absorption is controlled to be 3.5 W, where the unit length is assumed in the z-direction.
Electric and magnetic fields employed in this paper are the electrostatic field Ees generated by charged particles and the surface charge on the dielectric, the electromagnetic field Eem induced by the RF antenna, and the magnetostatic field B produced by the solenoid. These fields are obtained by solving Maxwell’s equations using fast Fourier transformation.
The boundary conditions of the electrostatic field are Dirichlet boundary conditions at the right and top boundaries (ϕ = 0) and the Neumann boundary conditions at the left and bottom boundaries (∂ϕ/∂n = 0 with ∂/∂n being the normal derivative), where ϕ is the potential. Note that the Dirichlet boundary conditions generate the sheath near the right and top boundaries, as shown in our previous paper [30].
The calculation area for Eem is set to 1.5 × 0.5 cm in the dielectric. The details of the RF field are described in our previous papers [39, 40]. As boundary conditions, Eem is set to zero on the x- and y-axes, and Eem on the outer boundaries at x = 1.5 cm and y = 0.5 cm are calculated using the Biot–Savart law.
The calculation area for B is set to 15 × 5.6 cm, which is 10 times the calculation area for charged particles and the electrostatic field. Here, the magnetic field strengths under the solenoid are 5, 20, and 100 mT for the solenoid currents of 0.1, 0.4, and 2.0 kA, respectively. For the magnetic field strength of 100 mT, the ion Larmor radius rL becomes approximately 1.3 cm, where the ion temperature is assumed to be 0.5 eV. Then, the ratio rL/L is 1.3, where L is a thruster height of 1 cm (diameter in cylindrical coordinates). Therefore, ions are not fully magnetized for all magnetic field strengths.
Figure 1A also shows energy fluxes and collisional energy losses considered in the simulations. In this study, energy losses are evaluated by using those per unit time (i.e., the power). Pin is the input power from the RF antenna, Pw is the energy loss from colliding with the lateral dielectric wall, Pr is the energy loss from colliding with the right boundary at x = 2.5 cm, and Pt is the energy loss from colliding with the top boundary at y = 0.56 cm. These energy losses are calculated independently from particle motions for ions and electrons and the x-, y-, and z-directions. Pel, Pex, and Piz are the elastic, excitation, and ionization energy losses, respectively. Because left and bottom boundaries are assumed to be symmetrical, particles are reflected at the boundaries, and the particle energies are not lost.
The energy losses considered in this study are summarized in Table 1, and the subscripts are described in Table 2. In this paper, it is assumed that the charged particles colliding with the calculation boundaries lose their kinetic energies. Therefore, the energy flux of the particle species α to the boundary β in the γ-direction, pα,β,γ, is calculated by
where j is the particle index, mα is the mass of the particle species α, vα,β,γ,j is the velocity of the particle j in the γ-direction, ΔS is the cell area, and Δta is the averaging time. Here, α is i or e, β is r, t, or w, and γ is x, y, or z, according to Table 2. It should be noted that the sheaths at the boundaries are self-consistently solved in the simulation; hence the energy fluxes calculated in the simulations contain the sheath effect.
Charged particles also lose their kinetic energies by collisions: the excitation and ionization energy losses, and the energy transferred from electrons to neutrals by binary collisions. Here, the collisional energy loss density pc is written as
where ΔE is the energy loss by a collision and ΔV is the cell volume. Here, the subscript c is el, ex, or iz according to Table 2.
The total energy losses per unit time Pα,β,γ and Pc are calculated by integrating pα,β,γ and pc over the area and volume, respectively, i.e., as given by
The sum Pα,β of the energy losses per unit time in all directions is written as
Note that the energy fluxes and collisional energy loss density are dependent on the size of the calculation area, indicating that this paper evaluates the thruster performance in a small vacuum chamber of 2.5 × 0.56 cm.
In this study, it is important that all the calculation conditions except the magnetic field strengths are fixed: e.g., the size of the calculation area, the power absorption, and the potential on the boundary. The energy losses to the boundaries can be compared by fixing the calculation conditions, and the effect of the magnetic field strength is discussed.
The plasma power contributing to the thrust Pth is defined by
Then, the thruster efficiency η in the simulations is calculated as
Here, η is the electrical efficiency in the thruster, which is defined as the beam power out of the thruster divided by the total input power [21].
Figure 2 shows the x-y profiles of the electron number density ne for the three magnetic field strengths of 5, 20, and 100 mT. The electron number density ne is large near the axial location of the RF antenna (x = 0.1 cm) and decreases in the downstream direction due to the magnetic expansion, the plasma diffusion, the ion acceleration, and the electron reflection by the electric field. The plasma distribution is confined to the center of the magnetic nozzle for the 20 mT case in Figure 2B, and the off-axis density peak can be seen for the 100 mT case as in Figure 2C. These density–profile transitions from increasing the magnetic field strength were measured in previous experiments [41–45] and numerical results [46], indicating that the simulation results reproduce the experimental ones qualitatively.
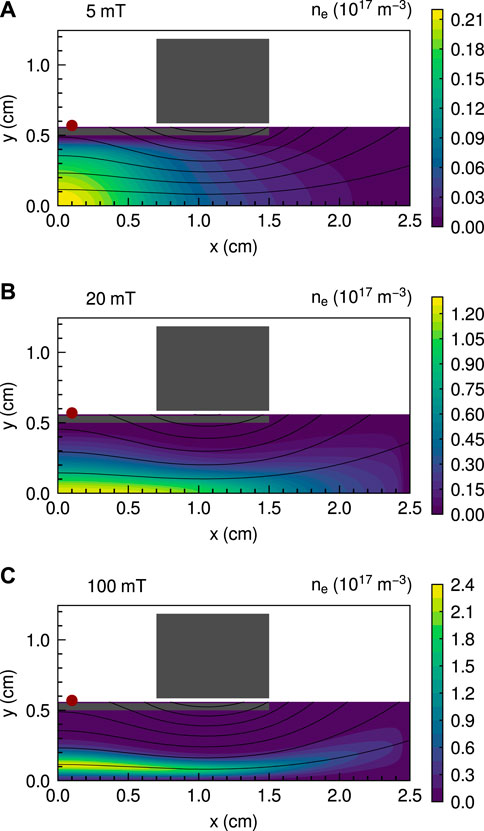
FIGURE 2. x-y profiles of the electron number density ne for the three magnetic field strengths of (A) 5, (B) 20, and (C) 100 mT. Solid black lines show magnetic field lines.
Figure 3 shows the x-y profiles of the electron temperature Te for the three magnetic field strengths of 5, 20, and 100 mT. The electron temperature for the 5 mT case is relatively high at approximately 10 eV on the magnetic field line in contact with the dielectric surface and under the RF antenna. For the 20 and 100 mT cases, the high-temperature regions are approximately 5 eV and move inward, a little away from the dielectric surface.
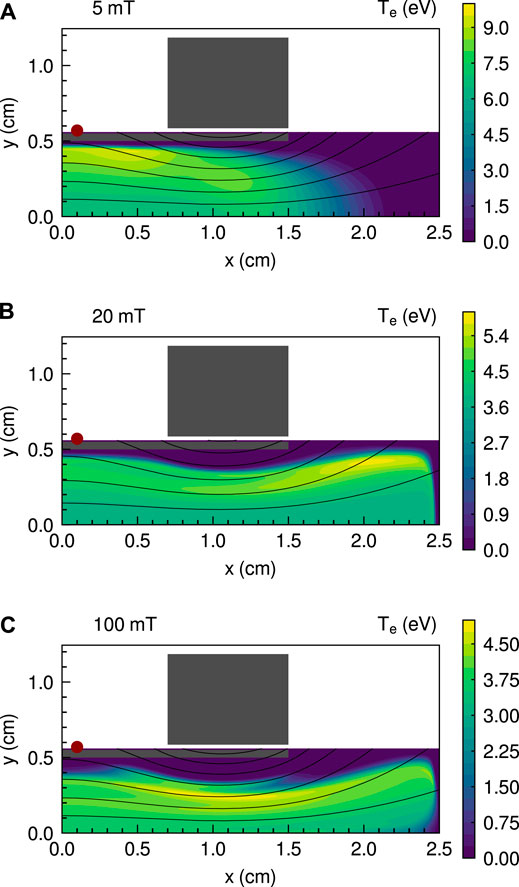
FIGURE 3. x-y profiles of the electron temperature Te for the three magnetic field strengths of (A) 5, (B) 20, and (C) 100 mT. Solid black lines show magnetic field lines.
For the 5 mT case, the electron temperature decreases in the downstream region within 1.5 cm < x < 2.5 cm. Note that the electrons for the 5 mT case are less magnetized because the Larmor radius at the center of the solenoid is approximately 0.17 cm using a magnetic field strength of 5 mT and an electron temperature of 5 eV and are less transported along the magnetic field lines. For the 20 and 100 mT cases, however, the electron temperature is relatively high in the downstream region within 1.5 cm < x < 2.5 cm. The high-temperature electrons are expected to be transported to the downstream region through the magnetic nozzle and lost to the downstream boundaries; these results are consistent with previous experimental ones [47].
Figure 4 shows the x profiles of the ion and electron energy fluxes on the lateral dielectric wall pi,w and pe,w, respectively, for the three magnetic field strengths of 5, 20, and 100 mT. Both the ion and electron energy fluxes on the lateral dielectric wall decrease with increasing the magnetic field strength, especially under the solenoid within x = 0.7–1.5 cm. Although the electron losses are expected to be prevented by the magnetic field, the ions are not fully magnetized in this simulation and do not move only along the magnetic field lines. The ion motions are expected to be affected by the potential distribution as previously observed in experiments [48, 49].
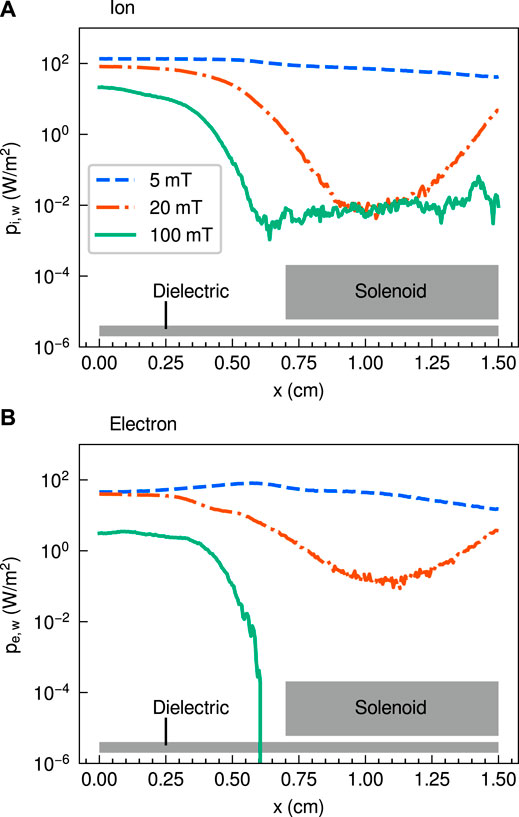
FIGURE 4. x profiles of the (A) ion and (B) electron energy fluxes on the lateral dielectric wall pi,w and pe,w, respectively, for the three magnetic field strengths of 5 (a dashed blue line), 20 (a dotted-dashed orange line), and 100 mT (a solid green line). Gray boxes show locations of the solenoid and the lateral dielectric wall.
Figure 5 shows the y profiles of the potential ϕ at x = 1.1 cm for the three magnetic field strengths of 5, 20, and 100 mT. The radial potential drop is clearly formed around y = 0.2–0.5 cm for 5 mT; the ions are accelerated in the radial direction there and would take significant energy from the system to the wall. For the 20 and 100 mT cases, slight increases in the potential along the y axis can be seen, and the wall potentials are higher than that in the plasma core, suppressing ion loss to the dielectric. These structures can be interpreted as a result of the inhibition of the electron transport to the wall by the magnetic field, resulting in a positive charge-up of the wall by the ions. To have confidence of a positive charge-up, the x profile of the surface charge σ on the wall is analyzed and shown in Figure 6; this result demonstrates the positively charged-up wall at the solenoid location, where the magnetic field lines are almost parallel to the wall.
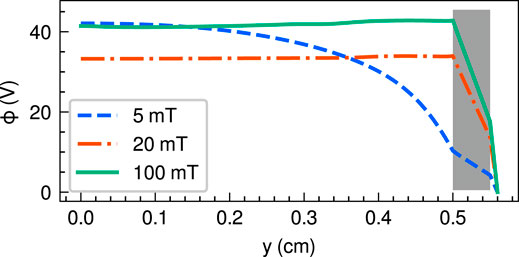
FIGURE 5. y profiles of the potential ϕ at x = 1.1 cm for the three magnetic field strengths of 5 (a dashed blue line), 20 (a dotted-dashed orange line), and 100 mT (a solid green line). A gray box shows the location of the dielectric wall.
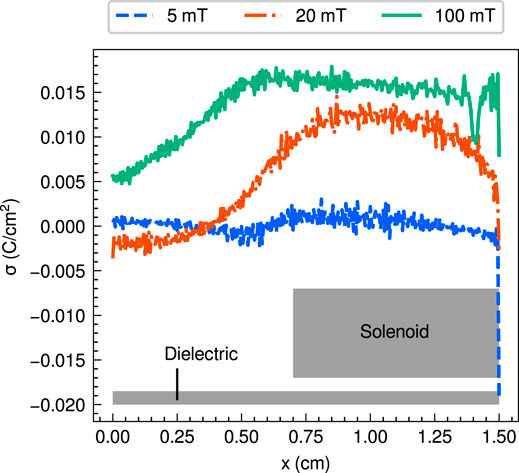
FIGURE 6. x profiles of the surface charge density on the lateral dielectric wall σ for the three magnetic field strengths of 5 (a dashed blue line), 20 (a dotted-dashed orange line), and 100 mT (a solid green line). Gray boxes show locations of the solenoid and the lateral dielectric wall.
Figure 7 shows the x-y profiles of the power absorption Pabs for the three magnetic field strengths of 5, 20, and 100 mT, where Pabs is calculated from the change of the particle velocities. For the 5 mT case, the power absorption is high under the RF antenna and approximately 1 W/cm3 as shown in Figure 7A. It is expected that the plasma absorbs the energy by the RF field induced by the RF antenna. For the 20 and 100 mT cases shown in Figures 7B, C, the power absorption is relatively high downstream, while the plasma also absorbs a little energy under the RF antenna. From Figure 7, the location where the plasma often absorbs the energy shifts to the radially inner region in the thruster, although its physics is still unclear. However, the shift in the plasma energy is consistent with the profiles of ne and Te shown in Figures 2 and 3, respectively. The decrease in the energy fluxes to the dielectric is also consistent with the shift in the power absorption.
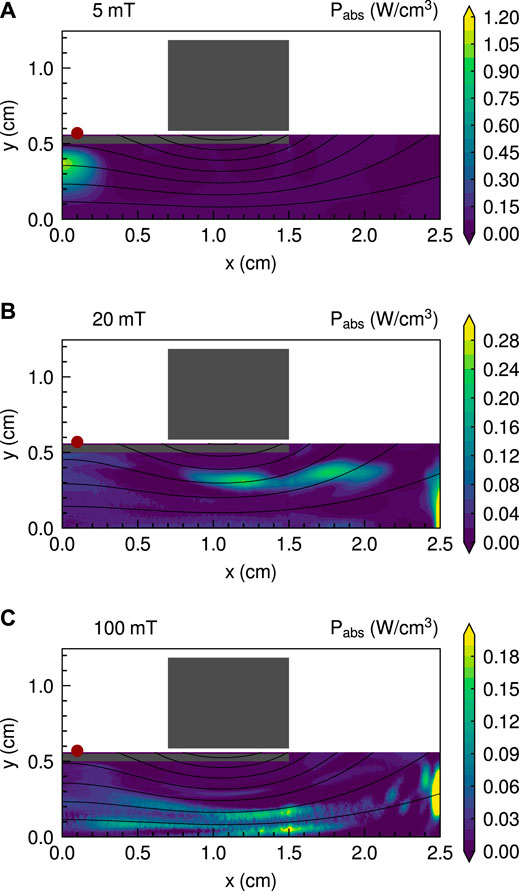
FIGURE 7. x-y profiles of the power absorption Pabs for the three magnetic field strengths of (A) 5, (B) 20, and (C) 100 mT. Solid black lines show magnetic field lines.
Figure 8 shows the x and y profiles of the ion energy fluxes in the x-direction on the top boundary pi,t,x and the right boundary pi,r,x, respectively, for the three magnetic field strengths of 5, 20, and 100 mT. Note that the ion energy fluxes pi,t,x and pi,r,x contribute to the increase in the thrust. As shown in Figure 8A, pi,t,x is negligibly small. However, pi,r,x significantly increases with increasing magnetic field strength and achieves 464 W/m2 at maximum as shown in Figure 8B, while it decreases at y = 0–0.1 cm when increasing the magnetic field strength from 20 to 100 mT. The change in the position of the maximum ion energy flux and the low energy flux around y = 0 cm in Figure 8B are consistent with the distributions of the electron number density ne in Figure 2.

FIGURE 8. (A) x and (B) y profiles of the ion energy fluxes in the x-direction on the top boundary (y = 0.56 cm) pi,t,x and the right boundary (x = 2.5 cm) pi,r,x, respectively, for the three magnetic field strengths of 5 (a dashed blue line), 20 (a dotted-dashed orange line), and 100 mT (a solid green line). Note that x = 2.5 cm in (A) corresponds to y = 0.56 cm in (B).
Figure 9 shows the x and y profiles of the ion energy fluxes in the y-direction on the top boundary pi,t,y and the right boundary pi,r,y, respectively, for the three magnetic field strengths of 5, 20, and 100 mT. The ion energy fluxes in the y-direction pi,t,y and pi,r,y are 0–69 W/m2. By changing the magnetic field strength from 5 to 20 mT, the position of the maximum ion energy flux in the y-direction shifts in the positive x-direction in Figure 9A, and the maximum energy loss increases. The shift and increase in the maximum energy losses are expected because the plasma is localized near the central region around the x-axis for the larger magnetic field strength as shown in Figure 2 and is transported along the magnetic field lines.

FIGURE 9. (A) x and (B) y profiles of the ion energy fluxes in the y-direction on the top boundary (y = 0.56 cm) pi,t,y and the right boundary (x = 2.5 cm) pi,r,y, respectively, for the three magnetic field strengths of 5 (a dashed blue line), 20 (a dotted-dashed orange line), and 100 mT (a solid green line). Note that x = 2.5 cm in (A) corresponds to y = 0.56 cm in (B).
Figure 10 shows the x profiles of the electron energy fluxes on the top boundary (pe,t,x, pe,t,y, and pe,t,z) and y profile of the electron energy fluxes on the right boundary (pe,r,x, pe,r,y, and pe,r,z) for the three magnetic field strengths of 5, 20, and 100 mT. Note that the electron energy fluxes pe,t,x and pe,r,x contribute to the increase in the thrust. Whereas the electron energy fluxes for the 5 mT case are sufficiently small in Figures 10A, B, the electron energy fluxes for the 20 and 100 mT cases are mainly lost to the top and right boundaries, respectively. These energy fluxes are expected because the magnetic nozzle enhances the electron transport to the downstream region and suppresses the energy losses to the dielectric as shown in Figure 4.
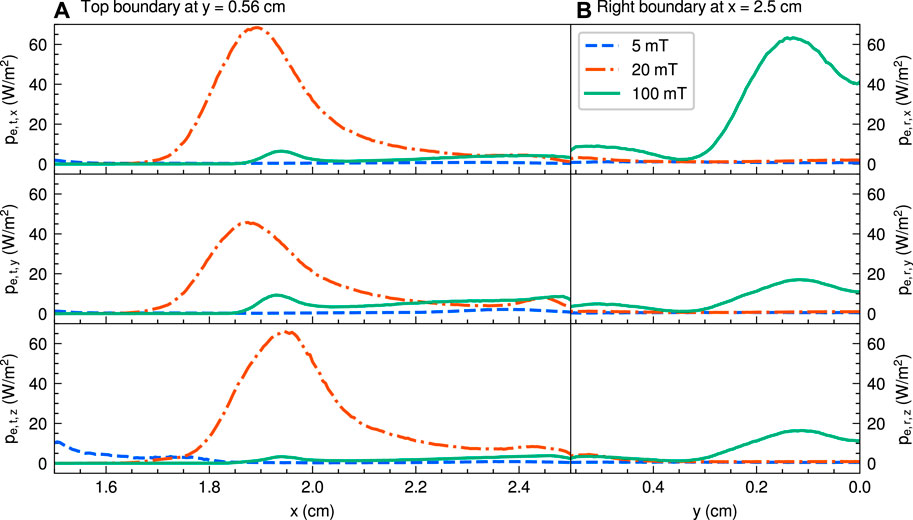
FIGURE 10. (A) x profiles of the electron energy fluxes on the top boundary (y = 0.56 cm) pe,t,x, pe,t,y, and pe,t,z and (B) y profiles of the electron energy fluxes on the right boundary (x = 2.5 cm) pe,r,x, pe,r,y, and pe,r,z, for the three magnetic field strengths of 5 (a dashed blue line), 20 (a dotted-dashed orange line), and 100 mT (a solid green line). Note that x = 2.5 cm in (A) corresponds to y = 0.56 cm in (B).
For the 20 mT case, the location of the maximum electron energy flux is x = 1.9 cm in Figure 10A because the energetic electrons are magnetized and transported along the magnetic field lines passing through the location under the RF antenna, as reported in Refs. [41], [45], [50], and [51], where the electrons are considerably heated by the RF field. As shown in Figure 3B, the high-temperature electrons for the 20 mT case pass through the top boundary at y = 0.56 cm along the magnetic field lines, corresponding to the electron energy flux shown in Figure 10A.
The electron energy fluxes to the right boundary for the 100 mT case are much larger than those for the 5 and 20 mT cases as seen in Figure 10B, whereas the significant energy fluxes to the top boundary appear for the 20 mT case as seen in Figure 10A. These energy fluxes would be dominated by the density and temperature profiles in Figures 2 and 3, respectively. The simulation results in Figure 10 show that the electron energy for the strong magnetic field case of 100 mT is well transported to the right boundary in the inner region along the magnetic nozzle. For the 20 mT case, however, the significant electron energy is transported to the top boundary along the divergent magnetic field lines. The energy loss to the top boundary for the 20 mT case is consistent with the higher electron temperature in Figure 3B and the higher power absorption in Figure 7B near the top boundary. The detailed particle and energy transport processes have not been fully understood yet and remain to be further investigated.
In the simulations, the ion and electron energy fluxes in the x-direction are considered to be the plasma beam extracted from the plasma source and contribute to an increase in the thrust; these are pi,t,x and pi,r,x in Figure 8, and pe,t,x and pe,r,x in Figure 10. As shown in Figure 8B, the ion energy flux in the x-direction pi,r,x becomes greater with increasing the magnetic field, which is expected to enhance the thrust. The electron energy fluxes in the x-direction. Pe,t,x and pe,r,x are 0–65 W/m2 for the 20 and 100 mT cases as shown in Figure 10, indicating that the electron energy fluxes are an order of magnitude smaller than the ion energy flux. However, the electron energy flux is not negligible in the thrust generation and also increases the thruster efficiency. The non-negligible electron energy flux was implied in previous papers [52, 53], in which the plasma expansion in a convergent-divergent magnetic nozzle is analyzed computing self-consistently the velocity distribution function. While fully magnetized plasma is treated in [52, 53], the presence of the electron energy flux at the end of the magnetic nozzle is well consistent with the results in our study.
Figure 11 shows the x-y profiles of the excitation energy loss density pex and the ionization energy loss density piz for the three magnetic field strengths of 5, 20, and 100 mT. pex and piz have similar distributions for each magnetic field strength and are large at the upstream region of the magnetic nozzle, where the electron number density ne is also large as shown in Figure 2.
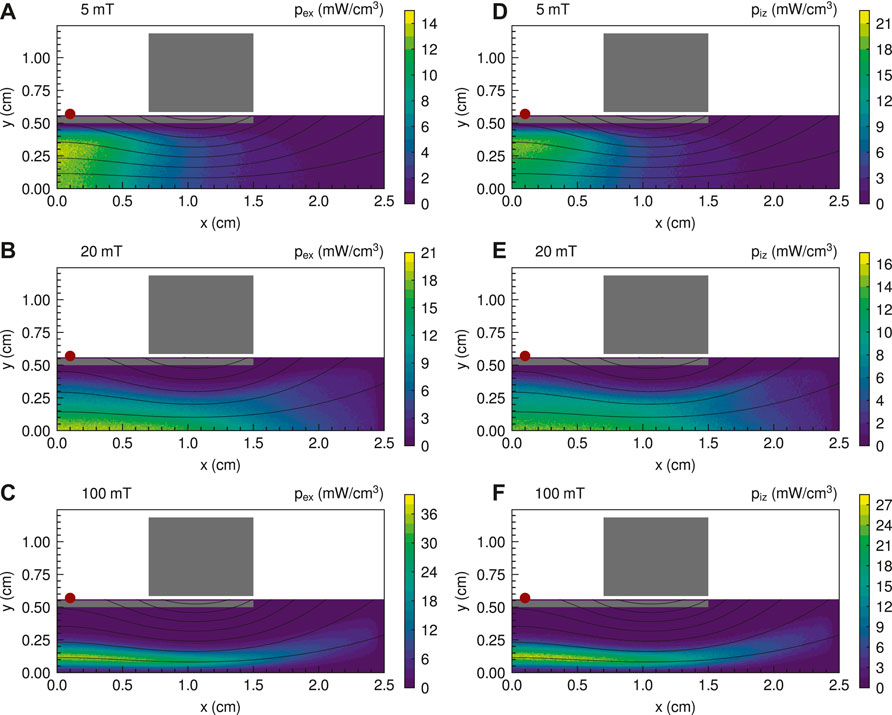
FIGURE 11. x-y profiles of the excitation energy loss density pex for the three magnetic field strengths of (A) 5, (B) 20, and (C) 100 mT and the ionization energy loss density piz for the three magnetic field strengths of (D) 5, (E) 20, and (F) 100 mT. Solid black lines show magnetic field lines.
Figure 12 shows the energy losses in the magnetic nozzle RF plasma thruster for the three magnetic field strengths of 5, 20, and 100 mT. The definitions of energy losses are described in Table 1. Po contains other energy losses and is defined by Po = Pi,r,z + Pi,t,z + Pel. Its magnitude is less than 1 × 10⁻³ W, indicating that the elastic energy loss density and the ion rotation energy fluxes are negligibly small. Energy losses are calculated using Eqs. 3 and 4. Note that the input power from the RF antenna Pin is set to 3.5 W for all magnetic field strengths, and the total energy losses are also almost equal to 3.5 W, shown as a dashed black line in Figure 12.
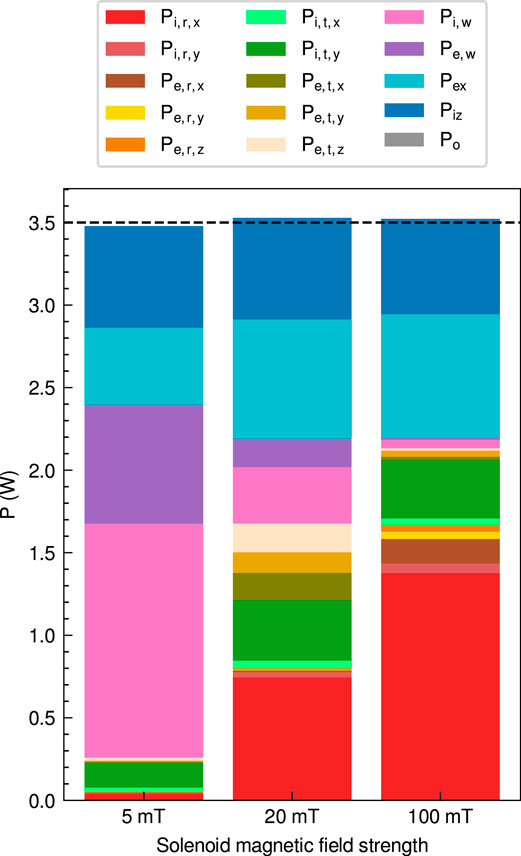
FIGURE 12. Energy losses in the magnetic nozzle RF plasma thruster for the three magnetic field strengths of 5 (a left bar), 20 (a center bar), and 100 mT (a right bar). The definitions of energy losses are described in Table 1. Po contains other energy losses and is defined by Po = Pi,r,z + Pi,t,z + Pel. The input power Pin is set to 3.5 W for all magnetic field strengths; therefore, the total energy losses are also approximately 3.5 W, shown as a dashed black line.
Pex and Piz are the excitation and ionization energy losses, respectively. The sums of Pex and Piz account for 31.1%, 37.9%, and 36.6% for the magnetic field strengths of 5, 20, and 100 mT, respectively. Therefore, Pex and Piz account for 30%–40% regardless of the magnetic field strength. Here, Pex and Piz are considered as the minimum loss power to maintain the plasma discharge. Thus, 30%–40% of the energy absorbed by the plasma is not utilized as the plasma beam with or without the magnetic nozzle. The remaining 60%–70% of the energy can be utilized as the energy of the plasma beam. Although Pex and Piz are considered unavoidable energy losses in plasma propulsion, the thruster efficiency of the magnetic nozzle RF plasma thruster can be increased to 60%–70% if the remaining energy is utilized efficiently.
Pi,w and Pe,w are the ion and electron energy losses from colliding with the lateral dielectric wall, respectively. The sums of Pi,w and Pe,w account for 61.5%, 14.6%, and 1.78% for the magnetic field strengths of 5, 20, and 100 mT, respectively. Therefore, Pi,w and Pe,w are extremely reduced by increasing the magnetic field strength. This significant decrease is due to preventing the electron loss to the dielectric by the magnetic field. The sheath near the dielectric wall is also suppressed, and the ion energy loss is prevented. These results are qualitatively consistent with previous experimental results reported in Ref. [29], which shows that the energy loss to the dielectric wall changes from 55%–60% to 20%–30% with increasing the magnetic field strength from 0 to 300 G.
Pi,t,x and Pi,t,y are the ion energies in the x- and y-directions from colliding with the top boundary, respectively, which are extracted from the plasma source but diverged by the magnetic nozzle. Pi,t,x accounts for 0.6%, 1.3%, and 1.1% for the magnetic field strengths of 5, 20, and 100 mT, respectively. Therefore, Pi,t,x is negligibly small and contributes less to the increase in the thrust regardless of the magnetic field strength. Pi,t,y accounts for 4.31%, 10.3%, and 10.0% for the magnetic field strengths of 5, 20, and 100 mT, respectively. Pi,t,y is the lowest at 0.1 kA, and it doubles at 20 and 100 mT by the magnetic nozzle. Pe,t,x, Pe,t,y, and Pe,t,z are electron energy losses in the x-, y-, and z-directions from colliding with the top boundary, respectively. The sum of Pe,t,x, Pe,t,y, and Pe,t,z is 0.13 W and relatively large for the magnetic field strength of 20 mT, while it is mostly vanished for the magnetic field strength of 100 mT.
Pi,r,x and Pi,r,y are the ion energy losses in the x- and y-directions from colliding with the right boundary, respectively. Pi,r,x accounts for 1.2%, 21.1%, and 39.1% for the magnetic field strengths of 5, 20, and 100 mT, respectively. Therefore, Pi,r,x is dramatically increased by increasing the magnetic field strength, contributing to an increase in the thrust. Pi,r,y accounts for 0.1%, 1.0%, and 1.7% for the magnetic field strengths of 5, 20, and 100 mT, respectively. Although Pi,r,y slightly increases with increasing magnetic field strength, its effect is relatively small in the energy losses. Pe,r,x, Pe,r,y, and Pe,r,z are electron energy losses in the x-, y-, and z-directions from colliding with the right boundary, respectively. While these electron energy losses are relatively small, Pe,r,x is also included in Eq. 6, somewhat contributing to the thrust generation.
The plasma powers contributing to the thrust Pth are 0.07, 0.97, and 1.59 W for the magnetic field strengths of 5, 20, and 100 mT, respectively, which are calculated from Eq. 6. Then, power ratios to the plasma power contributing to the thrust Pth are calculated and shown in Figure 13. The largest component of Pth is Pi,r,x, and the power ratios Pi,r,x/Pth are 54.3%, 77.0%, and 86.9% for the magnetic field strengths of 5, 20, and 100 mT, respectively. The power ratios Pi,t,x/Pth are 30.3%, 4.8%, and 2.4% for the magnetic field strengths of 5, 20, and 100 mT, respectively. The power ratios of the electron energies (Pe,r,x + Pe,t,x)/Pth are 15.5%, 18.2%, and 10.7% for the magnetic field strengths of 5, 20, and 100 mT, respectively. The electron energy somewhat contributes to the thrust, while it is converted to the ion energy in the sheath.
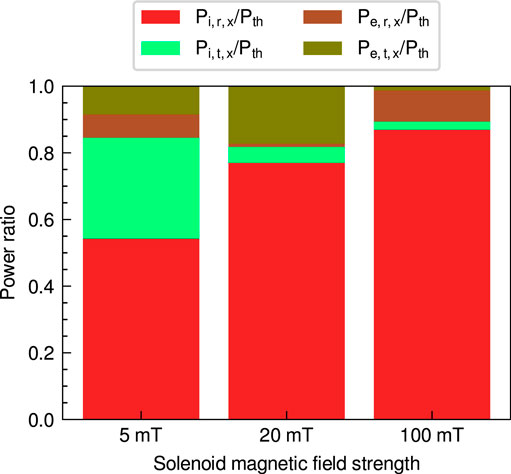
FIGURE 13. Power ratios to the plasma power contributing to the thrust Pth in the magnetic nozzle RF plasma thruster for the three magnetic field strengths of 5 (a left bar), 20 (a center bar), and 100 mT (a right bar). The definitions of energy losses are described in Table 1.
The thruster efficiencies η for the three magnetic field strengths are calculated from the energy losses in the magnetic nozzle RF plasma thruster using Eq. 7. It should be noted that normal unidirectional thrusters have a back plate, which is not considered in this study. The energy losses to the back plate are not included in Figure 12, indicating the thruster efficiencies of the bidirectional model. The thruster efficiencies are 2.1%, 27.4%, and 45.0% for the magnetic field strengths of 5, 20, and 100 mT, respectively. Therefore, the thruster efficiency in the magnetic nozzle is increased dramatically by increasing the magnetic field strength. The thruster efficiency of 2.1% for the magnetic field strength of 5 mT is consistent with experiments with a weak magnetic field as reported in Refs. [25] and [54 –58]. Then, the thruster efficiency of 27.4% for the magnetic field strength of 20 mT is roughly consistent with the recent experiment in Ref. [20], which is the maximum thruster efficiency measured to date. Although the thruster efficiency of 45.0% for the magnetic field strength of 100 mT is not realized in experiments, the fully kinetic simulation in this paper implies that the thruster efficiency of magnetic nozzle RF plasma thrusters could be made to achieve a thruster efficiency of 40%–50% by increasing the magnetic field strength. Continuous increases in the thrust have actually been observed when increasing the magnetic field up to a few kG [59], which is much higher than that used in the thrust assessment experiment. The assessment of the thruster efficiency remains a further experimental issue.
Here, the increase in the thruster efficiency with increasing the magnetic field strength is mainly due to the dramatic decrease of the ion and electron energy losses from colliding with the lateral dielectric wall, because the collisional energy losses and the divergent ion energy remain almost unchanged regardless of the magnetic field strength. The results are consistent with the previous assessment of the energy loss to the wall [29]. It is also expected that increasing the magnetic field strength and preventing energy loss from colliding with the dielectric wall improve the thruster efficiency in experiments. When energy loss from colliding with the lateral dielectric wall is completely prevented, suppressing divergent ions would further improve the thruster efficiency of the magnetic nozzle RF plasma thrusters.
Fully kinetic simulations are conducted to investigate the energy losses in the magnetic nozzle RF plasma thruster for further improvement of the thruster efficiency. It is shown that the main energy loss for a weak magnetic field strength is the ion and electron energies lost to the lateral dielectric wall, which account for 61.5% for the 5 mT case. However, they are dramatically reduced to 1.78% for the 100 mT case by increasing the magnetic field strength. The ion beam energy increases from 1.2% to 39.1% instead of the decrease of the energy loss on the wall, improving the thruster efficiency from 2.1% to 45.0%. The divergent ion energy and collisional energy losses are identified as approximately 4%–12% and 30%–40%, respectively, which are not utilized as the plasma beam. Suppressing the energy loss on the lateral dielectric wall is the key to the improvement of the thruster efficiency, and the performance of the magnetic nozzle RF plasma thrusters is expected to be further improved.
The raw data supporting the conclusions of this article will be made available by the authors, without undue reservation.
KE, KT, and YT performed the conceptual design of the study. KE and YT designed the calculation model and wrote the simulation codes. KE performed the simulations. The data were analyzed by KE and discussed by KE, KT, and YT. The first draft of the manuscript was written by KE and revised by KT and YT.
This work was partly supported by the JSPS KAKENHI grant numbers JP21J15345 and JP19H00663. The computer simulation was performed on the A-KDK computer system at the Research Institute for Sustainable Humanosphere, Kyoto University.
The authors declare that the research was conducted in the absence of any commercial or financial relationships that could be construed as a potential conflict of interest.
All claims expressed in this article are solely those of the authors and do not necessarily represent those of their affiliated organizations, or those of the publisher, the editors, and the reviewers. Any product that may be evaluated in this article, or claim that may be made by its manufacturer, is not guaranteed or endorsed by the publisher.
1. Charles C. Plasmas for Spacecraft Propulsion. J Phys D: Appl Phys (2009) 42:163001. doi:10.1088/0022-3727/42/16/163001
2. Merino M, Ahedo E. Effect of the Plasma-Induced Magnetic Field on a Magnetic Nozzle. Plasma Sourc Sci. Technol. (2016) 25:045012. doi:10.1088/0963-0252/25/4/045012
3. Little JM, Choueiri EY. Electron Demagnetization in a Magnetically Expanding Plasma. Phys Rev Lett (2019) 123:145001. doi:10.1103/PhysRevLett.123.145001
4. Takahashi K. Helicon-Type Radiofrequency Plasma Thrusters and Magnetic Plasma Nozzles. Rev Mod Plasma Phys (2019) 3:3. doi:10.1007/S41614-019-0024-2
5. Chen Z, Wang Y, Tang H, Ren J, Li M, Zhang Z, et al. Electric Potential Barriers in the Magnetic Nozzle. Phys Rev E (2020) 101:053208. doi:10.1103/PhysRevE.101.053208
6. Doyle SJ, Bennet A, Tsifakis D, Dedrick JP, Boswell RW, Charles C. Characterization and Control of an Ion-Acoustic Plasma Instability Downstream of a Diverging Magnetic Nozzle. Front Phys (2020) 8:24. doi:10.3389/fphy.2020.00024
7. Wachs B, Jorns B. Background Pressure Effects on Ion Dynamics in a Low-Power Magnetic Nozzle Thruster. Plasma Sourc Sci. Technol. (2020) 29:045002. doi:10.1088/1361-6595/ab74b6
8. Batishchev OV. Minihelicon Plasma Thruster. IEEE Trans Plasma Sci (2009) 37:1563–71. doi:10.1109/tps.2009.2023990
9. Sheehan J, Collard TA, Ebersohn FH, Longmier BW. Initial Operation of the Cubesat Ambipolar Thruster. In: The 34th International Electric Propulsion Conference (Kobe) (2015). IEPC–2015–243. doi:10.1109/plasma.2015.7179981
10. Manente M, Trezzolani F, Magarotto M, Fantino E, Selmo A, Bellomo N, et al. Regulus: A Propulsion Platform to Boost Small Satellite Missions. Acta Astronautica (2019) 157:241–9. doi:10.1016/j.actaastro.2018.12.022
11. Bellomo N, Magarotto M, Manente M, Trezzolani F, Mantellato R, Cappellini L, et al. Design and In-Orbit Demonstration of Regulus, an Iodine Electric Propulsion System. CEAS Space J (2021) 1–12. doi:10.1007/s12567-021-00374-4
12. Chen FF, Torreblanca H. Large-Area Helicon Plasma Source With Permanent Magnets. Plasma Phys Control Fusion (2007) 49:A81–A93. doi:10.1088/0741-3335/49/5A/S07
13. Takahashi K, Oguni K, Yamada H, Fujiwara T. Ion Acceleration in a Solenoid-Free Plasma Expanded by Permanent Magnets. Phys Plasmas (2008) 15:084501. doi:10.1063/1.2965497
14. Virko VF, Virko YV, Slobodyan VM, Shamrai KP. The Effect of Magnetic Configuration on Ion Acceleration From a Compact Helicon Source With Permanent Magnets. Plasma Sourc Sci. Technol. (2010) 19:015004. doi:10.1088/0963-0252/19/1/015004
15. Ahedo E, Merino M. Two-dimensional Supersonic Plasma Acceleration in a Magnetic Nozzle. Phys Plasmas (2010) 17:073501. doi:10.1063/1.3442736
16. Fruchtman A, Takahashi K, Charles C, Boswell RW. A Magnetic Nozzle Calculation of the Force on a Plasma. Phys Plasmas (2012) 19:033507. doi:10.1063/1.3691650
17. Takahashi K, Charles C, Boswell RW. Approaching the Theoretical Limit of Diamagnetic-Induced Momentum in a Rapidly Diverging Magnetic Nozzle. Phys Rev Lett (2013) 110:195003. doi:10.1103/PhysRevLett.110.195003
18. Takahashi K, Chiba A, Komuro A, Ando A. Experimental Identification of an Azimuthal Current in a Magnetic Nozzle of a Radiofrequency Plasma Thruster. Plasma Sourc Sci. Technol. (2016) 25:055011. doi:10.1088/0963-0252/25/5/055011
19. Emoto K, Takahashi K, Takao Y. Numerical Investigation of Internal Plasma Currents in a Magnetic Nozzle. Phys Plasmas (2021) 28:093506. doi:10.1063/5.0053336
20. Takahashi K. Magnetic Nozzle Radiofrequency Plasma Thruster Approaching Twenty Percent Thruster Efficiency. Sci Rep (2021) 11:2768. doi:10.1038/s41598-021-82471-2
21. Goebel DM, Katz I. Fundamentals of Electric Propulsion: Ion and Hall Thrusters. Hoboken: John Wiley & Sons (2008).
22. Di Cara DM, Estublier D. Smart-1: An Analysis of Flight Data. Acta Astronautica (2005) 57:250–6. doi:10.1016/J.ACTAASTRO.2005.03.036
23. Pidgeon D, Corey R, Sauer B, Day M. Two Years of On-Orbit Performance of Spt-100 Electric Propulsion. In: 24th AIAA International Communications Satellite Systems Conference (2006). p. 5353. doi:10.2514/6.2006-5353
24. Scime EE, Keiter PA, Balkey MM, Boivin RF, Kline JL, Blackburn M, et al. Ion Temperature Anisotropy Limitation in High Beta Plasmas. Phys Plasmas (2000) 7:2157–65. doi:10.1063/1.874036
25. Takahashi K, Lafleur T, Charles C, Alexander P, Boswell RW. Electron Diamagnetic Effect on Axial Force in an Expanding Plasma: Experiments and Theory. Phys Rev Lett (2011) 107:235001. doi:10.1103/PhysRevLett.107.235001
26. Aguirre EM, Bodin R, Yin N, Good TN, Scime EE. Evidence for Electron Energization Accompanying Spontaneous Formation of Ion Acceleration Regions in Expanding Plasmas. Phys Plasmas (2020) 27:123501. doi:10.1063/5.0025523
27. Lafleur T. Helicon Plasma Thruster Discharge Model. Phys Plasmas (2014) 21:043507. doi:10.1063/1.4871727
28. Takahashi K, Chiba A, Komuro A, Ando A. Axial Momentum Lost to a Lateral Wall of a Helicon Plasma Source. Phys Rev Lett (2015) 114:195001. doi:10.1103/PhysRevLett.114.195001
29. Takahashi K, Sugawara T, Ando A. Spatially- and Vector-Resolved Momentum Flux Lost to a Wall in a Magnetic Nozzle Rf Plasma Thruster. Sci Rep (2020) 10:1061. doi:10.1038/s41598-020-58022-6
30. Emoto K, Takahashi K, Takao Y. Axial Momentum Gains of Ions and Electrons in Magnetic Nozzle Acceleration. Plasma Sources Sci. Technol. (2021) 30:115016. doi:10.1088/1361-6595/ac33ee
31. Takahashi K, Charles C, Boswell RW, Ando A. Demonstrating a New Technology for Space Debris Removal Using a Bi-directional Plasma Thruster. Sci Rep (2018) 8:14417. doi:10.1038/s41598-018-32697-4
32. Takao Y, Takahashi K. Numerical Validation of Axial Plasma Momentum Lost to a Lateral Wall Induced by Neutral Depletion. Phys Plasmas (2015) 22:113509. doi:10.1063/1.4935903
33. Takase K, Takahashi K, Takao Y. Effects of Neutral Distribution and External Magnetic Field on Plasma Momentum in Electrodeless Plasma Thrusters. Phys Plasmas (2018) 25:023507. doi:10.1063/1.5015937
35. Vahedi V, Surendra M. A Monte Carlo Collision Model for the Particle-In-Cell Method: Applications to Argon and Oxygen Discharges. Computer Phys Commun (1995) 87:179–98. doi:10.1016/0010-4655(94)00171-W
36. Rapp D, Englander‐Golden P. Total Cross Sections for Ionization and Attachment in Gases by Electron Impact. I. Positive Ionization. J Chem Phys (1965) 43:1464–79. doi:10.1063/1.1696957
37. Heer FJd., Jansen RHJ, Kaay Wv. d.. Total Cross Sections for Electron Scattering by Ne, Ar, Kr and Xe. J Phys B: Mol Phys (1979) 12:979–1002. doi:10.1088/0022-3700/12/6/016
38. Hayashi M. Determination of Electron-Xenon Total Excitation Cross-Sections, from Threshold to 100 eV, from Experimental Values of Townsend's α. J Phys D: Appl Phys (1983) 16:581–9. doi:10.1088/0022-3727/16/4/018
39. Takao Y, Kusaba N, Eriguchi K, Ono K. Two-dimensional Particle-In-Cell Monte Carlo Simulation of a Miniature Inductively Coupled Plasma Source. J Appl Phys (2010) 108:093309. doi:10.1063/1.3506536
40. Takao Y, Eriguchi K, Ono K. Effect of Capacitive Coupling in a Miniature Inductively Coupled Plasma Source. J Appl Phys (2012) 112:093306. doi:10.1063/1.4764333
41. Takahashi K, Charles C, Boswell R, Cox W, Hatakeyama R. Transport of Energetic Electrons in a Magnetically Expanding Helicon Double Layer Plasma. Appl Phys Lett (2009) 94:191503. doi:10.1063/1.3136721
42. Charles C. High Density Conics in a Magnetically Expanding Helicon Plasma. Appl Phys Lett (2010) 96:051502. doi:10.1063/1.3309668
43. Ghosh S, Yadav S, Barada KK, Chattopadhyay PK, Ghosh J, Pal R, et al. .Formation of Annular Plasma Downstream by Magnetic Aperture in the Helicon Experimental Device. Phys Plasmas (2017) 24:020703. doi:10.1063/1.4975665
44. Gulbrandsen N, Fredriksen Å. Rfea Measurements of High-Energy Electrons in a Helicon Plasma Device With Expanding Magnetic Field. Front Phys (2017) 5:2. doi:10.3389/fphy.2017.00002
45. Takahashi K, Akahoshi H, Charles C, Boswell RW, Ando A. High Temperature Electrons Exhausted From Rf Plasma Sources along a Magnetic Nozzle. Phys Plasmas (2017) 24:084503. doi:10.1063/1.4990110
46. Magarotto M, Pavarin D. Parametric Study of a Cathode-Less Radio Frequency Thruster. IEEE Trans Plasma Sci (2020) 48:2723–35. doi:10.1109/tps.2020.3006257
47. Chen FF, Sudit ID, Light M. Downstream Physics of the Helicon Discharge. Plasma Sourc Sci. Technol. (1996) 5:173–80. doi:10.1088/0963-0252/5/2/009
48. Cox W, Charles C, Boswell RW, Hawkins R. Spatial Retarding Field Energy Analyzer Measurements Downstream of a Helicon Double Layer Plasma. Appl Phys Lett (2008) 93:071505. doi:10.1063/1.2965866
49. Takahashi K, Fujiwara T. Observation of Weakly and Strongly Diverging Ion Beams in a Magnetically Expanding Plasma. Appl Phys Lett (2009) 94:061502. doi:10.1063/1.3080205
50. Zhang Y, Charles C, Boswell R. Effect of Radial Plasma Transport at the Magnetic Throat on Axial Ion Beam Formation. Phys Plasmas (2016) 23:083515. doi:10.1063/1.4960828
51. Bennet A, Charles C, Boswell R. Non-local Plasma Generation in a Magnetic Nozzle. Phys Plasmas (2019) 26:072107. doi:10.1063/1.5098484
52. Martinez-Sanchez M, Navarro-Cavallé J, Ahedo E. Electron Cooling and Finite Potential Drop in a Magnetized Plasma Expansion. Phys Plasmas (2015) 22:053501. doi:10.1063/1.4919627
53. Ahedo E, Correyero S, Navarro-Cavallé J, Merino M. Macroscopic and Parametric Study of a Kinetic Plasma Expansion in a Paraxial Magnetic Nozzle. Plasma Sourc Sci. Technol. (2020) 29:045017. doi:10.1088/1361-6595/ab7855
54. Pottinger S, Lappas V, Charles C, Boswell R. Performance Characterization of a Helicon Double Layer Thruster Using Direct Thrust Measurements. J Phys D: Appl Phys (2011) 44:235201. doi:10.1088/0022-3727/44/23/235201
55. Takahashi K, Lafleur T, Charles C, Alexander P, Boswell RW, Perren M, et al. Direct Thrust Measurement of a Permanent Magnet Helicon Double Layer Thruster. Appl Phys Lett (2011) 98:141503. doi:10.1063/1.3577608
56. Charles C, Takahashi K, Boswell RW. Axial Force Imparted by a Conical Radiofrequency Magneto-Plasma Thruster. Appl Phys Lett (2012) 100:113504. doi:10.1063/1.3694281
57. Charles C, Boswell R, Takahashi K. Boltzmann Expansion in a Radiofrequency Conical Helicon Thruster Operating in Xenon and Argon. Appl Phys Lett (2013) 102:223510. doi:10.1063/1.4810001
58. Williams LT, Walker MLR. Thrust Measurements of a Radio Frequency Plasma Source. J Propulsion Power (2013) 29:520–7. doi:10.2514/1.B34574
Keywords: magnetic nozzle, electric propulsion, plasma expansion, radiofrequency plasma, low-temperature plasma, particle-in-cell (PIC)
Citation: Emoto K, Takahashi K and Takao Y (2021) Vector Resolved Energy Fluxes and Collisional Energy Losses in Magnetic Nozzle Radiofrequency Plasma Thrusters. Front. Phys. 9:779204. doi: 10.3389/fphy.2021.779204
Received: 18 September 2021; Accepted: 26 October 2021;
Published: 10 December 2021.
Edited by:
Francesco Taccogna, National Research Council (CNR), ItalyReviewed by:
Francesco Battista, Italian Aerospace Research Centre, ItalyCopyright © 2021 Emoto, Takahashi and Takao. This is an open-access article distributed under the terms of the Creative Commons Attribution License (CC BY). The use, distribution or reproduction in other forums is permitted, provided the original author(s) and the copyright owner(s) are credited and that the original publication in this journal is cited, in accordance with accepted academic practice. No use, distribution or reproduction is permitted which does not comply with these terms.
*Correspondence: Kazuma Emoto, a2F6dW1hLWVtb3RvLXZoQHludS5qcA==; Yoshinori Takao, dGFrYW9AeW51LmFjLmpw
Disclaimer: All claims expressed in this article are solely those of the authors and do not necessarily represent those of their affiliated organizations, or those of the publisher, the editors and the reviewers. Any product that may be evaluated in this article or claim that may be made by its manufacturer is not guaranteed or endorsed by the publisher.
Research integrity at Frontiers

Learn more about the work of our research integrity team to safeguard the quality of each article we publish.