- Department of Mathematics, Applied Mathematics, and Statistics, Case Western Reserve University, Cleveland, OH, United States
Blebbing occurs in cells under high cortical tension when the membrane locally detaches from the actin cortex, resulting in pressure-driven flow of the cytosol and membrane expansion. Some cells use blebs as leading edge protrusions during cell migration, particularly in 3D environments such as a collagen matrix. Blebs can be initiated through either a localized loss of membrane-cortex adhesion or ablation of the cortex in a region. Bleb morphologies resulting from different initiation mechanisms have not been studied in detail, either experimentally or with theoretical models. Additionally, material properties of the cytoplasm, such as elasticity, have been shown to be important for limiting bleb size. A 3D dynamic computational model of the cell is presented that includes mechanics and the interactions of the cytoplasm, the actin cortex, the cell membrane, and the cytoskeleton. The model is used to quantify bleb expansion dynamics and shapes that result from simulations using different initiation mechanisms. The cytoplasm is modeled as a both viscous fluid and as a poroelastic material. Results from model simulations with a viscous fluid cytoplasm model show much broader blebs that expand faster when they are initiated via cortical ablation than when they are initiated by removing only membrane-cortex adhesion. Simulation results using the poroelastic model of the cytoplasm provide qualitatively similar bleb morphologies regardless of the initiation mechanism. Parameter studies on bleb expansion time, cytoplasmic stiffness, and permeability reveal different scaling properties, namely a smaller power-law exponent, in 3D simulations compared to 2D ones.
1 Introduction
Blebs are round membrane protrusions that are used in important cellular processes, such as migration [1] and cytokinesis [2, 3]. The hallmark of a bleb is a separation of the cell membrane from the cortex, a thin layer of actin cytoskeleton that is normally attached to the cell membrane by linker proteins. Cells that bleb typically have high intracellular pressure compared to outside the cell. The source of this pressure is attributed to cortical tension due to the myosin molecular motors that slide actin filaments with respect to each other [4]. A bleb is initiated in a localized region by either a loss of membrane-cortex adhesion or by a defect in the actin cortex caused by laser ablation [5] or myosin-driven contractility [1]. After a bleb is nucleated, contractile stresses within the cortex are no longer transmitted to the membrane in this localized region, resulting in a pressure gradient and cytoplasmic flow that expands the membrane to create a bleb. A bleb is fully expanded after about 30 s [1], but the timescale is considerably shorter for cells such as Dictyostelium discoideum, where bleb expansion can occur in as little as 0.2 s [6]. Cortical components such as actin and myosin then diffuse into the bleb, the cortex reforms under the naked membrane, and the bleb retracts. During cell migration, the bleb may not retract because adhesion to the substrate (or ECM) may stabilize the bleb.
Theoretical modeling of blebbing has addressed various aspects of the process including expansion [7–10], retraction [11, 12], and migration [13–15]. One class of models is based on fluid-structure interaction, where the elastic membrane and cortex are immersed in fluid. Deformations of the elastic structures affect the fluid flow, and the fluid flow in turn influences the motion of the structures. First we summarize results from this approach using two-dimensional models. Using the framework of the immersed boundary (IB) method [16], simulation results from one model showed that cytoskeletal (cortical) drag, and not the viscosity of the cytoplasm, determined the timescale of bleb expansion [7]. When the cytoplasm was modeled as a poroelastic material, two bleb experiments from [5] were simulated. Results from these experiments found that the second bleb was approximately 30% smaller than the first bleb regardless of the location of the second bleb with respect to the first one. The authors found these experimental results could be explained by an initial fast time scale for pressure propagation across the cell combined with a slow timescale for pressure equilibration [9]. The models from [13, 17] follow a similar approach from [7, 9], but used a boundary integral method instead of the immersed boundary method. The authors simulated cell migration using blebs in confined and unconfined environments (swimming). A 2D agent-based model from [14, 18] was used to simulate blebbing-based migration. This model focused on interactions of the cell with different environments, and intracellular pressure was constant in simulations.
Several models consider membrane dynamics in blebbing cells [19–21]. These models assume a constant or specified intracellular pressure in the membrane energy. The 1D membrane model from [19] was used to find minimum conditions on pressure and membrane length for bleb nucleation, while the model from [20] found that membrane-cortex adhesion was critical in determining bleb initiation. The model from [19] was also used to quantify conditions for “circus” blebs that travel around the periphery of the cell. The 2D membrane model from [21] found conditions for circus bleb velocity in terms of biophysical parameters and was used to hypothesize that heterogeneity within the cell surface was necessary to maintain compact circus blebs.
Blebbing dynamics have been modeled in 3D for some simplified cases. The models in [8, 12, 15, 22] assume the cell is axisymmetric and intracellular pressure is constant. In the continuum mechanics model from [8], the membrane reference configuration was dynamically updated to maintain small increases in the area of the cell membrane. A similar approach that involved updating the membrane and cortical reference configuration to model bleb retraction was presented in [12]. In order to produce “small-necked” blebs observed in experiments, the authors in [22] needed to include either localized membrane growth or global cortical contraction. In a different approach, molecular dynamics simulations of a surface particle-based model were used to simulate bleb expansion in [23]. The authors determined that bleb formation is energetically favorable when the membrane area is larger than its attached cortical area. A membrane model of bleb expansion was simulated with a boundary integral method in [10]. Simulations showed conditions where either no bleb was nucleated, a bleb was nucleated without membrane peeling, and a bleb was nucleated with additional membrane peeling. Although this model included membrane-cortex adhesion dynamics, the membrane was assumed to be axisymmetric and the cortex was fixed in space. A model of bleb expansion that included reaction-diffusion of membrane-cortex adhesion proteins with limited membrane deformation was presented in [24]. Lastly, a full 3D model of bleb expansion with a viscous fluid cytoplasm (an extension of the model in [7]) was presented in [25] to illustrate a numerical method for computing forces on an elastic shell using the immersed boundary method [26].
All of the aforementioned studies highlight the importance of intracellular pressure and mechanics of different cellular components in blebbing dynamics. I consider blebs similar to those in experiments from [5], namely a single cell with one bleb without interactions to an extracellular matrix. These blebs expand on the order of 10 s. The contribution of this paper is a 3D dynamic model of bleb expansion that includes the mechanics of the membrane, cortex, and cytoplasm. In particular, the model presented here includes a dynamic cortex, different cytoplasmic models (viscous fluid and poroelastic material), and makes no a priori axisymmetric assumptions. I then use the model to simulate different bleb initiation using two different mechanisms: cortical ablation and loss of membrane-cortex adhesion. The 3D model with a poroelastic cytoplasm is then simulated to determine whether pressure dynamics follow the same behavior and scaling as described models in 1D [27] and 2D [9].
2 Materials and Methods
2.1 Overview of Model
The mathematical model of the cell consists of the membrane, cortex, membrane-cortex adhesion, and cytoplasm (see Figure 1). In particular, I consider two models of the cytoplasm: a viscous fluid model and a poroelastic model. In the poroelastic model, the cytoplasm includes a permeable elastic cytoskeleton. Detailed descriptions of the 2D models can be found in [7, 9]. The models are summarized here with detailed descriptions of notable differences between the 2D and 3D models.
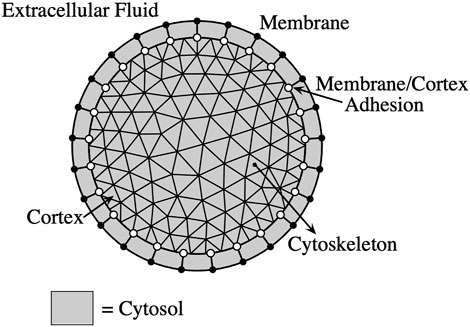
FIGURE 1. Bleb model schematic. Circles indicate the discretized membrane and cortex. The triangular grid represents the discretized cytoskeletal network (cortex/cytoskeletal adhesion not shown).
The cell membrane is modeled as an impermeable elastic structure that moves with the velocity of the cytosol (fluid portion of the cytoplasm) while the cortex and the cytoskeleton (in the case of the poroelastic model) are modeled as permeable elastic materials. The model equations consist of force balances on the liquid cytosol, cell cortex, and cytoskeleton, constitutive equations, and equations of motion for the structures. The membrane and cortex are represented by continuous 2D infinitely thin shells immersed in a 3D fluid domain. The cytoskeleton is represented by a 3D structure immersed in the fluid.
The immersed boundary (IB) method is used to account for the interactions between the components of the cell and cytosol/cytoplasm [16]. In the IB method, structures such as the membrane are represented in a moving, Lagrangian coordinate system, while fluid variables such as cytosolic velocity and pressure are located on a fixed, Eulerian coordinate system. A surface force density on an immersed structure is communicated to the fluid coordinates as follows,
where s ∈ Γ is the material coordinate and X (s, t) denotes the physical position of material point s at time t. The interpolation operator is given by
where Ω represents the fluid domain. In this paper, capitalized letters represent Lagrangian variables and lower case letters indicate Eulerian variables.
2.1.1 Viscous Fluid Cytoplasm Model
The model of bleb expansion in [7] consisted of the cell membrane modeled as an impermeable elastic stucture, the actin cortex treated as a one-dimensional poroelastic structure attached to the membrane, and the cytoplasm modeled as a viscous fluid. A 3D extension of this model was published in [25] to demonstrate different methods for computing forces on a deforming surface. In this paper, I use the approach from [28] to compute forces due to elasticity on the cortex instead of the method in [25]. The fluid equation includes terms from the elastic membrane, membrane-cortex adhesion, and drag with cortex:
where u represents fluid velocity, p pressure, and fi denotes force density on the fluid grid. Force densities due to membrane elasticity, membrane-cortex adhesion, and cortical drag are computed on their respective Lagrangian structures, then are spread onto the fluid grid using Eq. 1.
The drag force on the cortex is balanced by elastic forces within the cortex and adhesion to the membrane:
The drag force density from the cortex moving through the fluid is explicitly given by
and the drag force density on the fluid is related to the cortex drag force density by
The membrane and cortex are each modeled as a hyperelastic shell that experiences forces due to surface tension and stretching. This model is consistent with [29], where the surface area of membrane on a bleb was shown to increase during expansion. A hyperelastic material is characterized by an energy functional
where kE is the bulk modulus, μE is the shear modulus and s = (s1, s2) represents the surface material coordinates. The following tensors G and G0 are defined as
where X(s) denotes the current surface position, Z(s) denotes the reference membrane position, and the scalar
where γi represents the parameter for surface tension on the membrane or cortex. The force density per unit reference configuration is then computed by
where i indicates either the membrane or the cortex.
Membrane-cortex adhesion is modeled by elastic springs attaching the membrane to the cortex with force density
The membrane-cortex adhesion stiffness coefficient
Given the stiffness coefficient
Given a configuration of the membrane and cortex, the forces are computed, and the velocities of the fluid and cortex are obtained by solving Eq. 3 and Eq. 5 as described in Section 2.2. Then, the positions of the membrane and cortex are updated with their respective velocities.
Table 1 lists the default parameters for blebbing simulations. The values for membrane and cortex surface tension were decreased by 50% compared to the values in [9] so that the initial pressure difference across the membrane matches the difference in the 2D model. The bulk modulus of the cortex was taken to be several orders of magnitude higher than the membrane to reflect stiffness due to the cross-linked cortical actin network.
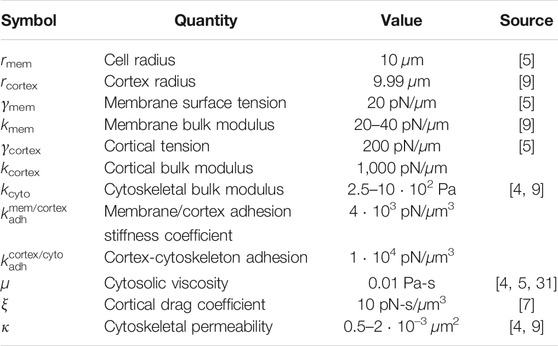
TABLE 1. Default model parameters for the blebbing model. Values for the shear modulus were taken to be the same value as those listed for the bulk modulus for the membrane, cortex, and cytoskeleton, respectively.
2.1.2 Poroelastic Cytoplasm Model
The model formulation is the same as above with the addition of a poroelastic cytoplasm throughout the cell interior (a 2D version of the model is described in [9, 32]). The cytoskeleton is represented by a porous elastic network in Figure 1). The fluid equations have an additional term for cytoskeletal drag.
The force density balance on the cortex includes an additional adhesion term to link the cortex to the cytoskeleton,
Similarly, the force density balance on the cytoskeleton is
where cytoskeletal drag is defined as
where κ is the permeability of the cytoskeleton. In this formulation of poroelasticity, the volume fraction of the network (cytoskeleton) is negligible [32].
The cytoskeleton is modeled as a porous, neo-Hookean elastic structure. Elastic forces are computed using the energy functional-based version of the IB method proposed in [33]. The neo-Hookean strain energy is the same as given in Eq. 8, but the 2 × 2 tensors G and G0 now have dimensions 3 × 3 for the solid cytoskeleton. The equivalence of the solid and surface neo-Hookean energy formulas is described in [28].
The force density for cortex-cytoskeleton adhesion is computed similarly to cortex-membrane adhesion in Eq. 12 with the appropriate scaling of the force densities. Given the stiffness coefficient for cortex-cytoskeleton adhesion
The structures are updated with their respective velocities.
Table 1 lists the values of parameters for blebbing simulations. Most simulations in the Results section use a value of 20 pN/μm for membrane stiffness, 500 Pa for kcyto, and 1 ⋅ 10–2 µm2 for permeabilty.
2.2 Numerical Formulation
Fluid variables (components of velocity and pressure) are discretized on an Eulerian grid of size [0, 30] × [0, 30] × [0, 35] μm and spacing h = 30/32. The cytoskeleton is represented by an adaptive unstructured tetrahedral mesh with radius 9.99 μm. The mesh is more refined near the cortex with approximately two Lagrangian points per Eulerian grid cell and one Lagrangian point per Eulerian grid cell in the interior. The mesh consists of 28,153 points and 153,202 tetrahedra. The cortex is taken to be the boundary of the cytoskeleton, and membrane points are initialized to be the same as cortical points, except adjusted to have a radius of 10 μm. The membrane and cortex each consisted of 5,018 points and 10,032 triangles. The unstructured meshes were generated using distmesh [34].
To compute elastic forces on the membrane, cortex, and cytoskeleton, methods from [28, 33] are implemented. Elastic forces are computed directly from an energy functional without the use of stress tensors by taking the variational derivative of the energy (see Eq. 11). I assume the deformation map X (s, t) is a piecewise linear function on each triangle of a discretized surface (tetrahedron in the cytoskeleton) so that the deformation gradient tensor and strain energy are constant on each triangle (or tetrahedron). This simplifies the integral of the strain energy density in Eq. 8 and Eq. 10. The variational derivative in Eq. 11 can then be computed analytically on each discretized element, and the force at each vertex i is the sum of all elements that contain i. Details for computing forces due to shell elasticity can be found in [28], and details for computing the forces due to the elasticity of a solid are located in [32, 33].
The time update follows [9, 32]. Given the current position of the structures (membrane, cortex, and cytoskeleton):
1. Compute elastic forces based on the current membrane, cortex, and cytoskeleton configuration (
2. Spread the force densities onto nearby Eulerian points using Eq. 1.
3. Solve the forced Stokes equations to obtain the fluid velocity u.
4. Interpolate the fluid velocity to the structure using Eq. 2 to obtain U.
5. Compute the porous structure velocities by Eq. 15 and Eq. 23, and update the structure by
where ζi indicates the drag coefficient of the cortex or cytoskeleton, and the forces acting on the respective structure denoted by
The time step for simulations using a pure fluid cytoplasm is Δt = 1 ⋅ 10–4 (seconds). Cytoplasmic elasticity introduces significant stiffness in the model, and the time step is reduced to Δt = 7.5 ⋅ 10–6 − 3 ⋅ 10–5. Small time steps are required for numerical stability when cytoplasmic permeability and/or elastic moduli are relatively large.
Velocity and pressure satisfy periodic boundary conditions on the Eulerian (fluid) domain. A Fourier-spectral method is used to solve the Stokes equations (Eq. 3 and Eq. 4) for the viscous fluid model, Eq. 16 and Eq. 17 for the poroelastic fluid model).
The IB method involves approximate δ functions for the spreading and interpolating operators in Eq. 1 and Eq. 2 . Here, I use spectral delta functions as described in the Supporting Material of [9] to avoid unphysical velocities that occur in regions with a large pressure jump, such as across the cell membrane. The discretized spreading and interpolation integrals are approximated in Fourier space by a nonuniform fast Fourier transform (NUFFT) described in [35]. The result yields obtain a computationally efficient approximation of the Fourier transform of the spread force density. I use an mth order cardinal B-spline with compact support over m + 1 mesh points as a smoothing kernel [36]. In this paper, the oversampling factor is r = 1.5 and m = 6. The Fourier transform of the spread forces are filtered with a second-order raised cosine filter [37],
to remove the Gibbs phenomenon in the numerical solution to the pressure field.
3 Results
At the beginning of a simulation, the cell is pressurized due to membrane and cortical tension. According to Laplace’s law, the change in pressure ΔP across a spherical membrane satisfies ΔP = γ/(2R), where γ represents surface tension and R is the radius of the cell. Here, ΔP ≈ (γmem + γcortex)/(2 rmem) = 44 Pa.
A bleb is initiated by either removing membrane-cortex adhesion in a circular region at the top of the cell or by cortical ablation (see Figure 2). The initial radius of the circle is approximately 2.5 μm and centered at the point on the membrane with the highest z-coordinate. Numerically,

FIGURE 2. A bleb is initiated by either (A) loss of membrane-cortex adhesion or (B) cortical ablation. (C) Top down view of the cell. For (A), membrane-cortex adhesion parameters are set to zero within the bleb ring region, whereas for (B) cortical stiffness and cortex-cytoskeleton adhesion parameters are also set to zero within the bleb region (inside the dashed-line circle). The two red points are used to compute the relative change in bleb ring diameter. The blue circle shows the point with the largest z-coordinate on the cell that is used to compute bleb height.
For both initiation mechanisms, when cortical tension is no longer transmitted to the membrane, the resulting pressure gradient leads to fluid flow and membrane expansion in the localized region. Bleb expansion ceases when membrane tension balances intracellular pressure.
Parameter values for simulations are located in Table 1. Unless otherwise indicate, all simulations with a fluid cytoplasm use a value of 20 pN/μm for the membrane bulk modulus. Likewise, all simulations with a poroelastic cytoplasm use a value of 500 Pa for the bulk modulus of the cytoplasm and 1 ⋅ 10–3 for the cytoskeletal permeability unless otherwise stated.
3.1 Bleb Initiation Dynamics
I begin by simulating bleb expansion by removing only membrane-cortex adhesion within the bleb ring region. Figure 3 shows the cell membrane position and speed (magnitude of the velocity on the cell membrane) at several time values during bleb expansion. The speed is highest after removing membrane-cortex adhesion and decreases over time. Similar to 2D simulations from [9], the bleb appears smaller in simulations using a poroelastic cytoplasm model compared to the pure fluid model.
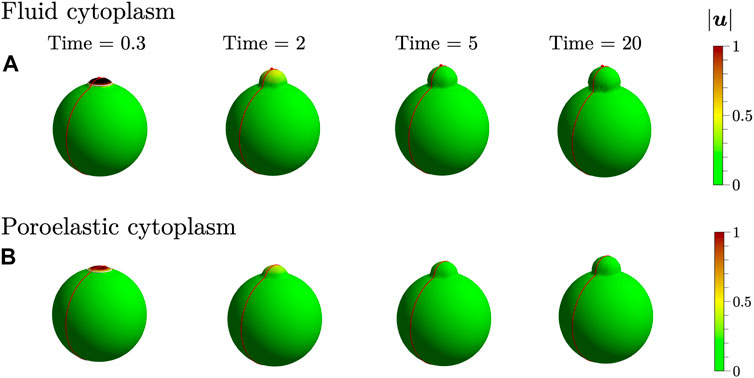
FIGURE 3. A bleb is initiated by a loss of membrane-cortex adhesion within the bleb ring region using (A) a pure fluid cytoplasm and (B) a poroelastic cytoplasm. The colorbar indicates the speed of the cell membrane in μm/s. The white ring at the top of the cell at 0.3 s indicates the initial location of the bleb ring. The red curve indicates the xz-plane that intersects the cell membrane to generate 2D slices of the pressure field. The red point in (A) is used to define bleb height.
Intracellular pressure dynamics are shown in Figure 4 for bleb simulations using fluid and poroelastic cytoplasm models. Intracellular pressure appears spatially uniform inside the cell body (outside of the bleb) for the simulation with a fluid cytoplasm (Figures 4A,C). The maximum pressure inside the cell decreases by about 4 Pa over 40 s of simulation time. For the poroelastic cytoplasm, a pressure gradient extends across the entire cell (Figures 4B,D). Pressure also equilibrates to a smaller value: 34 Pa for the poroelastic cytoplasm model compared to 41 Pa for the fluid cytoplasm model. Maximum pressure inside the cell decreases by approximately 10 Pa over 40 s of simulation time. The decrease in intracellular pressure results in decreased fluid speed and bleb size.
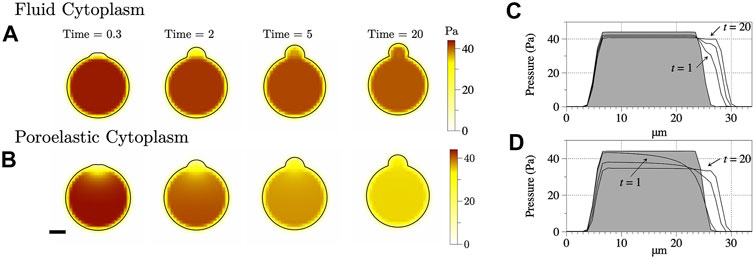
FIGURE 4. (A–B) Intracellular pressure in the xz-plane (y = 15) for the simulations from Figure 3. The scale bar denotes 5 μm. (C–D) Pressure along the line z = 0 to 30 for x, y = 15. The intermediate time denotes pressure at t = 2 s.
Decreased intracellular pressure in the poroelastic cytoplasm is a result of compression of the cytoskeleton as the bleb expands. The total volume of the cell is conserved so that as the bleb expands, the main cell body is compressed. In [9], the cytoskeletal pressure that acts against compressive stresses was given as − kcyto (J − 1), where J − 1 is the strain in Eq. 11. Cytoskeletal pressure at several time values is shown in Supplementary Figure S1 when kcyto = 500 Pa. Data show the cytoskeletal network is compressed near the nucleation site, and cytoskeletal pressure approaches a spatially nonuniform profile. Cytoskeletal pressure over time when kcyto = 250, 500, and 1,000 Pa at the center of the cell is shown in Supplementary Figure S2. The pressure approaches a steady state value and increases with kcyto.
Bleb size is quantified two ways, depending on how the bleb is initiated. When a bleb is initiated through a loss of membrane-cortex adhesion, I measure the relative bleb volume over time. The volume of the cortex is subtracted from the volume of the membrane, then divided by the initial volume of the membrane. Since there is an initial small volume between the membrane and cortex, this small initial volume is subtracted from the relative bleb volume equation, given by
Note that the volume of the membrane is approximately the same value over time due to incompressibility of the fluid.
When a bleb is initiated through cortical ablation, the cortex is no longer a closed surface. I use bleb height as a measurement of bleb size and is defined as follows. The point on the membrane with the largest z-coordinate (see Figure 3A) and the point with the smallest z coordinate are identified. Initially, the difference between these z coordinates is the diameter of the cell, 20 μm. The difference between these z coordinates is measured over time. The initial distance is then subtracted from the difference between the z values,
Bleb height, relative bleb volume, and maximum intracellular pressure over time are shown in Figure 5 for blebbing simulations using the viscous fluid and poroelastic cytoplasm models. Bleb height and volume initially increase after bleb nucleation, then approach a steady state value. In this paper, steady state is defined as a quantity having less than 5% relative change over 10 s of simulation time. Following [9], bleb expansion time is defined as 90% of the steady state value. White circles in Figure 5A indicate bleb expansion time using bleb height, and black circles in Figure 5B denote bleb expansion time defined as 90% of steady state relative bleb volume. Bleb height and volume are larger for the viscous fluid cytoplasm model compared to the poroelastic one. Bleb expansion time is also faster in simulations using the viscous fluid cytoplasm model.
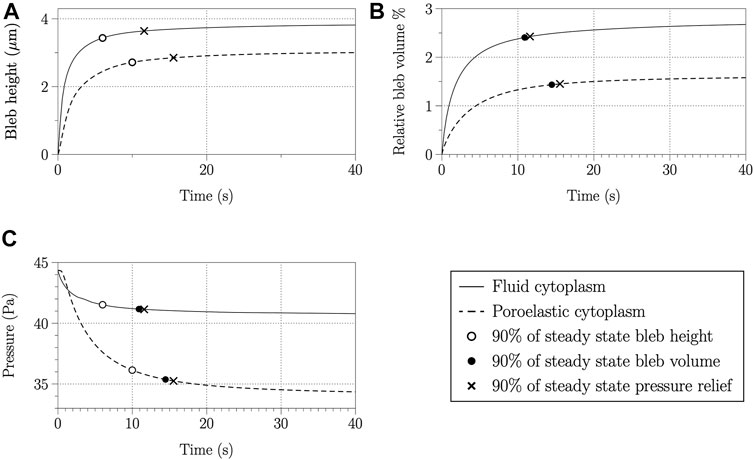
FIGURE 5. Bleb height (A), relative bleb volume (B), and maximum pressure inside the cell (C) over time for a simulation using a fluid cytoplasm (solid lines) and poroelastic cytoplasm (dashed lines). The open circle, filled circle, and × denote the time value when bleb height, relative bleb volume, and maximum pressure, respectively, achieve 90% of their steady state values.
Maximum intracellular pressure decreases over time as the bleb expands for simulations with fluid and poroelastic cytoplasm models, but significantly more pressure is relieved when bleb expansion is simulated using a poroelastic cytoplasm model (Figures 4, 5C). To determine the time scale of pressure equilibration, the change in pressure from its initial value over 40 s is measured (approximately 4 Pa for a simulation with a fluid cytoplasm and 10 Pa for a simulation with a poroelastic cytoplasm). Pressure equilibration time is computed as the time when the maximum intracellular pressure equals the initial value minus 90% of the change in pressure over 40 s. Figure 5C) shows maximum intracellular pressure evaluated at pressure equilibration time, bleb expansion time using bleb height, and bleb expansion time using relative bleb volume. The data show close agreement between pressure equilibration time and bleb expansion time using relative bleb volume. Although bleb expansion time using bleb height is about 5 s faster than pressure equilibration time, 80% of the change in pressure is achieved by this time for simulations with both the fluid cytoplasm and poroelastic cytoplasm models. Therefore, bleb expansion time measured by using height or relative volume approximately correspond to pressure equilibration time.
3.2 Cortical Ablation
Bleb initiation by cortical ablation is simulated for several values of cortical elastic modulus, kcortex = 100, 500, and 1,000 with both the fluid and poroelastic cytoplasm models. Figure 6B shows steady state membrane shape and mean curvature for simulations with cortical ablation. Membrane shape and curvature for bleb expansion by a loss of membrane-cortex adhesion with cortical elastic modulus kcortex = 1,000 is shown in Figure 6A for comparison. The magnitude of mean curvature is computed along edges of triangles and assigned to vertices as described in [28, 38]. Following [25], the convex hull of the membrane is computed to determine the sign of mean curvature; points on the convex part of the surface are assigned negative mean curvature values, and other points on the membrane maintain their positive sign.
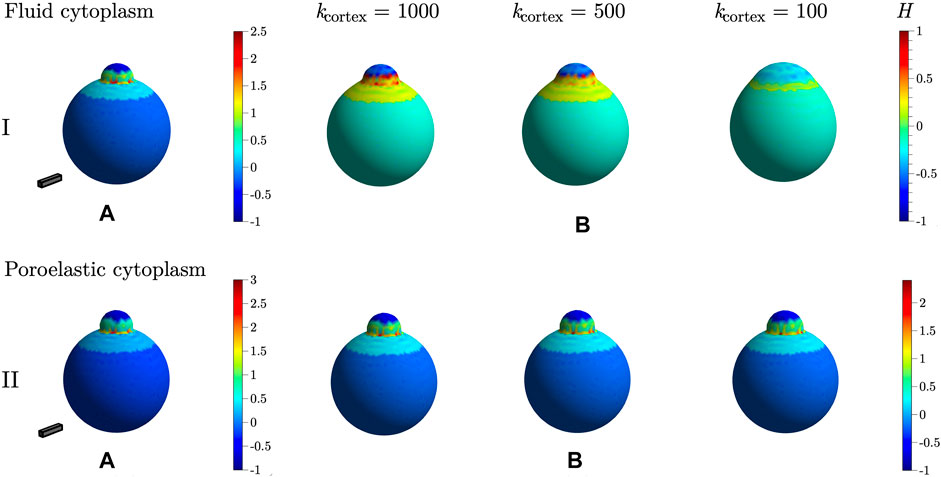
FIGURE 6. Steady state bleb shapes and mean curvature when a bleb is initiated by (A) loss of membrane-cortex adhesion and (B) cortical ablation for different values of cortical elastic modulus kcortex. Row I shows results from the fluid cytoplasm, and row II results are from simulations with a poroelastic cytoplasm. For the fluid cytoplasm model, the bulk modulus of the membrane was set to kmem = 40 pN/μm. For the poroelastic cytoplasm model, kmem = 20 pN/μm, kcyto = 500 Pa, and κ = 1 ⋅ 10–3 μm3. Other parameters are listed in Table 1. The scale bar has dimensions 5 × 1 × 1 μm. The colorbar indicates the value of mean curvature H over the surface of the membrane.
Data in Figure 6 I show that steady state bleb shape is very sensitive to changes in cortical elastic modulus in the fluid cytoplasm model. As the values of cortical elastic modulus decrease, the bleb becomes more broad with a decrease in positive mean curvature near the bleb neck as compared to data when the bleb is initiated by only a loss in membrane-cortex adhesion (Figure 6IA). When blebbing is simulated using the poroelastic model, membrane shape and curvature do not change significantly as the cortical elastic modulus decreases. Data in Figure 6IIB show slightly broader blebs with a small decrease in positive mean curvature near the bleb neck as compared to membrane shape and mean curvature in Figure 6IIA.
To quantity the broadness of the bleb, bleb ring diameter, defined as the distance between the point on the bleb ring closest to origin (in Euclidean distance) and the point furthest away from the origin as illustrated in Figure 2C, is computed. The change in bleb ring diameter for cortical ablation simulations is graphed in Figure 7 for values of cortical elastic modulus, kcortex = 100, 500, and 1,000 with both the fluid and poroelastic cytoplasm models. The change in bleb ring diameter is defined as steady state bleb ring diameter minus the steady state bleb ring diameter for a simulation when a bleb is initiated by a loss of membrane-cortex adhesion with cortical elastic modulus kcortex = 1,000. Data in Figure 7 show the diameter of the bleb ring increases as the cortical elastic modulus decreases, but the increase is relatively much larger for simulations with the fluid cytoplasm model than for simulations with the poroelastic model.
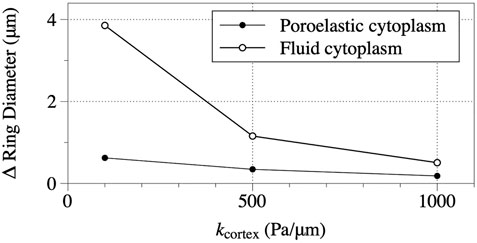
FIGURE 7. Steady state change in bleb ring diameter for simulations with the fluid cytoplasm model and poroelastic cytoplasm model. Change in bleb ring diameter is defined as bleb ring diameter minus the steady state bleb ring diameter for simulations where blebs were initiated by removing only membrane-cortex adhesion. The bleb ring diameter for the fluid cytoplasm simulation where a bleb is initated by removing only membrane-cortex adhesion is 0.75 μm. The corresponding value for the poroelastic cytoplasm simulation is 0.97 μm. The parameters for the simulations are the same as described in the caption for Figure 6.
Bleb expansion time decreases when a bleb is initiated by cortical ablation compared to a loss of membrane-cortex adhesion. Expansion time is calculated by computing the time value when 90% of the steady state value of bleb height is reached. When blebbing is simulated with a fluid cytoplasm and a loss in membrane-cortex adhesion (Figure 6IA), bleb expansion time is 1.95 s. In comparison, bleb expansion time from cortical ablation simulations (Figure 6IB) is 0.016, 0.023, and 0.028 s for kcortex = 100, 500, and 1,000 pN/μm, respectively. Bleb expansion time for the simulation with a poroelastic cytoplasm model initiated with loss of membrane-cortex adhesion (Figure 6IIA) is 10 s. When a bleb is initiated with cortical ablation, bleb expansion time decreases to 7.37, 6.96, and 6.60 s for kcortex = 100, 500, and 1,000 pN/μm, respectively. Data from bleb simulations with a fluid cytoplasm show expansion time decreases by two orders of magnitude compared to simulations when blebbing is initiated by a loss in membrane-cortex adhesion. Simulations from the poroelastic cytoplasm model with cortical ablation show a decrease in bleb expansion time compared to initiation by a loss in membrane-cortex adhesion, but the relative decrease is approximately 30%.
3.3 Effect of Poroelasticity on Bleb Expansion Time
This section focuses on bleb expansion dynamics when the cytoplasm is modeled by poroelastic material, and a bleb is initiated by a loss in membrane-cortex adhesion. Several studies have used a poroelastic model of the cytoplasm to interpret experimental results. For example, when blebbing was locally inhibited by myosin-II-inhibiting drugs, blebbing was unaffected in other parts of the cell, suggesting that intracellular pressure is not equilibrated on the time scale of bleb expansion [27]. Using a simple 1D model, the authors in [27] showed that pressure diffuses over a length
Figure 8 shows bleb expansion time as a function of cytoplasmic permeability κ and bulk elastic modulus G. Expansion time is computed by both relative bleb volume using Eq. 26 (Figure 8A) and bleb height Eq. 27 (Figure 8B). The data show qualitative agreement with results from the 2D model in [9]. Expansion time decreases as cytoplasmic permeability and stiffness increase. Bleb height (and volume) decrease as cytoplasmic stiffness increase. Note that bleb height and volume each maintain the same value for different values of permeability, but change as a function of elastic modulus. One difference from 2D model results is that data in Figure 8 show bleb expansion time scales slower than κ−1. When relative bleb volume is the metric, expansion time scales like
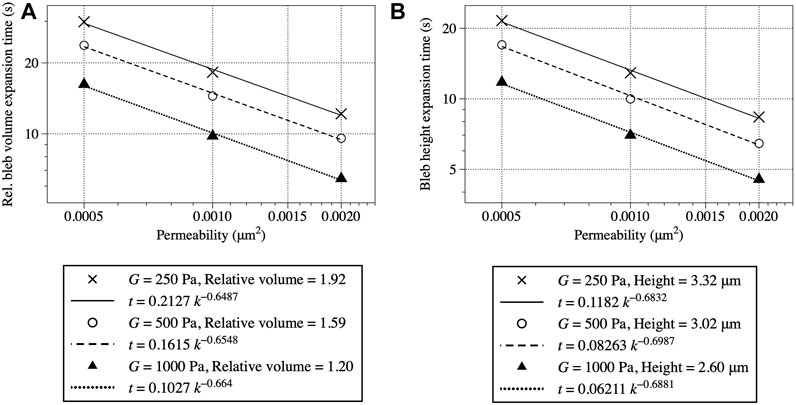
FIGURE 8. Bleb expansion time in seconds as a function of cytoplasmic bulk modulus G and permeability κ. Bleb expansion is computed using relative bleb volume in (A) and bleb height in (B). For both figures, the expansion time is 90% of the steady state value listed in the legend.
4 Discussion
In this work, fully 3D simulations of bleb expansion with two different rheological descriptions of the cytoplasm, purely viscous fluid and poroelastic material, are presented. The model formulation follows [9], with significant extensions to model the elasticity of the membrane and cytoskeleton. It should be noted that no geometric simplifications, such as axisymmetry, were made. 3D models allow quantitative comparision to experimental data. For example, values for relative bleb volume reported in Figure 5 match those computed from experimental data in [5].
3D simulations are necessary to simulate the dynamics of cortical ablation, rupturing the cortical actin shell, which has been performed in experiments and has been hypothesized to occur due to localized regions of myosin-driven contractility. In a 2D model, the cortex can be thought of as a rubber band that quickly recoils after being cut. In the full 3D model, an additional line tension helps to maintain the structure of the elastic cortical shell. Simulations with a viscous fluid cytoplasm show much broader blebs that expand several orders of magnitude faster than expansion times from experiments. Bleb shape and expansion times in simulations with a poroelastic cytoplasm are qualitatively similar to those when blebbing was initiated with only removing membrane-cortex adhesion. It is energetically unfavorable for the membrane to maintain regions of high curvature, such as those observed in blebs, and these results suggest that the internal cytoskeleton along with attachments from the membrane to the cytoskeleton help maintain the shape of bleb-like protrusions.
In cortical ablation simulations with a viscous fluid cytoplasm, the timescale of bleb expansion is determined primarily by fluid viscosity in the absence of cortical drag [7]. Cytoplasm drag is still present during simulations with a poroelastic cytoplasm when blebs are initiated with cortical ablation. Although bleb expansion is slightly faster compared to the case when blebs are initiated by a loss of membrane-cortex adhesion, cytoplasmic drag dominates the timescale of bleb expansion, and biologically relevant values are obtained from these simulations. The decrease in bleb expansion time can be explained by a loss of cortical drag within the bleb ring region.
Pressure dynamics are quantified for both models of the cytoplasm with qualitatively similar behavior to 2D model simulations results from [9]. Pressure in the main cell body, i.e. the cell except the bleb, is approximately uniform for simulations with a viscous fluid cytoplasm, and diffuses across the cell body in simulations with a poroelastic cytoplasm. Instances of uncontrolled bleb growth for soft membranes were reported in [9] for simulations with a purely viscous cytoplasm. Although I observed large blebs in 3D simulations with a soft membrane (data not shown), I was unable to confirm the growth was actually uncontrolled. As the bleb expands, the spacing between the discretized nodes became too large to obtain reliable results from the simulation. Extending the numerical method to include mesh refinement within the bleb would be necessary to ascertain whether uncontrolled bleb growth can occur in 3D.
In a parameter study where bleb expansion is simulated with different values of permeability and cytoplasmic stiffness, I found that bleb expansion time follows a power law, where t ∼ κ−p, where p = 0.65, 0.69, depending on whether bleb volume or height was used to compute expansion time. These results are in contrast to the scaling law calculated from analyzing 2D simulations in [9] and 1D model analysis in [27]. If poroelasticity alone determines the time scale of bleb expansion, it can be shown that cytoskeletal displacement follows a diffusion equation after some simplifying model assumptions, i.e., deformation only in the radial direction and applying a small displacement in the radial direction (a reduced model in polar coordinates is located in [32]). Because the scaling of the diffusion equation remains the same in any dimension, my results point to the influence of other important contributing factors to limiting bleb expansion, such as stiffness of the cortex and membrane, and cortical permeability. The influence of these factors is a subject of future work.
The model presented here is limited in that I consider one cell and focus on the expansion of one bleb to focus on intracellular pressure dynamics with different models of the cytoplasm. Recent work on modeling blebbing-based migration involves simulations with multiple blebs and cycles of bleb expansion and retraction, but assume uniform cytoplasmic pressure [14, 15]. I have also neglected to include membrane-cortex adhesion dynamics [10, 19, 21]. Model extensions are currently underway to include these important effects into the current modeling framework.
Finally, I note that simulations of fully 3D models are computationally expensive; some simulations in this paper took weeks to run using parallelized C++ code on a cluster. Numerical methods for stiff fluid-structure interaction systems will need to be investigated and implemented in order to simulate multiple blebs and cell migration in 3D environments, particularly with an internal elastic cytoskeletal network.
Data Availability Statement
The raw data supporting the conclusions of this article will be made available by the author, without undue reservation.
Author Contributions
WS designed the research, developed the model, simulated and analyzed results, and wrote the article.
Funding
This work was supported in part by grant #429808 from the Simons Foundation to WS.
Conflict of Interest
The author declares that the research was conducted in the absence of any commercial or financial relationships that could be construed as a potential conflict of interest.
Publisher’s Note
All claims expressed in this article are solely those of the authors and do not necessarily represent those of their affiliated organizations, or those of the publisher, the editors and the reviewers. Any product that may be evaluated in this article, or claim that may be made by its manufacturer, is not guaranteed or endorsed by the publisher.
Acknowledgments
This work made use of the High Performance Computing Resource in the Core Facility for Advanced Research Computing at Case Western Reserve University. The author would like to thank Calina A. Copos for providing code for computing elasticity of the cytoskeleton, Ondrej Maxian for providing code to compute membrane elasticity, and Robert D. Guy for helpful discussions.
Supplementary Material
The Supplementary Material for this article can be found online at: https://www.frontiersin.org/articles/10.3389/fphy.2021.775465/full#supplementary-material
References
1. Charras G, Paluch E Blebs lead the Way: How to Migrate without Lamellipodia. Nat Rev Mol Cel Biol. (2008) 9:730–6. doi:10.1038/nrm2453
2. Sedzinski J, Biro M, Oswald A, Tinevez J-Y, Salbreux G, Paluch E Polar Actomyosin Contractility Destabilizes the Position of the Cytokinetic Furrow. Nature (2011) 476:462–6. doi:10.1038/nature10286
3. Wang X, Li L, Shao Y, Wei J, Song R, Zheng S, et al. Effects of the Laplace Pressure on the Cells during Cytokinesis. iScience (2021) 24:102945. doi:10.1016/j.isci.2021.102945
4. Charras GT, Coughlin M, Mitchison TJ, Mahadevan L Life and Times of a Cellular Bleb. Biophysical J (2008) 94:1836–53. doi:10.1529/biophysj.107.113605
5. Tinevez J-Y, Schulze U, Salbreux G, Roensch J, Joanny J-F, Paluch E Role of Cortical Tension in Bleb Growth. Proc Natl Acad Sci (2009) 106:18581–6. doi:10.1073/pnas.0903353106
6. Ibo M, Srivastava V, Robinson DN, Gagnon ZR. Cell Blebbing in Confined Microfluidic Environments. PLOS One (2016) 11:e0163866. doi:10.1371/journal.pone.0163866
7. Strychalski W, Guy RD A Computational Model of Bleb Formation. Math Med Biol (2013) 30:115–30. doi:10.1093/imammb/dqr030
8. Woolley TE, Gaffney EA, Oliver JM, Baker RE, Waters SL, Goriely A Cellular Blebs: Pressure-Driven, Axisymmetric, Membrane Protrusions. Biomech Model Mechanobiol (2014) 13:463–76. doi:10.1007/s10237-013-0509-9
9. Strychalski W, Guy RD Intracellular Pressure Dynamics in Blebbing Cells. Biophysical J (2016) 110:1168–79. doi:10.1016/j.bpj.2016.01.012
10. Fang C, Hui TH, Wei X, Shao X, Lin Y A Combined Experimental and Theoretical Investigation on Cellular Blebbing. Sci Rep (2017) 7:16666. doi:10.1038/s41598-017-16825-0
11. Young J, Mitran S A Numerical Model of Cellular Blebbing: a Volume-Conserving, Fluid-Structure Interaction Model of the Entire Cell. J Biomech (2010) 43:210–20. doi:10.1016/j.jbiomech.2009.09.025
12. Woolley TE, Gaffney EA, Goriely A Membrane Shrinkage and Cortex Remodelling Are Predicted to Work in harmony to Retract Blebs. R Soc Open Sci (2015) 2:150184. doi:10.1098/rsos.150184
13. Lim FY, Koon YL, Chiam K-H A Computational Model of Amoeboid Cell Migration. Comp Methods Biomech Biomed Eng (2013) 16:1085–95. doi:10.1080/10255842.2012.757598
14. Tozluoğlu M, Tournier AL, Jenkins RP, Hooper S, Bates PA, Sahai E Matrix Geometry Determines Optimal Cancer Cell Migration Strategy and Modulates Response to Interventions. Nat Cel Biol. (2013) 15:751–62. doi:10.1038/ncb2775
15. Woolley TE, Gaffney EA, Goriely A Random Blebbing Motion: A Simple Model Linking Cell Structural Properties to Migration Characteristics. Phys Rev E (2017) 96:012409. doi:10.1103/PhysRevE.96.012409
16. Peskin CS Numerical Analysis of Blood Flow in the Heart. J Comput Phys (1977) 25:220–52. doi:10.1016/0021-9991(77)90100-0
17. Yip AK, Chiam K-H, Matsudaira P Traction Stress Analysis and Modeling Reveal that Amoeboid Migration in Confined Spaces Is Accompanied by Expansive Forces and Requires the Structural Integrity of the Membrane-Cortex Interactions. Integr Biol (2015) 7:1196–211. doi:10.1039/C4IB00245H
18. Tozluoglu M, Mao Y, Bates PA, Sahai E Cost-benefit Analysis of the Mechanisms that Enable Migrating Cells to Sustain Motility upon Changes in Matrix Environments. J R Soc Interf (2015) 12:20141355. doi:10.1098/rsif.2014.1355
19. Lim FY, Chiam K-H, Mahadevan L The Size, Shape, and Dynamics of Cellular Blebs. Epl (2012) 100:28004. doi:10.1209/0295-5075/100/28004
20. Alert R, Casademunt J Bleb Nucleation through Membrane Peeling. Phys Rev Lett (2016) 116:068101. doi:10.1103/PhysRevLett.116.068101
21. Manakova K, Yan H, Lowengrub J, Allard J Cell Surface Mechanochemistry and the Determinants of Bleb Formation, Healing, and Travel Velocity. Biophysical J (2016) 110:1636–47. doi:10.1016/j.bpj.2016.03.008
22. Woolley TE, Gaffney EA, Oliver JM, Waters SL, Baker RE, Goriely A Global Contraction or Local Growth, Bleb Shape Depends on More Than Just Cell Structure. J Theor Biol (2015) 380:83–97. doi:10.1016/j.jtbi.2015.04.023
23. Spangler EJ, Harvey CW, Revalee JD, Kumar PBS, Laradji M Computer Simulation of Cytoskeleton-Induced Blebbing in Lipid Membranes. Phys Rev E (2011) 84:051906. doi:10.1103/PhysRevE.84.051906
24. Werner P, Burger M, Pietschmann J-F A PDE Model for Bleb Formation and Interaction with Linker Proteins. Trans Maths Its Appl (2020) 4:1–59. doi:10.1093/imatrm/tnaa001
25. Maxian O, Kassen AT, Strychalski W A Continuous Energy-Based Immersed Boundary Method for Elastic Shells. J Comput Phys (2018) 371:333–62. doi:10.1016/j.jcp.2018.05.045
26. Peskin CS The Immersed Boundary Method. Acta Numerica (2002) 11:479–517. doi:10.1017/S0962492902000077
27. Charras GT, Yarrow JC, Horton MA, Mahadevan L, Mitchison TJ Non-equilibration of Hydrostatic Pressure in Blebbing Cells. Nature (2005) 435:365–9. doi:10.1038/nature03550
28. Fai TG, Griffith BE, Mori Y, Peskin CS Immersed Boundary Method for Variable Viscosity and Variable Density Problems Using Fast Constant-Coefficient Linear Solvers I: Numerical Method and Results. SIAM J Sci Comput (2013) 35:B1132–B1161. doi:10.1137/120903038
29. Goudarzi M, Tarbashevich K, Mildner K, Begemann I, Garcia J, Paksa A, et al. Bleb Expansion in Migrating Cells Depends on Supply of Membrane from Cell Surface Invaginations. Dev Cel (2017) 43:577–87. e5. doi:10.1016/j.devcel.2017.10.030
30. Woolley TE, Gaffney EA, Waters SL, Oliver JM, Baker RE, Goriely A Three Mechanical Models for Blebbing and Multi-Blebbing. IMA J Appl Maths (2014) 79:636–60. doi:10.1093/imamat/hxu028
31. Moeendarbary E, Valon L, Fritzsche M, Harris AR, Moulding DA, Thrasher AJ, et al. The Cytoplasm of Living Cells Behaves as a Poroelastic Material. Nat Mater (2013) 12:253–61. doi:10.1038/nmat3517
32. Strychalski W, Copos CA, Lewis OL, Guy RD A Poroelastic Immersed Boundary Method with Applications to Cell Biology. J Comput Phys (2015) 282:77–97. doi:10.1016/j.jcp.2014.10.004
33. Devendran D, Peskin CS An Immersed Boundary Energy-Based Method for Incompressible Viscoelasticity. J Comput Phys (2012) 231:4613–42. doi:10.1016/j.jcp.2012.02.020
34. Persson P-O, Strang G A Simple Mesh Generator in MATLAB. SIAM Rev (2004) 46:329–45. doi:10.1137/S0036144503429121
35. Greengard L, Lee J-Y Accelerating the Nonuniform Fast Fourier Transform. SIAM Rev (2004) 46:443–54. doi:10.1137/S003614450343200X
36. Beylkin G On the Fast Fourier Transform of Functions with Singularities. Appl Comput Harmonic Anal (1995) 2:363–81. doi:10.1006/acha.1995.1026
37. Peyret R Spectral Methods for Incompressible Viscous Flow. New York: Springer (2002). doi:10.1007/978-1-4757-6557-1 Spectral Methods for Incompressible Viscous Flow
Keywords: cytoplasm, biomechanics, blebs, poroelasticity, fluid-structure interaction
Citation: Strychalski W (2021) 3D Computational Modeling of Bleb Initiation Dynamics. Front. Phys. 9:775465. doi: 10.3389/fphy.2021.775465
Received: 14 September 2021; Accepted: 25 October 2021;
Published: 24 November 2021.
Edited by:
Yuan Lin, The University of Hong Kong, Hong Kong SAR, ChinaReviewed by:
Chao Fang, The University of Hong Kong, Hong Kong SAR, ChinaThomas E. Woolley, Cardiff University, United Kingdom
Copyright © 2021 Strychalski. This is an open-access article distributed under the terms of the Creative Commons Attribution License (CC BY). The use, distribution or reproduction in other forums is permitted, provided the original author(s) and the copyright owner(s) are credited and that the original publication in this journal is cited, in accordance with accepted academic practice. No use, distribution or reproduction is permitted which does not comply with these terms.
*Correspondence: Wanda Strychalski, d2lzNkBjYXNlLmVkdQ==
 Wanda Strychalski