- 1Department of Physics, Capital Normal University, Beijing, China
- 2Beijing Key Lab for Metamaterials and Devices, Key Laboratory of Terahertz Optoelectronics Ministry of Education, Beijing, China
- 3Nanophotonics Research Center, Shenzhen Key Laboratory of Micro-Scale Optical Information Technology, Shenzhen University, Shenzhen, China
- 4Songshan Lake Materials Laboratory, Dongguan, China
The spatiotemporal distribution of terahertz (THz) radiation from plasma has been demonstrated with the technology of THz focal-plane imaging. It has been found that the spatiotemporal distribution will vary with the frequency, as well as the length of plasma. A doughnut-shaped distribution appears in the lower frequency range, while the bell-shaped distribution corresponds to the higher frequency range. For plasmas with different lengths, their generated THz images in the time domain are similar, the THz images in the frequency domain as well. The spatiotemporal distributions are simulated with the off-axis-phase matching theory. All the findings will renew the understanding of the THz generation from plasma induced by two-color pulses.
Introduction
Terahertz (THz) wave generated from plasma has been proven to be a valuable tool in the field of nonlinear spectroscopy, imaging, and remote sensing [1–3]. The scheme of THz radiation from plasma induced by two-color laser pulses [4–7] has attracted more attention, and became popular owing to the emitted THz wave with broad spectrum and high intensity, as well as the good quality of polarization. With the widely application of THz radiation from two-color-induced plasma, its spatial characterization is desired. Many efforts have been put on this by using incoherent or coherent methods. The THz spatial distribution was deduced to be the shape of bell [8, 9] by raster scanning with the pyroelectric detectors or doughnut-shape [10] by raster scanning with Michelson interferometer; With a THz camera the transverse intensity of THz wave was captured and 3D-reconstructed to be the dumbbell shape [11]. There is also reported work contributing the conical hollow of THz distribution into the photo-induced carriers in the silicon wafer [12], which was used to filter the THz waves in the experiment. However, all these results seem incomplete for the comprehensive spatial characterization of THz waves. The influence of single-color plasma channel length on an angular THz radiation distribution was studied [13], yet its THz emission mechanism differs significantly from that of the two-color scheme. To fully understand the THz emission from two-color-induced plasma, it is necessary to characterize the spatiotemporal distribution of THz wave generated from plasma induced by two-color pulses.
In this work, the spatiotemporal distribution of THz wave radiated from plasma has been measured by using the technology of THz focal-plane imaging. For the plasma with unchanged length, THz spatial images in the time domain and frequency domain are presented, as well as their evolution. For plasmas with different lengths, the similarity and difference of the THz spatiotemporal distribution are also demonstrated. The experimental results are in accord with their simulations. These results are helpful in re-understanding the mechanism of the THz generation from plasma.
Experimental and Simulation Results
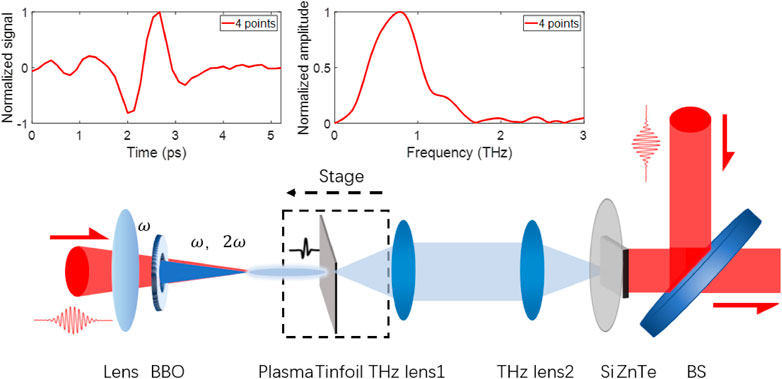
In the experiment, the technology of THz focal-plane imaging is used to obtain the spatiotemporal distribution of THz waves radiated from plasma induced by two-color pulses. The experimental setup is illustrated in Figure 1. A laser amplifier provides laser pulses with the central wavelength of 800 nm, repetition frequency of 1 kHz and pulse width of 35 fs. The femtosecond pulses are divided into two beams by a beam splitter (BS), one is used as the pump pulse and the other one is used as the probe pulse. The average pump and probe power are 700 and 13 mW, respectively. The pump pulse is focused by a lens with the focal length of 200 mm. With this lens, a relative uniform plasma about 7 mm is formed. There is a Barium Boron Oxide (BBO) crystal between the lens and its geometric focus. When the fundamental waves (800 nm) of femtosecond laser pass through the BBO crystal, their second harmonic waves generate. Both the fundamental (

FIGURE 1. Schematic diagram of experimental setup. BS: Beam Splitter, BBO: Barium Boron Oxide Crystal. The dashed part is used to measure the spatiotemporal distribution of THz waves generated by plasma with different lengths. The insets are the THz time-domain signal and its Fourier-transformed spectrum, obtained by summing the values of four pixels in the center part of the CCD.
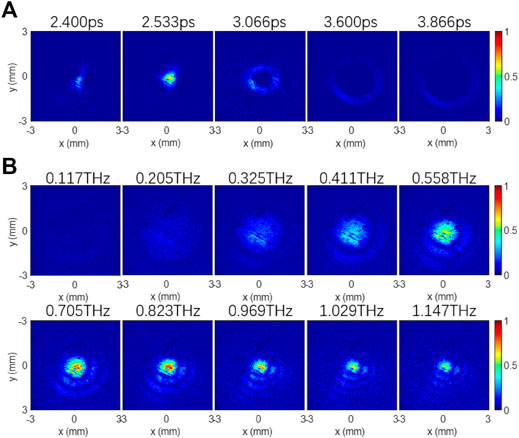
In the experiment, by selecting proper experimental parameters, such like the crystal axis angle of the BBO crystal and the distance to the geometric focus of the focusing lens, the generated THz signal was optimized. After that, the THz spatiotemporal distribution is measured and shown in Figure 2A. At the initial time of the THz pulse t ≤ 2.533 ps, the spatial intensity distribution obtained by the above system is mainly concentrated near the center of the optical axis, like a solid bright spot. Thereafter, it diffuses when t ≥ 3.066 ps, and the THz light spot diffuses into a hollow ring with the radius gradually increasing. In the process of diffusion, the amplitude of THz wave in the ring region decreases gradually due to the effect of divergence until the overall signal disappears. These THz temporal images were Fourier-transformed to obtain their field distributions at different frequencies. The results are shown in Figure 2B. For clearly, all images are normalized by the maximum value of the THz signal. It is clear that the THz field appears as a weak annular profile in the lower frequency range, while it appears in the region near the optical axis in the higher frequency range. With the frequency increasing, the annular side lobes gradually appear around the solid spot. Compared with that of the central spot the intensity of the annular side lobes becomes more and more obvious. It indicates that the radiation angle is corresponding to the frequency component of the radiated THz wave, which is consistent with the result reported in Ref. [15]. As illustrated in Figure 2, it seems that there are some nonuniform intensity distributions in these THz images, which was caused by some defects in the ZnTe crystal.
As shown in Figure 2B, with the frequency increasing, the spatial distribution of THz wave changes from the shape of doughnut to bell mixed with dark ring lobes. Currently, there are many theoretical models used to describe THz generation from ionized plasma, including the model of pondermotive, photocurrent, four-wave mixing and off-axis phase matching [7, 16–18]. Considering this experimental system, we adopt an off-axis phase matching model for simulation, in which the parameters similar to that in the experiment was selected. Different from the work in Ref. [16], the near-field profile of THz emission from the plasma has been calculated. For the case of plasma length shorter than the dephasing length, the near-filed integration and their initial phases are also considered in the simulation. The simulation results are shown in Figure 3A. In the lower frequency range,

FIGURE 3. Simulation and experimental results of THz spatial distribution. (A) Simulation results by the off-axis phase matching model. (B) Unnormalized experimental (up) and simulation (bottom) images at 0.117 THz. (C) THz amplitude distributions at lower frequencies (left) and higher frequencies (right).
In addition, images of THz radiation from plasma with different lengths are also obtained. As shown in the dashed part of Figure 1, a tinfoil is placed slightly away from the end of the plasma. Moving the tinfoil to make it approach the plasma end, until the tinfoil is penetrated by the plasma. Since the diameter of the hole on the tinfoil is similar to that of the plasma, we believe that the THz wave radiated from the plasma at the left side of the foil can be blocked and only the THz wave radiated from the plasma on the right side can be detected. By moving the foil to the left, the electric field

FIGURE 4. Experimental results of THz waves radiated from plasmas with different lengths. THz images in the time domain (A) and frequency domain (B).
It is known that the above THz electric fields
Where
Conclusion
The THz spatiotemporal distribution of THz radiation from plasma has been measured by the technology of THz focal-plane imaging. With the off-axis phase matching model, we obtained their simulation results, and the simulation results are in good agreement with the experimental ones. THz spatial distributions are doughnut-shape at low frequencies and bell-shape at high frequencies. The spatiotemporal distribution characteristics of THz wave from plasmas with different lengths are similar, but their intensities depend on the length of the plasma seriously. With the THz images radiated from plasmas of different lengths, the electric density inside of the plasma has been revealed.
Data Availability Statement
The original contributions presented in the study are included in the article/Supplementary Material, further inquiries can be directed to the corresponding author.
Author Contributions
EW, YW, and WS contributed to experiment and simulation. WS designed the study. XW, SF, PH, JY, and YZ performed the theoretical analysis. All authors contributed to article revision, read, and approved the submitted version.
Funding
The National Natural Science Foundation of China (61735002, 11774243, 11774246, 11474206, 11404224); Youth Innovative Re-search Team of Capital Normal University (19530050146, 18530500155, 20530290053); Connotative Development Foundation for Distinguished Young Talents in Capital Normal University (2055105); Capacity Building for Science and Technology Innovation–Fundamental Scientific Research Funds (20530290072, 19530050170,19530050180,18530500186, 025185305000/142, 025185305000/142).
Conflict of Interest
The authors declare that the research was conducted in the absence of any commercial or financial relationships that could be construed as a potential conflict of interest.
Publisher’s Note
All claims expressed in this article are solely those of the authors and do not necessarily represent those of their affiliated organizations, or those of the publisher, the editors and the reviewers. Any product that may be evaluated in this article, or claim that may be made by its manufacturer, is not guaranteed or endorsed by the publisher.
Reference
1. Kampfrath T, Sell A, Klatt G, Pashkin A, Mährlein S, Dekorsy T. Coherent Terahertz Control of Antiferromagnetic Spin Waves. Nat Photon (2011) 5:31–4. doi:10.1038/nphoton.2010.259
2. Ulbricht R, Hendry E, Shan J, Heinz TF, Bonn M. Carrier Dynamics in Semiconductors Studied with Time-Resolved Terahertz Spectroscopy. Rev Mod Phys (2011) 83:543–86. doi:10.1103/revmodphys.83.543
3. Liu J, Dai J, Chin SL, Zhang X-C. Broadband Terahertz Wave Remote Sensing Using Coherent Manipulation of Fluorescence from Asymmetrically Ionized Gases. Nat Photon (2010) 4:627–31. doi:10.1038/nphoton.2010.165
4. Zhang XC, Shkurinov A, Zhang Y. Extreme Terahertz Science. Nat Photon (2017) 11:16–8. doi:10.1038/nphoton.2016.249
5. Clerici M, Peccianti M, Schmidt BE, Caspani L, Shalaby M, Giguère M. Wavelength Scaling of Terahertz Generation by Gas Ionization. Phys Rev Lett (2013) 110:253901. doi:10.1103/physrevlett.110.253901
6. Siegel PH. Terahertz Technology in Biology and Medicine. IEEE Trans Microwave Theor Techn. (2004) 52(10):2438–47. doi:10.1109/tmtt.2004.835916
7. Cook DJ, Hochstrasser RM. Intense Terahertz Pulses by Four-Wave Rectification in Air. Opt Lett (2000) 25(16):1210–2. doi:10.1364/ol.25.001210
8. Akhmedzhanov RA, Ilyakov IE, Mironov VA, Suvorov EV, Fadeev DA, Shishkin BV. Generation of Terahertz Radiation by the Optical Breakdown Induced by a Bichromatic Laser Pulse. J Exp Theor Phys (2009) 109(3):370–8. doi:10.1134/s1063776109090027
9. Zhong H, Karpowicz N, Zhang X-C. Terahertz Emission Profile from Laser-Induced Air Plasma. Appl Phys Lett (2006) 88(26):261103. doi:10.1063/1.2216025
10. Andreeva VA, Kosareva OG, Panov NA, Shipilo DE, Solyankin PM, Esaulkov MN. Ultrabroad Terahertz Spectrum Generation from an Air-Based Filament Plasma. Phys Rev Lett (2016) 116(6):063902–5. doi:10.1103/physrevlett.116.063902
11. Klarskov P, Strikwerda AC, Iwaszczuk K, Jepsen PU. Experimental Three-Dimensional Beam Profiling and Modeling of a Terahertz Beam Generated from a Two-Color Air Plasma. New J Phys (2013) 15(7):075012–3. doi:10.1088/1367-2630/15/7/075012
12. Sørensen C, Guiramand L, Degert J, Tondusson M, Skovsen E, Freysz E. Conical versus Gaussian Terahertz Emission from Two-Color Laser-Induced Air Plasma Filaments. Opt Lett (2020) 7(45):2132–5. doi:10.1364/OL.390112
13. Koribut AV, Rizaev GE, Mokrousova DV, Savinov SA, Reutov AA, Mityagin YA. Similarity of Angular Distribution for THz Radiation Emitted by Laser Filament Plasma Channels of Different Lengths. Opt Lett (2020) 45(45):4009–11. doi:10.1364/OL.394377
14. Wang X, Cui Y, Sun W, Ye J, Zhang Y. Terahertz Real-Time Imaging with Balanced Electro-Optic Detection. Opt Commun (2010) 283(23):4626–32. doi:10.1016/j.optcom.2010.07.010
15. Zhao J, Chu W, Wang Z, Peng Y, Gong C, Lin L. Strong Spatial Confinement of Terahertz Wave inside Femtosecond Laser Filament. ACS Photon (2016) 3(12):2338–43. doi:10.1021/acsphotonics.6b00512
16. You YS, Oh TI, Kim KY. Off-axis Phase-Matched Terahertz Emission from Two-Color Laser-Induced Plasma Filaments. Phys Rev Lett (2012) 109(18):183902–5. doi:10.1103/physrevlett.109.183902
17. Borodin AV, Panov NA, Kosareva OG, Andreeva VA, Esaulkov MN, Makarov VA. Transformation of Terahertz Spectra Emitted from Dual-Frequency Femtosecond Pulse Interaction in Gases. Opt Lett (2013) 38(38):1906–8. doi:10.1364/OL.38.001906
18. Béjot P, Kasparian J, Wolf J-P. Dual-color Co-filamentation in Argon. Opt Express (2008) 16(18):14115–27. doi:10.1364/oe.16.014115
19. Wang T-J, Ju J, Wei Y, Li R, Xu Z, Chin SL. Longitudinally Resolved Measurement of Plasma Density along Femtosecond Laser Filament via Terahertz Spectroscopy. Appl Phys Lett (2014) 105:051101. doi:10.1063/1.4892424
20. Kim K-Y, Glownia JH, Taylor AJ, Rodriguez G. Terahertz Emission from Ultrafast Ionizing Air in Symmetry-Broken Laser fields. Opt Express (2007) 15(8):4577–84. doi:10.1364/oe.15.004577
21. Gaarde MB, Couairon A. Intensity Spikes in Laser Filamentation: Diagnostics and Application. Phys Rev Lett (2009) 103:043901. doi:10.1103/PhysRevLett.103.043901
22. Chen Y, Théberge F, Kosareva O, Panov N, Kandidov VP, Chin SL. Evolution and Termination of a Femtosecond Laser Filament in Air. Opt Lett (2007) 32(24):3477–9. doi:10.1364/ol.32.003477
Keywords: THz focal plane imaging, plasma, off-axis-phase matching, spatiotemporal distribution, THz radiation
Citation: Wang E, Wang Y, Sun W, Wang X, Feng S, Han P, Ye J and Zhang Y (2021) Spatiotemporal Distribution Characterization for Terahertz Waves Generated From Plasma Induced by Two-Color Pulses. Front. Phys. 9:768186. doi: 10.3389/fphy.2021.768186
Received: 31 August 2021; Accepted: 20 September 2021;
Published: 28 October 2021.
Edited by:
Yingxin Wang, Tsinghua University, ChinaReviewed by:
Jiayu Zhao, University of Shanghai for Science and Technology, ChinaDong-Wen Zhang, National University of Defense Technology, China
Copyright © 2021 Wang, Wang, Sun, Wang, Feng, Han, Ye and Zhang. This is an open-access article distributed under the terms of the Creative Commons Attribution License (CC BY). The use, distribution or reproduction in other forums is permitted, provided the original author(s) and the copyright owner(s) are credited and that the original publication in this journal is cited, in accordance with accepted academic practice. No use, distribution or reproduction is permitted which does not comply with these terms.
*Correspondence: Wenfeng Sun, d2ZzdW5AY251LmVkdS5jbg==
 Erli Wang1,2
 Yulong Wang
 Wenfeng Sun
 Shengfei Feng
 Peng Han
 Yan Zhang
