 Xiaohu Zhang
 Songyuan Liu
 Gan Li
 Xiaofei Wang4
- 1School of Civil Engineering, Guizhou University of Engineering Science, Bijie, China
- 2State Key Laboratory for Geomechanics and Deep Underground Engineering, Beijing, China
- 3Institute of Rock Mechanics, Ningbo University, Ningbo, China
- 4School of Conservancy and Civil Engineering, Inner Mongolia Agricultural University, Huhhot, China
Steel fibers were delivered into the numerical concrete specimens using a mixed congruence method. A coplanar projection method is proposed to solve the problem of discriminating the crossing among steel fibers. Numerical models were built for reactive powder concrete (RPC) cylindrical specimens with 1 and 2% steel fiber. Comparisons between the numerical model and actual specimen slices show that the modified method has a good simulation effect. An improved anchor cable unit was used to simulate the bond–slip behavior between the steel fiber and concrete; the drawing of a single steel fiber was simulated. Then, the uniaxial compression, triaxial compression, and three-point bending of RPC specimens with 1% steel fiber were simulated, reproducing the concrete cracking and steel fiber slipping behaviors of RPC specimens. The failure modes of the numerical RPC specimen under various mechanical tests are consistent with the experimental results, proving the practicability and accuracy of this established numerical model. This study provides a foundation for the numerical simulation of RPC properties.
Introduction
Reactive powder concrete (RPC) is a class of cement-based composite reinforced with steel fibers; RPC has a very low water-to-cement ratio and strong plasticity, first developed by [1]. Compared with high-strength concrete (HPC), RPC has higher strength (including compressive strength and tensile strength), durability, and environmental adaptability; RPC also has lower permeability. Therefore, RPC has broad application prospects in civil engineering [2–5].
In the previous two decades, many studies have been conducted on RPC, mainly focusing on the configuration, mechanical properties, component performance and design, and high-temperature resistance. The configuration of RPC is mainly achieved by improving the RPC homogeneity [6–8], increasing the matrix density [9], and improving the microstructure [10] and steel fiber content to improve the material properties of RPC [11, 12]. For the mechanical properties of RPC, previous studies mainly focused on the material size effect and mechanical performance index [2, 13, 14] (compressive strength, tensile strength, elastic modulus, Poisson ratio, dynamic characteristics, and stress–strain relationship). For component performance and design application of RPC, previous studies mainly focused on the anchorage performance of steel bars [15, 16], bending and shear performance of RPC beams [17], and compression performance of steel tube RPC columns [18, 19]. Studies on high-temperature resistance of RPC mainly focused on resistance to chloride ion penetration, resistance to carbonization [20], resistance to freeze–thaw [21], and corrosion resistance [22].
In terms of numerical simulation, many studies have been conducted on ordinary concrete [23–26], and few studies explored the properties of the steel fiber RPC material due to the difficulty of delivery of the steel fiber, discriminating the mutual position of the steel fiber, and simulation of bond–slip behavior between the steel fiber and concrete [27] uses a three-dimensional meshing algorithm to generate a finite element analysis model. Bonding and sliding contact algorithms were used to simulate the interaction between the steel fibers and the matrix. The mechanical behavior of the SFRC material was simulated, and good agreement with the test data was observed. The authors in ref [28] proposed to use a outsourced hexahedron for discriminating the crossing among steel fibers, but the specific separation method is not given. The authors in ref [29] performed numerical simulations of steel fiber concrete beams by ANSYS software. It was found that the addition of steel fibers had a positive effect on reducing the formation of cracks and controlling the deformation of the beams [30]. The study in ref [31] presents a new numerical model based on the use of coupled finite elements to simulate the behavior of steel fiber–reinforced concrete using an implicit–explicit integration scheme. Comparison with experimental results shows that the numerical simulation method is very promising. Because RPC does not contain coarse aggregates, the diameter of the steel fiber is generally about 0.2 mm, the length is about 13 mm, and the volume of a single steel fiber is about 0.4 mm3, which is about 2 parts per million of the standard concrete specimen (φ 50 mm × 100 mm). If steel fibers with a volume content of 3%, that is, 14,726 steel fibers, are incorporated into standard concrete specimens, it is necessary to consider the positional relationship between steel fibers when the number of steel fibers is large. Thus, it not only satisfies the condition of no intersection between steel fibers but also overcomes the problem of delivery efficiency of steel fibers in a fixed space. In addition, if the contact method is used to simulate the bonding force between the steel fiber and concrete, they are meshed separately, and the final number of grids may reach millions, which is also difficult to achieve using general computers. Therefore, other methods must be used to simulate the bonding force.
To overcome the problem of steel fiber delivery so that the numerical simulation of a steel fiber RPC can be carried out smoothly, a mixed congruence method is proposed to achieve the delivery of the steel fiber into a fixed space using Matlab software, and the coplanar projection method was used to solve the problem of discriminating the crossing of steel fibers during delivery. The slice of the numerical model was compared with that of actual RPC specimens to prove that the steel fiber delivery method can truly simulate the mesostructural characteristics of RPC. Moreover, the uniaxial compression test, triaxial compression test, and three-point bending test of RPC specimens were simulated. The cracking of concrete and slipping of the steel fiber were evaluated, and finally, the failure modes of RPC specimens with 1% steel fiber between the numerical and experimental results were compared. The effectiveness and feasibility of the proposed method for simulating RPC are shown.
Steel Fiber Delivery Method
Principle of Steel Fiber Delivery
In this study, we use the mixed congruence method for random generation of spatial locations of steel fibers, which is one of the methods for generating random numbers by congruence operation, and the commonly used congruence methods also include the additive congruence method, the multiplicative congruence method, and the division congruence method. The mixed congruence method was proposed by Lehmer in 1951, which is a method of generating uniform random numbers by making a recursive formula using the congruence formula of a constant and the product of the generated pseudo-random numbers. Compared with the other methods mentioned before, the mixed congruence method has the advantages of speed, memory saving, long cycle time, and good statistical properties.
The geometry shows that the spatial position of a steel fiber can be determined from the coordinates
In general, the random function method
Supposing that the specimen has a diameter
The steps of delivering steel fibers are as follows:
Step 1: Use a random function to generate a steel fiber in the calculation area and ensure that the entire steel fiber is in the calculation domain. In this method, one end of the steel fiber is randomly generated inside the area, and the other end of the steel fiber is determined from the randomly generated steel fiber direction angle
Step 2: The rotation angle
Step 3: Randomly generate a translation vector
Step 4: Perform the iteration of steel fiber delivery. Repeat the second and third steps, and continuously generate new steel fibers until the targeted number N is reached.
Method for Discriminating the Mutual Position of Steel Fibers
Assuming that the end coordinates of two steel fibers are
It is difficult to discriminate the positional relationship between two steel fibers in a three-dimensional (3D) space. However, if both steel fibers are projected into a plane parallel to them, the discrimination in 3D space can be converted into a two-dimensional (2D) plane (Figure 1). Assuming that this plane passes through point A
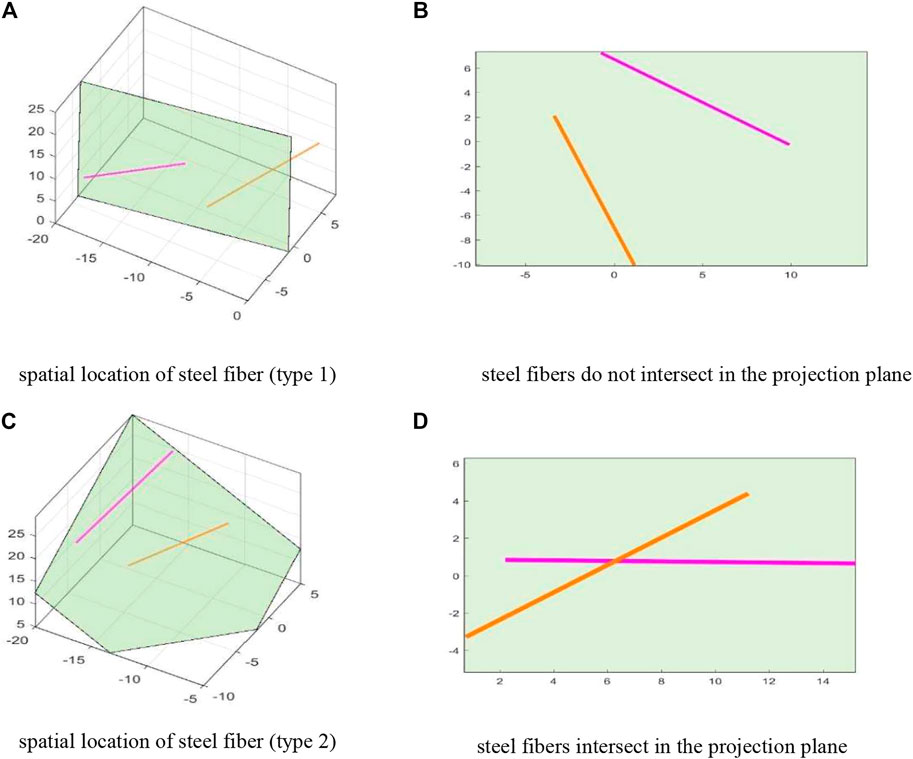
FIGURE 1. Discriminating the mutual position of steel fibers. (A) Spatial location of the steel fiber (type 1). (B) Steel fibers do not intersect in the projection plane. (C) Spatial location of the steel fiber (type 2). (D) Steel fibers intersect in the projection plane.
In the previous formula,
Because two steel fibers should be judged whether they are parallel to the plane, according to the property of parallel projection, the shape of the steel fiber on the projection surface is rectangular. Its length is
At this time, if the distance between the two steel fibers is greater than 2d, no intersection is present between the two steel fibers; otherwise, the two steel fibers intersect each other. If the two rectangles have no intersection, the two steel fibers do not intersect in space. Therefore, this method can solve the problem of discriminating whether the spatial steel fibers cross and overlap.
Distribution Comparisons of Steel Fibers in Numerical and Actual Slices
Figure 2A shows the delivery result of the steel fiber when its content is 1%. Figure 3A shows the delivery result of the steel fiber when its content is 2%. The aforementioned placement method can also be used for model construction for steel fiber volume content of 3% and above. Experimentally, the higher the volume content of steel fibers, the longer the delivery time required. In this section, only the results for the 1 and 2% contents are presented. The steel fiber randomly fills the interior of the calculated cylinder, and its distribution is relatively uniform. As shown in Figure 2A, the distances of the three sliced positions A, B, and C from the bottom of the specimen were 80, 50, and 20 mm, respectively. All specimens undergoing slicing were intact and untested specimens. Before cutting, the specimen positions were calibrated so as to ensure that the spatial orientation of the cut slices would not change.
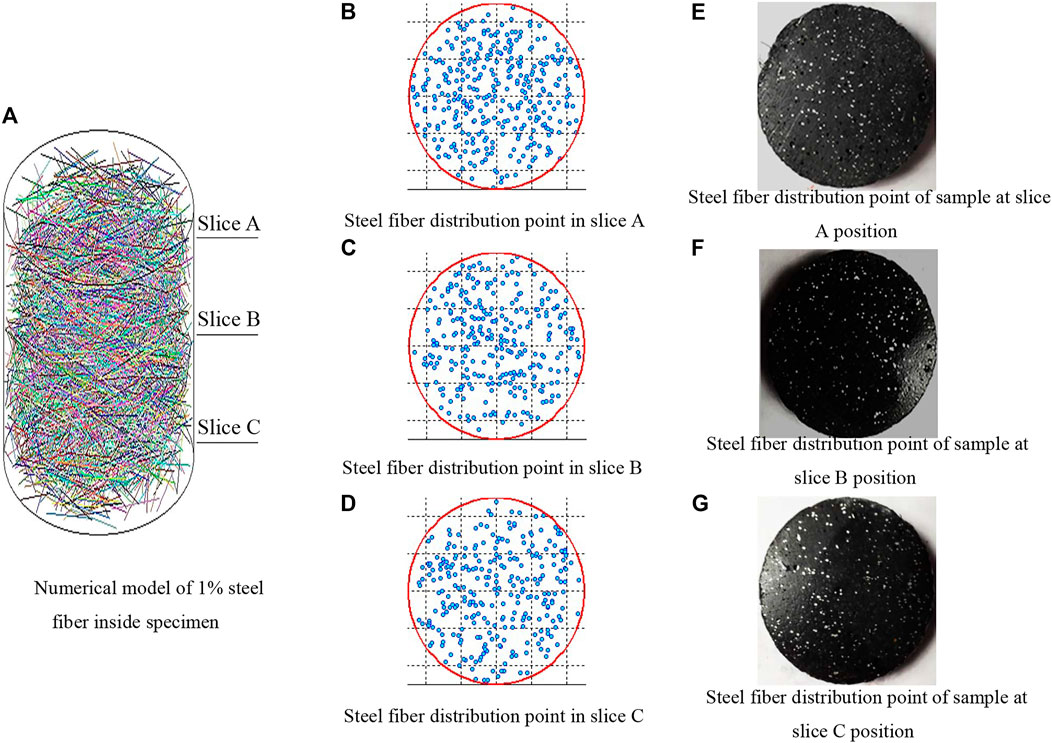
FIGURE 2. Slice comparisons between numerical and experimental RPC specimens with 1% steel fiber. (A) Numerical model of 1% steel fiber inside the specimen. (B) Steel fiber distribution point in slice A. (C) Steel fiber distribution point in slice B. (D) Steel fiber distribution point in slice C. (E) Steel fiber distribution point of sample at slice A position. (F) Steel fiber distribution point of sample at slice B position. (G) Steel fiber distribution point of sample at slice C position.
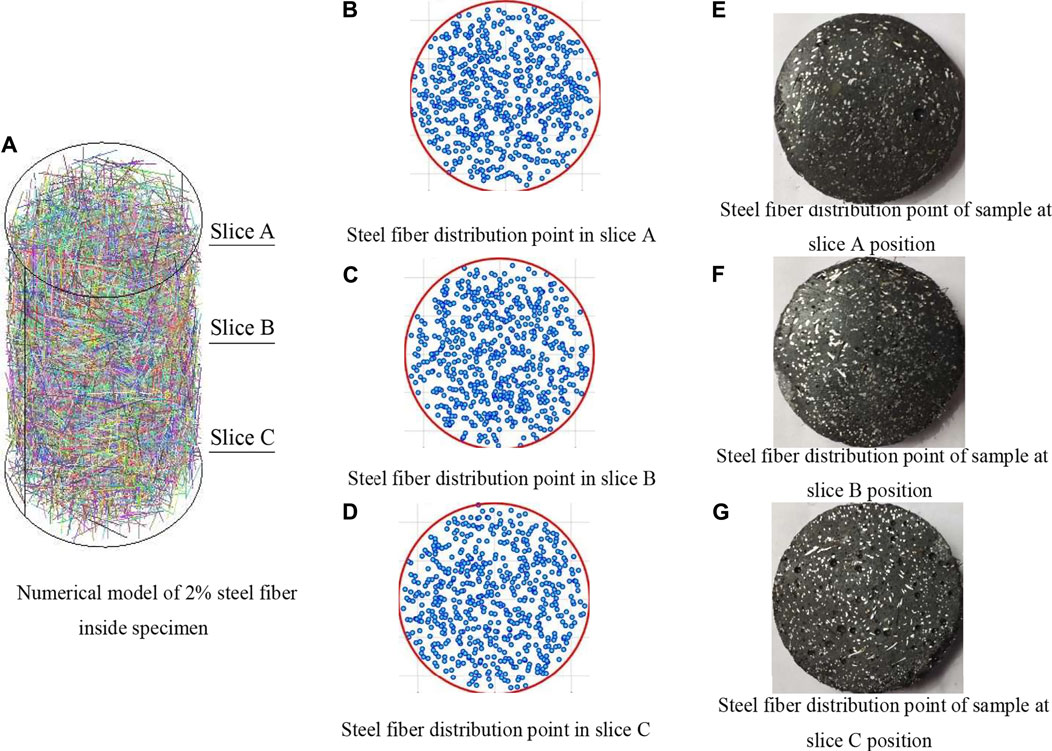
FIGURE 3. Slice comparisons between numerical and experimental RPC specimens with 2% steel fiber. (A) Numerical model of 2% steel fiber inside specimen. (B) Steel fiber distribution point in slice A. (C) Steel fiber distribution point in slice B. (D) Steel fiber distribution point in slice C. (E) Steel fiber distribution point of sample at slice A position. (F) Steel fiber distribution point of sample at slice B position. (G) Steel fiber distribution point of sample at slice C position.
Figures 2B–G and Figures 3B–G show that the distributions of steel fiber points in the upper (A), middle (B), and lower (C) slices are also random and uniform, also close to the actual slice of the RPC specimen. This proves that the proposed method of steel fiber delivery better reflects the random distribution characteristics of the real steel fiber inside a concrete specimen and has good application potential for establishing an RPC numerical model.
Establishment of Reactive Powder Concrete Numerical Model
Selection of Concrete Model
In the numerical simulation of the RPC specimen, the RPC matrix is a concrete material, and the constitutive model selected for concrete materials is the Mohr–Coulomb model. During calculation, the concrete materials are divided into 4,859 small tetrahedrons, with a side length of 7 mm; thus, the contact model between the blocks in the model is the Coulomb slip model. The input parameters of these models include density, bulk modulus, shear modulus, internal friction angle, cohesion, dilatancy angle, and tensile strength, and these parameters are obtained through experiments, as shown in Table 1.

TABLE 1. Mechanical parameters of Mohr–Coulomb constitutive model.
Selection of Steel Fiber Material Model
To consider the friction bond force between the steel fiber and concrete, the model of the steel fiber used the anchor cable model in 3DEC software (Figure 4). The anchor cable model considers both the axial force deformation of the anchor cable itself and the shear slip between the anchor cable and the contact material, which is more consistent with the force characteristics between steel fibers and concrete, where the shear slip characterizes the frictional slip of the steel fibers in the concrete matrix and the axial force characterizes the mechanical process of the steel fibers being stretched. In the model, the steel fiber was discretized into several elements, and the mass of each element was concentrated on the nodes at both ends. The axial deformation of the steel fiber can be achieved by expansion and contraction between nodes. The contact between the steel fiber and the surrounding concrete is viscous. Therefore, the concrete in the contacting part can withstand shear and slip. This mechanical process can be achieved by a viscoelastic connection of joints between the steel fiber and concrete. The mechanical properties of the steel fiber are shown in Table 2. This model is based on the premise that the concrete should be meshed in advance; then, the steel fiber units are arranged on the concrete grid. This method not only overcomes the problems that cannot be solved by the finite element method but also achieves the simulation of frictional grip force.
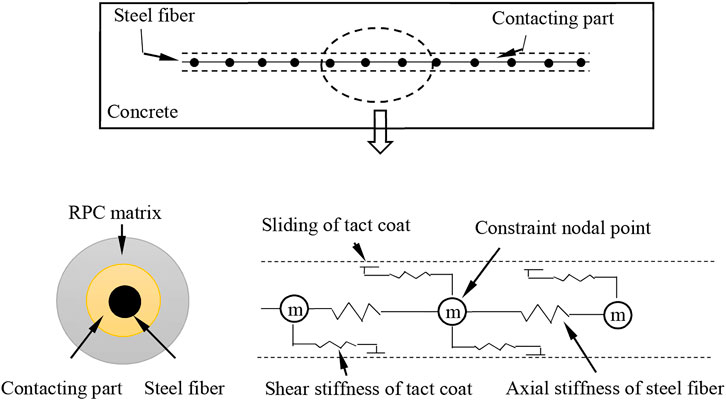
FIGURE 4. Schematic diagram of interaction between steel fiber and concrete (Itasca Consulting Group [32]).

TABLE 2. Mechanical properties of steel fiber.
Although the 3DEC5.2 model is used in this study to simulate and calculate the mechanical behavior of steel fiber–activated powder concrete, the model still has its shortcomings. First, the steel fiber is abstracted as an anchor cable model, which can basically consider the frictional slip and tensile processes, but it does not truly reflect the real action between the steel fiber and the concrete matrix. In addition, the steel fiber concrete specimens are macroscopically continuous, and the simulations in this study use the 3DEC5.2 model to perform calculations, which can only simulate the slip action between the steel fiber and the concrete matrix from a macroscopic point of view, while the fine mechanical processes are not realized.
3DEC5.2 software is a three-dimensional discrete unit method software exited by Itasca, United States, which uses a convex hull to describe the spatial morphology of continuous object elements in a medium. The biggest advantage of this software is that it can simulate the process of slip, separation, and destruction among blocks and can visualize the dynamic destruction process of objects. This is the main reason for choosing 3DEC 5.2 in this study. The damage process of steel fiber concrete is difficult to be simulated by using the finite element method, and with the many advantages of this software, the calculation of slip, cracking, and damage process between the steel fiber and concrete can be better realized.
Drawing Process Simulation of Single Steel Fiber
To verify the applicability of steel fiber model and concrete model, Figure 5A shows the drawing simulation model of a single steel fiber. In the model, a displacement loading rate of 0.002 mm/s is applied to the upper end of the steel fiber, and the lower end face of the model is the displacement fixed boundary. Figure 5B shows the relationship between drawing force and displacement of the steel fiber. The numerical simulation curve is consistent with the experimental curve reported by [16], indicating that this model can be used to simulate the mechanical behavior between the steel fiber and concrete. Using the pull-out test, it can be determined that the critical shear force of steel fibers slipping in the concrete matrix is 75N, in addition to the test with steel fibers selected from Liaoning Anshan Hongchang Steel Fiber Factory, with a diameter of 0.22 mm, length of 13 mm, tensile strength of 2800 MPa, and modulus of elasticity of 210 GPa.
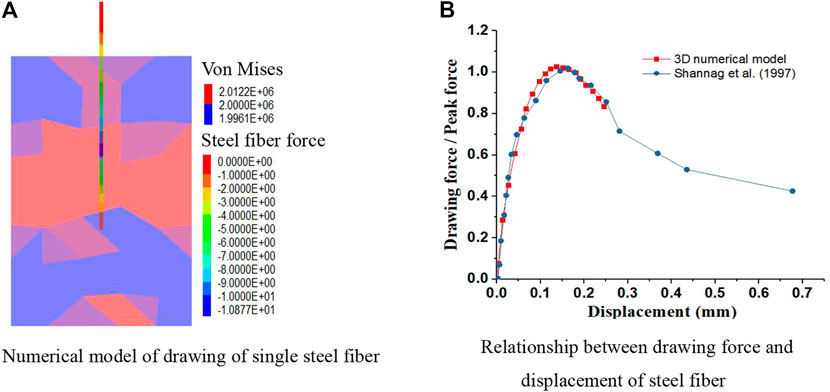
FIGURE 5. Drawing process simulation of single steel fiber. (A) Numerical model of drawing of single steel fiber. (B) Relationship between drawing force and displacement of steel fiber.
Numerical Simulation of Reactive Powder Concrete Specimens Under Various Mechanical Tests
Numerical Simulation of Reactive Powder Concrete Specimens Under Compression Tests
To compare with the experimental results, the simulations of standard RPC specimens with 1% steel fiber (φ = 50 mm, h = 100 mm) were carried out by performing uniaxial compression and triaxial compression tests using the displacement control method with a constant loading rate of 0.002 mm/s. In the model shown in Figure 6A, the upper platen is fixedly displaced and the lower platen moves upward at a constant speed of 0.002 mm/s after applying a given constant pressure in the circumferential direction of the specimen. To simulate the cracking characteristics of concrete, 4,859 tetrahedral blocks with a side length of 7 mm were generated in the model using 3DEC software (Figure 6A). Each block was meshed, and a total of 38,845 tetrahedral elements were obtained. In the numerical model, a total of 3,973 steel fibers were calculated according to the volume calculation. The spatial position of steel fibers was generated using the mixed congruence method. In the model, the steel fiber and tetrahedral block were connected and coupled together in addition to joints, thus simultaneously determining the mechanical behavior of RPC specimens. The concrete blocks can open and close, or slip, providing the crack and failure behaviors of concrete under compression. On the one hand, a steel fiber restricts the relative motion of the concrete block, increasing the maximum bearing capacity of the specimen; on the other hand, the relative motion between the steel fiber and concrete belongs to shear slip. The strength of the steel fiber is far higher than the strength of concrete. Therefore, when the shear force reaches the maximum friction between them, the steel fiber shows a relative slip with the concrete, and the steel fiber itself does not break. This effectively improves the plastic behavior of the specimen. As shown in Figure 6B, the simulation results of the stress–strain curves before reaching the peak agree with the experimental results for both uniaxial compression and triaxial compression. The simulation results after the peak are slightly different from the experimental results. After reaching the peak stress, the stress decrease rate of the numerical model is larger than that of the experiment. This is because the experimental process uses the servo control method, while the simulation process uses the displacement control method. Overall, the numerical simulation processes of steel fiber RPC specimens under the uniaxial and triaxial compression tests were successfully performed. The peak strength and peak strain of numerical results are relatively consistent with the experimental results.
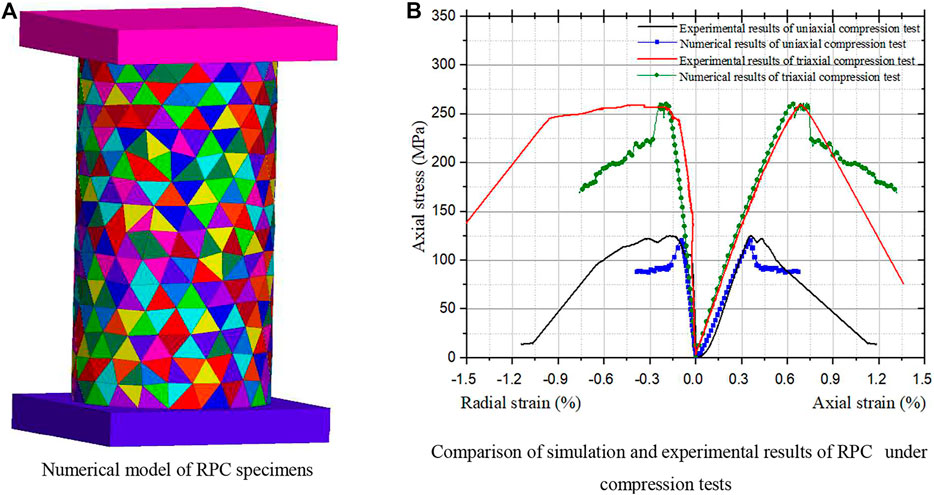
FIGURE 6. Compression simulation of RPC specimens. (A) Numerical model of RPC specimens. (B) Comparison of simulation and experimental results of RPC under compression tests.
Analysis of Uniaxial Compression Test
Figures 7A,B show the variation trends of shear force and shear displacement of the steel fiber. At the initial stage of loading (the key point A), the shear force between the steel fiber and concrete is small and distributed relatively cluttered. Only a few steel fibers reach the maximum shear stress and begin to slip, and most of the steel fibers do not slip. At the key point B, more steel fibers reach the maximum shear force, and they are in a local slip state. At the key point C, a 45° slip band appears in the middle of the specimen, starting from the upper left to the lower right (Figure 7B). The lower part of the specimen shows the expansion, also leading to the slippage of the steel fiber and cracking of concrete. At the key point D, with the increase in displacement, the lower right part and upper left part of the specimen show a relatively large displacement, forming a large shear bond. This indicates an obvious dislocation of concrete in this position. At the same time, the upper right part also shows stress concentration. Overall, a dominant failure mode of the 45° slip plane was fully formed at this stage. When reaching the key point E, the specimen showed shear movement along the 45° slip plane, and the specimen is also shortened and widened. The cracks perpendicular to the loading direction are widened, and the bearing capacity of the specimen decreased constantly. The failure mode is mainly shear failure, accompanied by splitting failure, consistent with the experimental results.
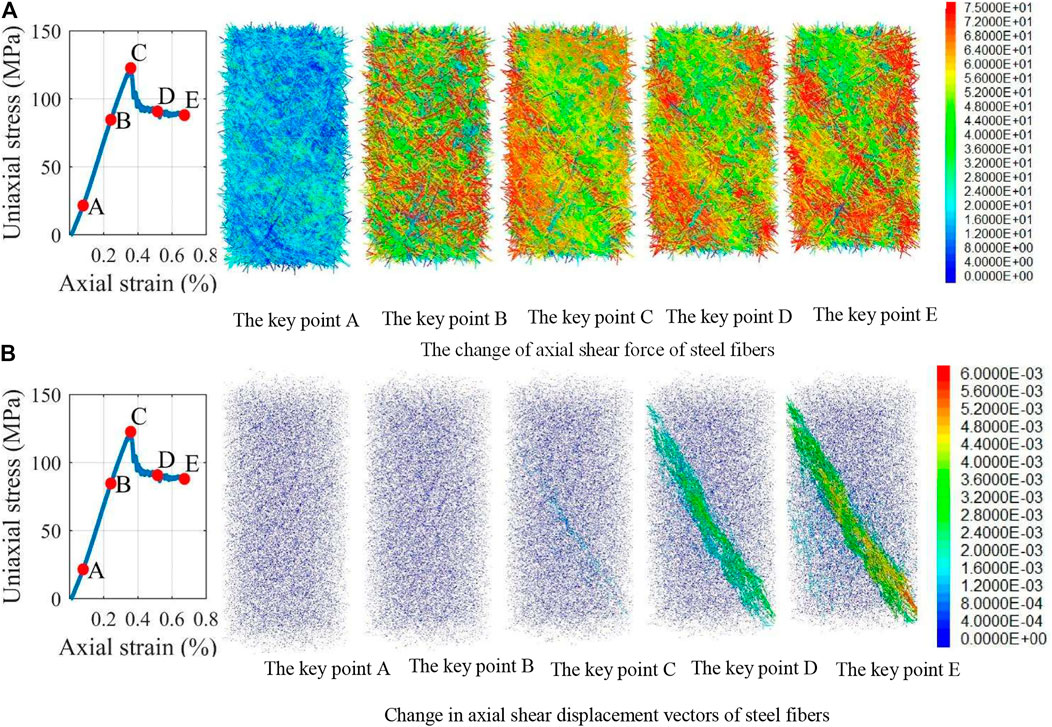
FIGURE 7. Failure of steel fiber under uniaxial compression test. (A) The change of axial shear force of steel fibers. (B) Change in axial shear displacement vectors of steel fibers.
Figures 8A–C show the equivalent stress change diagram, displacement change diagram, and shear slip of joint change diagram of concrete (i.e., RPC matrix). The change trend of equivalent stress of concrete is consistent with the change trend of axial shear force of steel fiber. At the key point A, the levels of equivalent stress and absolute displacement in the concrete are low, and the RPC specimen is in the compaction stage. The deformation of concrete is mainly elastic deformation, and no shear slip occurs. At the key point B, the concrete enters the initiation stage of the internal crack and the level of equivalent stress significantly increases. Combined with the axial shear force of the steel fiber, staggered slip was observed inside the concrete. Starting from the key point C, equivalent stress begins to show local concentration. Because the specimen reaches the peak stress, an equivalent stress band with 45° direction appears, and the displacement diagram in Figure 8B shows several vertical cracks in the specimen. At the same time, the sliding of the block also gradually occurs toward 45°. Figure 8C shows the large slip vector in 45° direction. At the key point D, due to the decrease in bearing capacity and the formation of a shear surface in the 45° direction, the equivalent stress level reduces slightly, and the crack in the middle of the specimen is expanded further. The specimen is divided into two pieces along the shear surface. The sliding of the block is further accelerated, and the failure area is extended along the shear surface toward the periphery. At the key point E, the specimen is further compressed, and the equivalent stress in the local extrusion part of the specimen is large. The other parts are relatively small. Owing to the existence of friction shear stress provided by the steel fiber, the specimen under 0.73% axial strain still maintains the axial bearing capacity of more than 70 MPa. The results show that the existence of a steel fiber can restrain the movement of concrete and effectively improve the strength and plastic performance of RPC.
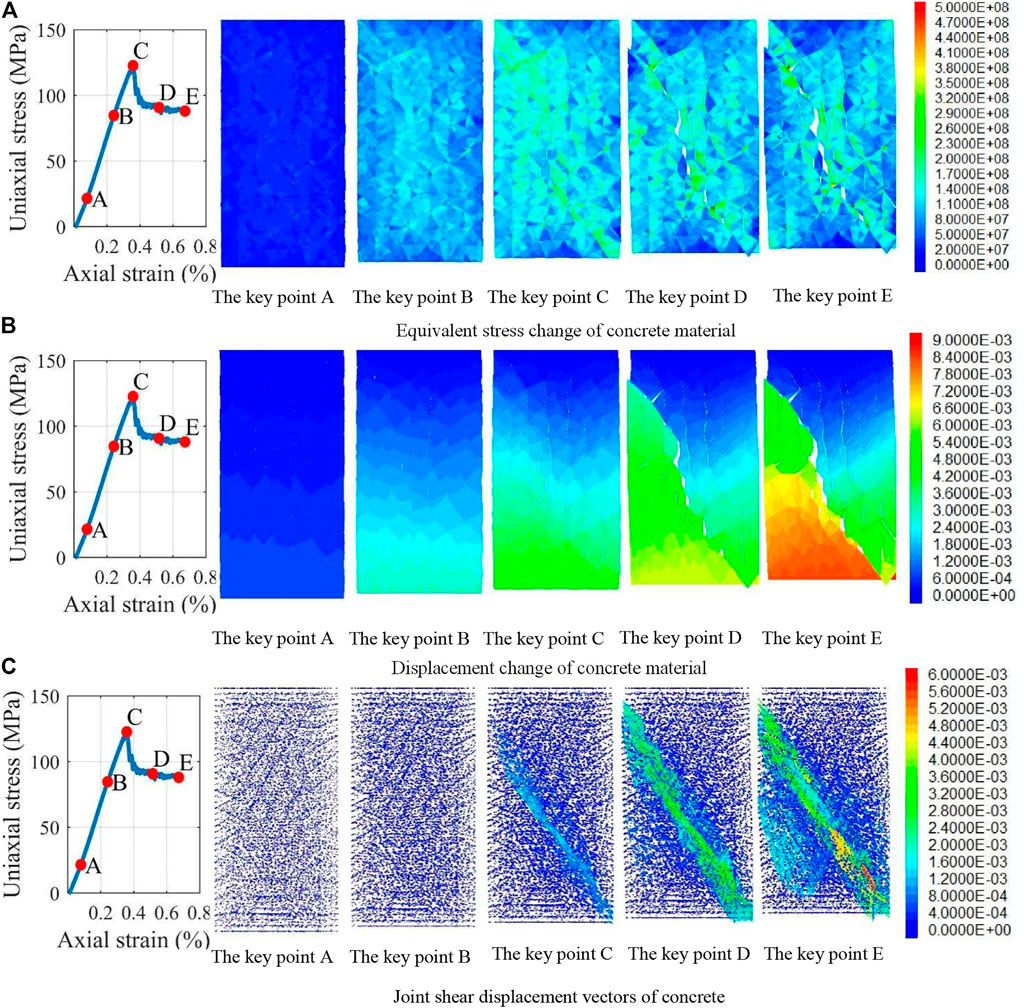
FIGURE 8. Failure characteristics of concrete under uniaxial compression. (A) Equivalent stress change of concrete material. (B) Displacement change of concrete material. (C) Joint shear displacement vectors of concrete.
Analysis of Triaxial Compression Test
Figures 9A,B show the variation trend of shear force and shear displacement of the steel fiber. The specimen at the initial loading stage is in the compaction state. The concrete and steel fiber have elastic deformation, while most of the steel fibers do not slip. At the key point B, with the axial compression and radial expansion of concrete, the steel fibers attached to concrete move with the concrete, and the steel fibers in radial distribution first reach the maximum shear force. Although they are in a local slip state, they also restrict the movement of concrete. Figure 9B shows that the slippage of the steel fiber is still small. At the key point C, the specimen reaches the peak stress. As the specimen is further compressed, more steel fibers reach the slip state, and a 40° slip band appears from the upper left 3/4 position to the lower right corner (Figure 9B). At the same time, swelling occurs in the middle and lower parts of the specimen. At the key point D, with further increase in compression, the 40° shear slip band is further connected, and the movement of the specimen changes from local slip of each point to a movement mode dominated by the shear slip band. The steel fibers have two 40° shear slip bands, indicating that the 40° shear slip surface of the specimen is completely formed. At the key point E, the specimen begins to clearly move on the 40° slip surface. The specimen is also significantly shortened and widened, and the bearing capacity of the specimen continues to decrease. The failure mode belongs to shear failure, consistent with the experimental results.
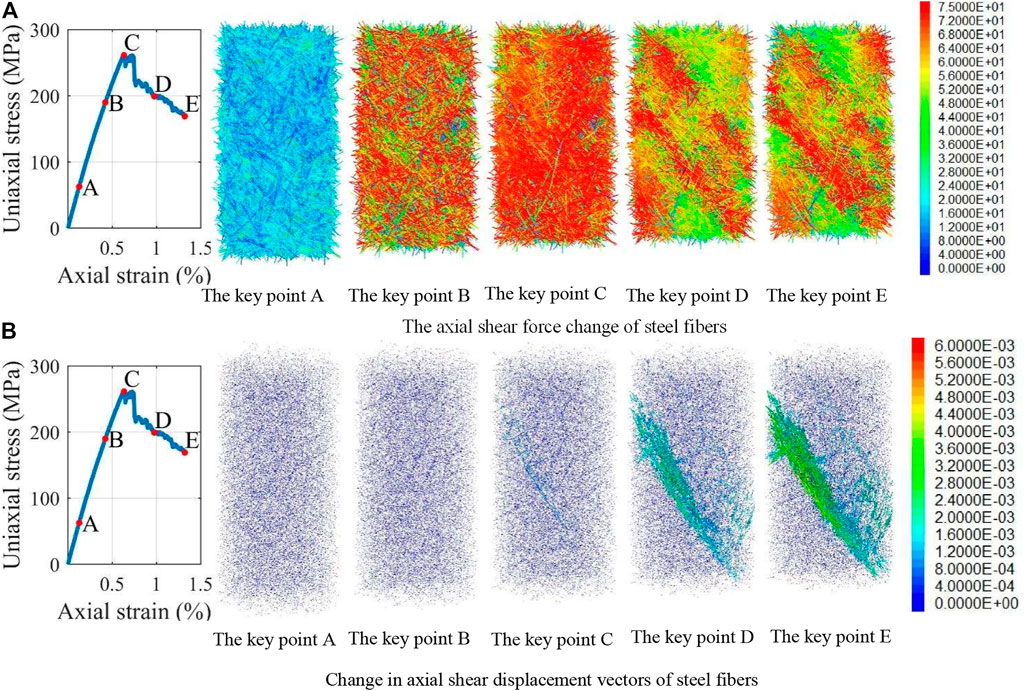
FIGURE 9. Failure of steel fiber under the triaxial compression test. (A) The axial shear force change of steel fibers. (B) Change in axial shear displacement vectors of steel fibers.
Figures 10A–C show the equivalent stress change diagram, displacement change diagram, and shear slip of joints change diagram of concrete (i.e., RPC matrix), respectively. At point A, the specimen is in the compaction state, and the levels of equivalent stress and absolute displacement in the specimen are low. Thus, no slip occurs. At point B, the concrete enters the initiation stage of internal cracks, and the equivalent stress level increases rapidly. At point C, the equivalent stress in the 40° direction increases locally to the maximum value due to local extrusion, and no obvious shear displacement of the specimen occurs at this time. At key point D, because of the decrease in bearing capacity force and the formation of 40° direction shear slip surface, the equivalent stress level in the 40° direction significantly decreases, and the specimen is divided into two parts by the shear slip surface. The slip of the block is further accelerated, and a low-stress band perpendicular to the 40° direction also appears in the lower part of the specimen. At the key point E, except for the local extrusion part of the specimen, the equivalent stress of other parts is small, and the specimen under 1.31% axial strain still has an axial bearing capacity of more than 160 MPa. The results indicate that under triaxial compression, the steel fibers restrict the movement of concrete and effectively improve the strength and plastic properties of RPC.
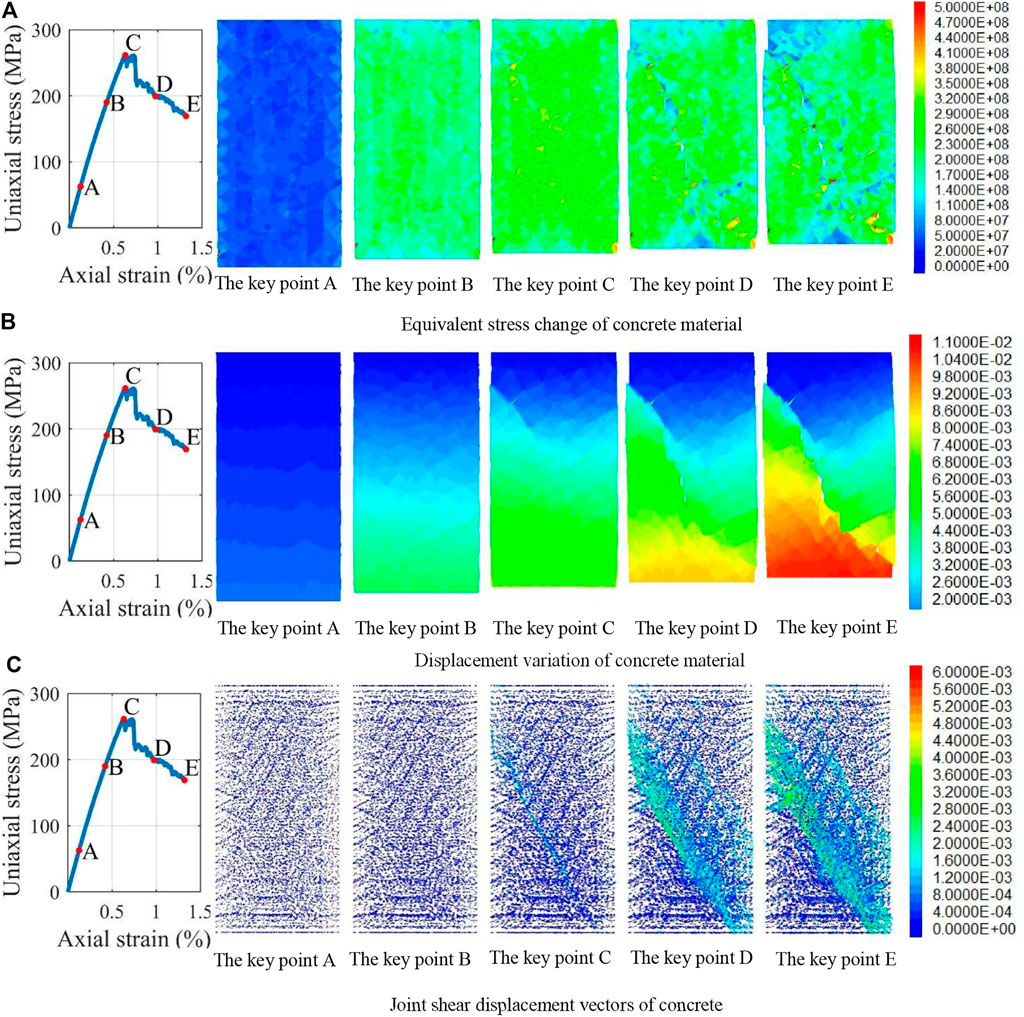
FIGURE 10. Failure of concrete under the triaxial compression test. (A) Equivalent stress change of concrete material. (B) Displacement variation of concrete material. (C) Joint shear displacement vectors of concrete.
Numerical Simulation of Reactive Powder Concrete Specimens Under Three-point Bending Test
A three-point bending numerical specimen of RPC with 1% steel fiber was built, as shown in Figure 11. The dimensions of the cube are 160 mm in length, 40 mm in width, and 40 mm in height, loaded in the same way as the experimental procedure. In the middle of the upper surface of the numerical specimen, a steel bar with a diameter of 10 mm is set as a displacement restraint, while two steel bars with a diameter of 10 mm, 20 mm from the end of the specimen, are set as loading supports on the lower surface of the numerical specimen. The loading method is displacement control, and the loading rate is 0.002 mm/s.
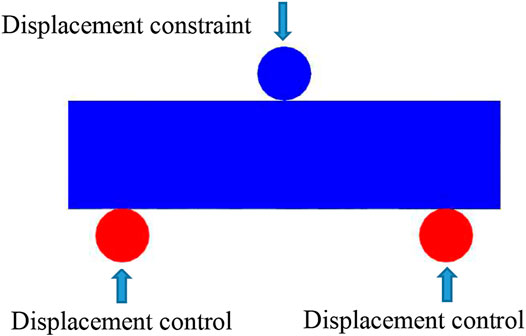
FIGURE 11. Loading diagram of three-point bending test.
Figures 12A,B show the variation trend of shear stress and shear displacement of the steel fiber under the three-point bending test. In the initial loading stage, owing to the increase in force on the lower surface of the specimen, the tensile force applied to the neutral axis of specimen increases gradually, and concrete and steel fiber begin to deform. Because the steel fibers have a higher strength than concrete, their deformation velocities are inconsistent, leading to a relative sliding between steel fibers and concrete, and the stress of this part is mainly the shear force. From the key point A to the key point B, the shear force increases gradually, and the shear band expands upward. At the key point C, the shear band expanded to the upper edge of the specimen, and the specimen is disconnected. With continuous loading, loading force shows a wavy decline mainly because although the concrete has cracked, a part of steel fibers connected with the concrete still provide the shear force. This prevents further cracking of concrete. Thus, the specimen still maintains a high residual strength for a period after cracking. Figure 12B shows that the shear displacement of steel fiber only occurs at the lower part of the middle part of the specimen at the initial loading stage, and the displacement is also small. With continuous loading, the displacement of the neutral axis is gradually developed. From the key point C to the key point D, the shear band penetrates through the middle area of the specimen, and the shear displacement increases gradually.
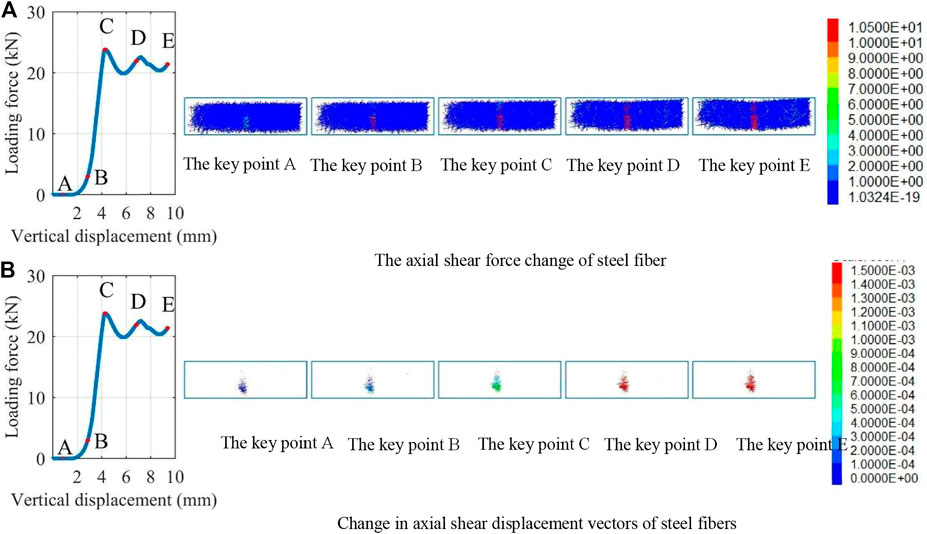
FIGURE 12. Failure of steel fiber under the three-point bending test. (A) The axial shear force change of steel fiber. (B) Change in axial shear displacement vectors of steel fibers.
Figures 13A–C show the equivalent stress change diagram, displacement change diagram, and shear slip of joints change diagram of concrete (i.e., RPC matrix), respectively. At point A, the levels of equivalent stress and displacement in the specimen are relatively low. Figure 13C shows that the middle of the specimen has a relatively small sliding displacement. At point B, the lower edge of the middle of the concrete begins to show cracks. Owing to loading on the specimen, the stress concentration appears at the restraint part, and the equivalent stress level significantly increases. It can also be seen from Figure 12A above that most of the steel fibers exhibit staggered sliding, but the amount of sliding is small. At point C, the specimen reaches the maximum bearing capacity, and the concrete has completely cracked. The equivalent stress figure shows a dark blue low stress band in the middle of specimen. Under the loading of both ends of the specimen, the upward displacements of both ends increase and the shear displacement of concrete further increases to 0.8 mm. At point D, the maximum shear displacement reaches 1.5 mm. The three-point bending test shows that even if the specimen reaches the maximum bearing capacity and cracks appear because the steel fiber provides enough shear force to resist further cracking of concrete, the specimen still has a high residual strength and high residual deformation after failure, extending the warning time of specimen failure. This also proves that the existence of steel fibers can effectively improve the strength and plasticity performance of RPC.
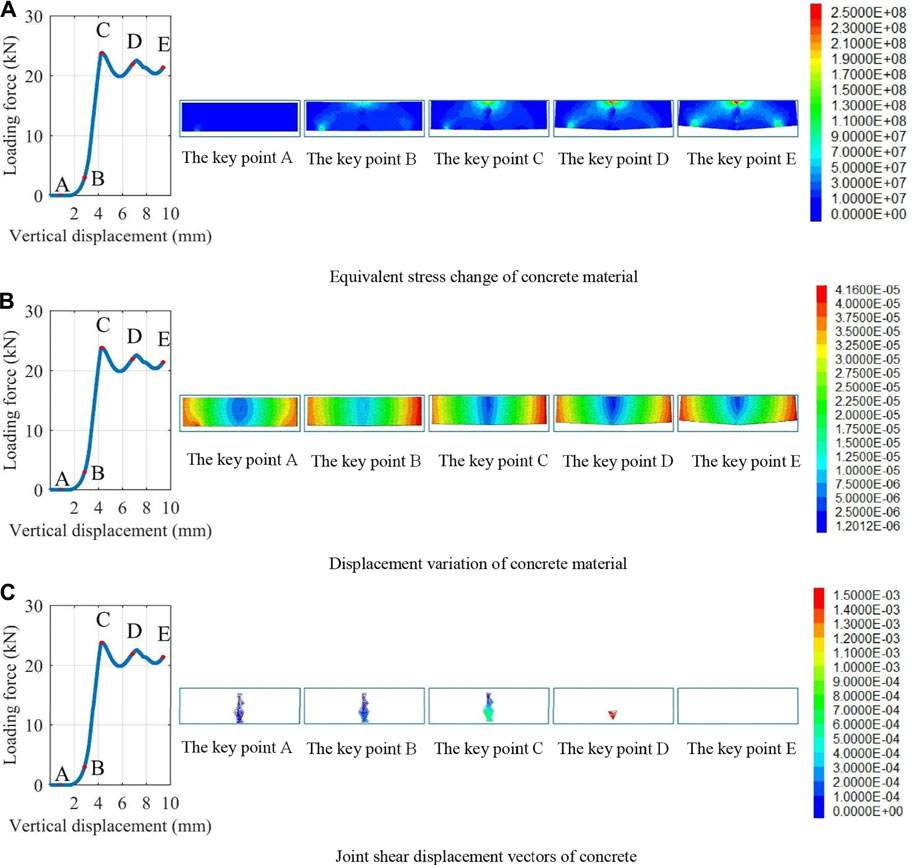
FIGURE 13. Failure of concrete under the three-point bending test. (A) Equivalent stress change of concrete material. (B) Displacement variation of concrete material. (C) Joint shear displacement vectors of concrete.
Comparison of Failure Modes of Reactive Powder Concrete Specimens Between Numerical Results and Experimental Results
Figure 14 shows a comparison of the failure modes of concrete specimens reinforced with 1% steel fiber under the uniaxial compression test, triaxial compression test, and three-point bending test between the experiment and numerical results. The specimens under the uniaxial compression test are mainly shear failure, accompanied by splitting failure perpendicular to the loading direction. The specimens under the triaxial compression test with 25 MPa confining pressure mainly show pure shear failure. The specimens under the three-point bending test show tensile failure at the middle of the specimen. At the same time, as shown in the comparison figures, the numerical results of failure characteristic of the specimens are consistent with those of experimental results. This further verifies the practicability and accuracy of this method.
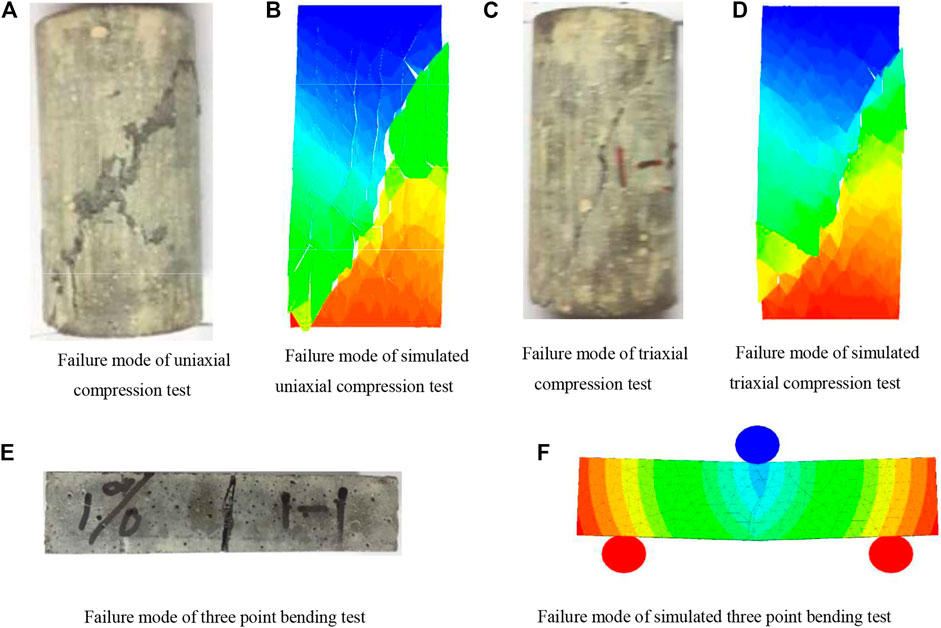
FIGURE 14. Failure modes of concrete specimens reinforced with 1% steel fiber under various mechanical tests. (A) Failure mode of uniaxial compression test. (B) Failure mode of simulated uniaxial compression test. (C) Failure mode of triaxial compression test. (D) Failure mode of simulated triaxial compression test. (E) Failure mode of three point bending test. (F) Failure mode of simulated three point bending test.
As seen in Section Analysis of Uniaxial Compression Test and Section Analysis of Triaxial Compression Test, the presence of steel fibers resulted in residual stresses of 84.2 and 166.1 MPa in the specimens after the uniaxial and triaxial compression processes, with deformations of 0.68 and 1.34%, respectively. These values only decayed by 33.5% and 23.8 relative to the peak stresses of the specimens, and it can be seen that the presence of steel fibers significantly increased the peak and residual strengths of the activated powder. The peak and residual strengths of the concrete were increased considerably by the presence of steel fibers. The reason for this improvement is the interaction force between the steel fibers and the concrete, the frictional grip between them improves the shear deformation of the concrete, while the axial force of the steel fibers improves the tensile displacement of the concrete matrix. Thus, steel fibers improve the strength and plasticity of the steel fiber–activated powder concrete from the aforementioned two ways.
Conclusion
Research on the mechanical properties of RPC is popular. This study carried out a numerical simulation of RPC under various tests. The following conclusions are drawn.
1) The spatial delivery of steel fibers was achieved by using the mixed congruence method, and the discriminatory problem of crossover between steel fibers was solved by using the coplanar projection method. Spatial generation was performed for numerical RPC specimens of steel fibers with volume contents of 1 and 2%, respectively. Comparison of slices of numerical and experimental specimens showed that this method provided good steel fiber delivery. The bond–slip behavior between steel fibers and concrete was simulated using a modified anchor cell, and the pull-out process of a single steel fiber was simulated, and the results were in good agreement with the actual experimental results.
2) The damage process of RPC with the steel fiber volume content of 1% was simulated in uniaxial compression and triaxial compression tests. The simulation results reproduce the shear damage characteristics of the steel fiber–activated powder concrete specimens, and the macroscopic damage of steel fiber concrete is mainly shear damage as corroborated by numerical simulation.
3) The three-point bending test process of steel fiber–activated powder concrete at 1% volume content of steel fibers was simulated. The tensile damage characteristics of the steel fiber–activated powder concrete specimens are clearly reproduced, and the motion process of frictional slip between the steel fiber and concrete is given.
4) The experimental and numerical simulation results show that the addition of steel fibers to the RPC matrix can effectively improve the plastic behavior and strength of RPC specimens, so that the specimens can maintain high mechanical strength even after large deformation, which proves that the RPC material with the addition of steel fibers has good application potential and provides a new way for the numerical simulation study of RPC properties.
Data Availability Statement
The raw data supporting the conclusion of this article will be made available by the authors, without undue reservation.
Author Contributions
XZ, writing the first draft of the article and simulation test in this study. GL, put forward the idea of the article and article modification. SL, test and simulation data processing. XW, polished the language of the article, sorted out the format, and modified the pictures.
Funding
This work was supported by the technology top talent support project of Guizhou Provincial Education Department ((2020)155), Research and development project of Guizhou University of Engineering Science (Grant No: G2018016), and Bijie city science and technology plan joint fund project ((2019)26).
Conflict of Interest
The authors declare that the research was conducted in the absence of any commercial or financial relationships that could be construed as a potential conflict of interest.
Publisher’s Note
All claims expressed in this article are solely those of the authors and do not necessarily represent those of their affiliated organizations, or those of the publisher, the editors, and the reviewers. Any product that may be evaluated in this article, or claim that may be made by its manufacturer, is not guaranteed or endorsed by the publisher.
References
1. Richard P, Cheyrezy M. Composition of Reactive Powder Concretes. Cement Concrete Res (1995) 25(7):1501–11. doi:10.1016/0008-8846(95)00144-2
2. Chan Y-W, Chu S-H. Effect of Silica Fume on Steel Fiber Bond Characteristics in Reactive Powder concrete. Cement Concrete Res (2004) 34(7):1167–72. doi:10.1016/j.cemconres.2003.12.023
3. Choi HK, Bae BI, Choi CS. Bond Characteristics and Splitting Bond Stress on Steel Fiber Reinforced Reactive Powder Concrete[J]. J Korea Concrete Inst (2014) 26(8):651–60. doi:10.4334/jkci.2014.26.5.651
4. He Z, Hu L, Li Y, Hu J, Shao Y. Use of sandstone Powder as a mineral Additive for concrete. Construction Building Mater (2018) 186:276–86. doi:10.1016/j.conbuildmat.2018.06.228
5. Wang Q, He MC, Li SC, Jiang ZH, Wang Y, Qin Q, et al. Comparative Study of Model Tests on Automatically Formed Roadway and Gob-Side Entry Driving in Deep Coal Mines[J]. Int J Mining Sci Tech (2021) 31(04):591–601. doi:10.1016/j.ijmst.2021.04.004
6. Yazici H, Yardimci MY, Aydin S, Karabulut AS, et al. Mechanical Properties of Reactive Powder Concrete Containing Mineral Admixtures under Different Curing Regimes[J]. Construction Building Mater (2009) 23(3):1223–31. doi:10.1016/j.conbuildmat.2008.08.003
7. Wang DH, Ju YZ, Zheng WZ. Mechanical Properties of Reactive Powder Concrete Containing Fly Ash under Different Curing Regimes. Amm (2014) 597:320–3. doi:10.4028/www.scientific.net/amm.597.320
8. Wang Q, Wang Y, He M, Jiang B, Li S, Jiang Z, et al. Experimental Research and Application of Automatically Formed Roadway without advance Tunneling. Tunnelling Underground Space Tech (2021) 114:103999. doi:10.1016/j.tust.2021.103999
9. Yazc H, Yardmc MY, Yigiter H, Aydn S, Turkel S, et al. Mechanical Properties of Reactive Powder concrete Containing High Volumes of Ground Granulated Blast Furnace Slag[J]. Cement & Concrete Composites (2010) 32(8):639–48. doi:10.1016/j.cemconcomp.2010.07.005
10. Mircea AT. Fabrication Technology-Related Cracking of Prestressed concrete Elements. Concrete (2011) 5:105–8. doi:10.1201/b11585-16
11. Banthia N, Sappakittipakorn M. Toughness Enhancement in Steel Fiber Reinforced concrete through Fiber Hybridization. Cement Concrete Res (2007) 37(9):1366–72. doi:10.1016/j.cemconres.2007.05.005
12. Yin Q, Wu J, Zhu C, He M, Meng Q, Jing H. Shear Mechanical Responses of sandstone Exposed to High Temperature under Constant normal Stiffness Boundary Conditions. Geomech Geophys Geo-energ Geo-resour (2021) 7:35. doi:10.1007/s40948-021-00234-9
13. Tanyildizi H. Effect of Temperature, Carbon Fibers, and Silica Fume on the Mechanical Properties of Lightweight Concretes. Carbon (2009) 47(6):1614–5. doi:10.1016/j.carbon.2008.12.013
14. Zhu C, He MC, Zhang XH, Tao ZG, Yin Q, Li LF. Nonlinear Mechanical Model of Constant Resistance and Large Deformation Bolt and Influence Parameters Analysis of Constant Resistance Behavior. Rock Soil Mech (2021) 42(7):1911–24. doi:10.16285/j.rsm.2020.1764
15. Ju Y, Liu HB, Liu JH, Tian KP, Wei S, Hao S, et al. Investigation on Thermophysical Properties of Reactive Powder Concrete[J]. ence China(Technological ences) (2011)(12) 268–89. doi:10.1007/s11431-011-4536-4
16. Shannag MJ, Brincker R, Hansen W. Pullout Behavior of Steel Fibers from Cement-Based Composites. Cement Concrete Res (1997) 27(6):925–36. doi:10.1016/s0008-8846(97)00061-6
17. Khaloo AR, Kim N. Mechanical Properties of Normal to High-Strength Steel Fiber-Reinforced Concrete[J]. Cement Concrete and Aggregates (1996) 18(2):92–7. doi:10.1520/cca10156j
18. Graybeal B, Tanesi J. Durability of an Ultrahigh-Performance Concrete. J Mater Civ Eng (2007) 19(10):848–54. doi:10.1061/(asce)0899-1561(2007)19:10(848)
19. Tao Z, Shu Y, Yang X, Peng Y, Chen Q, Zhang H. Physical Model Test Study on Shear Strength Characteristics of Slope Sliding Surface in Nanfen Open-Pit Mine. Int J Mining Sci Tech (2020) 30(3):421–9. doi:10.1016/j.ijmst.2020.05.006
20. Roux N, Andrade C, Sanjuan MA. Experimental Study of Durability of Reactive Powder Concretes. J Mater Civil Eng (1996) 8(1):1–6. doi:10.1061/(asce)0899-1561(1996)8:1(1)
21. Cwirzen A, Penttala V, Vornanen C. Reactive Powder Based Concretes: Mechanical Properties, Durability and Hybrid Use with OPC. Cement Concrete Res (2008) 38(10):1217–26. doi:10.1016/j.cemconres.2008.03.013
22. Faifer M, Ottoboni R, Toscani S, Ferrara L. Nondestructive Testing of Steel-Fiber-Reinforced Concrete Using a Magnetic Approach. IEEE Trans Instrum Meas (2011) 60(5):1709–17. doi:10.1109/tim.2010.2090059
23. Schlangen E, Garboai EJ. Fracture Simulation of concrete Using Lattice Models: Computational Aspects[J]. Eng Fracture Mech (1997) 57(2/3):319–22. doi:10.1016/s0013-7944(97)00010-6
24. Bazant ZP, Tabbara MR, Kazemi MT. Random Particle Models for Fracture of Aggregate or Fiber Composites[J]. J Eng Mech ASCE (1990) 116(8):1686–705. doi:10.1061/(asce)0733-9399(1990)116:8(1686)
25. Li X, Peng K, Peng J, Hou D. Experimental Investigation of Cyclic Wetting-Drying Effect on Mechanical Behavior of a Medium-Grained sandstone. Eng Geology (2021) 293:106335. doi:10.1016/j.enggeo.2021.106335
26. Li X, Peng K, Peng J, Xu H. Effect of Cyclic Wetting-Drying Treatment on Strength and Failure Behavior of Two Quartz-Rich Sandstones under Direct Shear. Rock Mech Rock Eng (2021). doi:10.1007/s00603-021-02583-z
27. Qin F, Zhang J. Three-dimensional Modelling of Steel Fiber Reinforced concrete Material under Intense Dynamic Loading[J]. Construction Building Mater (2013) 44(jul):118–32. doi:10.1016/j.conbuildmat.2013.02.067
28. Wang XF, Zhang XH, Wang YP, Wu LC, Li J. Numerical Modeling Method of Steel Fiber Reactive Powder concrete [J]. J Building Structures (2015) 36(S2):340–5. doi:10.14006/j.jzjgxb.2015.S2.049
29. Khai Lam TQ, Thi My DD, Ngo VT, Chuc Nguyen T, Phuoc Huynh T. Numerical Simulation and experiment on Steel Fiber concrete Beams. J Phys Conf Ser (2019) 1425:012007. doi:10.1088/1742-6596/1425/1/012007
30. Pereira ENB, Barros JAO, Camões A. Steel Fiber-Reinforced Self-Compacting Concrete: Experimental Research and Numerical Simulation. J Struct Eng (2008) 134(8):1310–21. doi:10.1061/(asce)0733-9445(2008)134:8(1310)
Keywords: reactive powder concrete (RPC), steel fibers, bond force, numerical simulation, failure mode
Citation: Zhang X, Liu S, Li G and Wang X (2021) Numerical Simulation of Failure Characteristics of Reactive Powder Concrete With Steel Fiber. Front. Phys. 9:759513. doi: 10.3389/fphy.2021.759513
Received: 16 August 2021; Accepted: 10 September 2021;
Published: 29 September 2021.
Edited by:
Qingxiang Meng, Hohai University, ChinaReviewed by:
Feng Xiong, China University of Geosciences Wuhan, ChinaChengjin Zhu, Shanghai Jiao Tong University, China
Copyright © 2021 Zhang, Liu, Li and Wang. This is an open-access article distributed under the terms of the Creative Commons Attribution License (CC BY). The use, distribution or reproduction in other forums is permitted, provided the original author(s) and the copyright owner(s) are credited and that the original publication in this journal is cited, in accordance with accepted academic practice. No use, distribution or reproduction is permitted which does not comply with these terms.
*Correspondence: Gan Li, bGlnYW4zMDNAMTI2LmNvbQ==