
94% of researchers rate our articles as excellent or good
Learn more about the work of our research integrity team to safeguard the quality of each article we publish.
Find out more
ORIGINAL RESEARCH article
Front. Phys., 30 November 2021
Sec. Optics and Photonics
Volume 9 - 2021 | https://doi.org/10.3389/fphy.2021.759142
Holographic cytometry is an ultra-high throughput quantitative phase imaging modality that is capable of extracting subcellular information from millions of cells flowing through parallel microfluidic channels. In this study, we present our findings on the application of holographic cytometry to distinguishing carcinogen-exposed cells from normal cells and cancer cells. This has potential application for environmental monitoring and cancer detection by analysis of cytology samples acquired via brushing or fine needle aspiration. By leveraging the vast amount of cell imaging data, we are able to build single-cell-analysis-based biophysical phenotype profiles on the examined cell lines. Multiple physical characteristics of these cells show observable distinct traits between the three cell types. Logistic regression analysis provides insight on which traits are more useful for classification. Additionally, we demonstrate that deep learning is a powerful tool that can potentially identify phenotypic differences from reconstructed single-cell images. The high classification accuracy levels show the platform’s potential in being developed into a diagnostic tool for abnormal cell screening.
Breast cancer is one of the most diagnosed cancers worldwide and its metastasis is the leading cause of death [1, 2]. Fine-needle aspiration cytology (FNAC) is a widely used method for breast cancer diagnosis and preoperative assessments. Subsequent to sample collection in FNAC, histopathological examination is the gold standard procedure performed to define histological grade [3]. However, this approach can be time-consuming, costly, labor-intensive and prone to low sensitivity [4]. Previous works show that FNAC coupled with flow cytometry (FC) is a simpler, more rapid process that provides comparable performance to conventional cytologic diagnosis [5–7]. These works typically involve the use of immunocapture cytometry systems which have very limited sensitivity to certain abnormal cells due to their incapability to detect cells not expressing the corresponding cell-surface epithelial cell marker [8, 9]. Additionally, current flow cytometers are oriented to detecting metastatic cells and little work has been done for identifying prognostic biomarkers of early cancer or precancerous cells. As an alternative, quantitative phase imaging (QPI) coupled with microfluidics offers a highly sensitive, high throughput label-free modality which, through phenotypical profiling, has the potential to be used to detect both malignant and potentially unhealthy cells. QPI-based profiling has already demonstrated high-throughput capabilities and high accuracy levels in identifying cell-cycle phases, in ultrafast all-optical laser scanning approaches [10, 11]. In other QPI approaches, deep learning has proven to be a powerful tool used by many for QPI classification [10–13], inference [14–17], and reconstruction [18–20]. We now seek to use ultra-high throughput QPI to build phenotypic profiles of single cells subjected to carcinogens, which can be, in combination with deep learning, used to develop prognostic biomarkers of precancerous cells.
For this work, we examine exposure to heavy metal ions, which can be a contributor to carcinogenic development [21–23]. Our previous work used a flow assay to study cell stiffness changes in arsenic-treated cells and the relationship with normal cell transformation into carcinogenic state [24]. This earlier study has led to our new interests in Cadmium (Cd), which is a commonly found pollutant that is present in food, water, and our surrounding environment [25]. According to the International Agency for Research on Cancer (IARC), Cd is classified as a group 1 carcinogen to humans [26]. Studies have shown that Cd exposure promotes cancer progression in epithelial cells and there is ample evidence of its role in inducing cancer [27–29]. Thus, Cd-treated cells are a suitable target for assessing aberrant morphologies with QPI and can enable comparisons with cancer cells. Through evaluating the precancerous phenotypes in Cd-treated cells, our results may provide valuable insights to a normal healthy cells’ conversion to cancer.
In this manuscript, a study is presented with applies an ultra-high throughput QPI approach, termed holographic cytometry (HC), to develop phenotype profiles of breast cells in different states of cancer progression. The profiles can be then used to develop classifiers to discriminate cells in unknown states. HC is based on a stroboscopic QPI approach, advanced to provide a high throughput approach by enabling imaging in multiple parallel microfluidic channels [30]. The HC system is applied here to acquire images of a breast cancer cell line BT474, a normal breast epithelial cell line MCF10A, and Cd-treated MCF10A cells which are expected to show pre-cancerous changes. Phenotypical differences, determined from analysis of the acquired images, are used to characterize and differentiate each cell line. Convolutional neural network (CNN) and logistic regression algorithms are used to provide discrimination between different cell types that can form the basis for identifying early-stage cancer.
Three different cell lines are imaged in this experiment: MCF10A, Cd-treated MCF10A and BT474. MCF10A and Cd-treated MCF10A were cultured in Dulbecco’s Modified Eagle Medium/F12 (Invitrogen #11330–032) supplemented with 5% horse serum, epidermal growth factor, hydrocortisone, cholera toxin and insulin. For the latter, MCF10A was treated with 2.5 μM Cd for 24 weeks prior to imaging. Both cell lines were passaged every 3 days using 0.25% trypsin. BT474 were cultured in Minimum Essential Medium Eagle, supplemented with insulin and 10% bovine serum. BT474 was passaged every 3 days using 0.05% trypsin. Cells were incubated in 37°C and 5% CO2 environment.
The HC system is based on the Mach-Zehnder off-axis interferometer design, as shown in Figure 1. Our system consists of a 640 nm continuous wave laser pulsed by an acousto-optic modulator (AOM) at 300 Hz, with a pulse width of 350 μs The AOM is synchronized with the camera frame rate, through an Arduino based microcontroller [31]. The pulsed beam is then coupled to an optical fiber and divided using a fiber splitter into the off-axis Mach-Zehnder interferometer’s reference and sample arms. The collimated beam in the sample arm passes through samples contained in a microfluidic element. The beam exiting the sample is magnified using a ×20 objective (NA = 0.4) and interfered with light from the reference arm beam at the beam splitter (BS). A small angle is imparted on the reference field to enable off-axis digital holography [32]. The magnified interferogram is then captured by a wide-framed high-speed camera (Dalsa, 4,096 × 96px, 300 fps). System throughput is optimized via wide field of view implementation and stroboscopic illumination, which allows for rapid acquisitions without image streaking. In each acquisition, 10,000 images are acquired within 33 s, enabling the system to image up to 148 cells per second. The overall optical magnification of the system is converted to × 30 by selecting the focal length of lens (L3). This gives us a field of view that covers 16 channels. The resolution of the HC is 1μm, which is close to diffraction limit. The system is highly stable, producing a phase sensitivity of 15mrad, which corresponds to 1.1 nm.
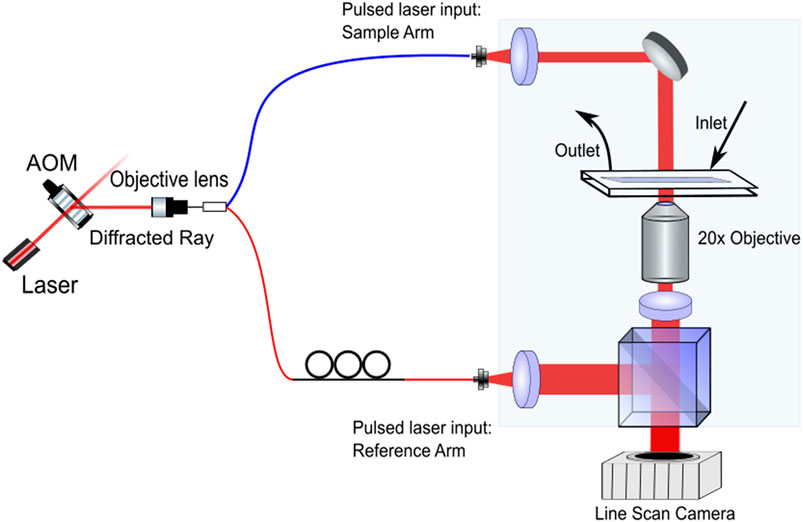
FIGURE 1. System overview [31]. L, lens; BS, beam splitter; AOM, acousto-optic modulator. The first order ray diffracted from AOM splits into sample arm and reference arm. Prior to imaging, both arms are path matched.
The microfluidic element is comprised of 108 or 54 parallel channels implemented in polydimethylsiloxane (PDMS) substrate using soft lithography methods [32]. Since the diameter of the largest cell line-BT474 is approximately 20 μm, we designed each channel to have a height and width of 30 μm. For fabrication of PDMS channels, the polymer is prepared by mixing base polymer with curing agent at a 10:1 ratio. The mixture is poured onto a patterned photomask and heated in a convection oven at 85 °C for 2 hours to form the PDMS channels. After curing glass is bonded to the channel side of PDMS, inlet and outlet channels are added to enable cell media flow entry and exit.
Cells are supplied through the inlet channel of the PDMS element using an automated syringe, with an initial flow speed of 15 μL/min. The actual speed of cells in a given channel depends on the fluid pressure and the cell concentration. We adjust the flow speed to match camera acquisition rate, so that a sufficient sequence of more than three images of each cell entering and exiting field of view can be captured for cell-tracking. MCF10A cells are imaged in continuous PDMS channels (Figure 2A) while Cd-treated MCF10A cells and BT474 cells are imaged in branched PDMS channels (Figure 2B). Selection of channel type for these cells is based on the cell concentration at time of experiment, evaluated prior to each experiment with a hemocytometer. Samples with concentration below 700,000 cells/mL are flowed in branched channels while samples with concentrations above 700,000 cells/mL are flowed in continuous channels. This selection criterion is the result of trial and error that determined the optimal choice to avoid channel blockage. All three cell lines are flowed through the PDMS elements in their respective cell media.
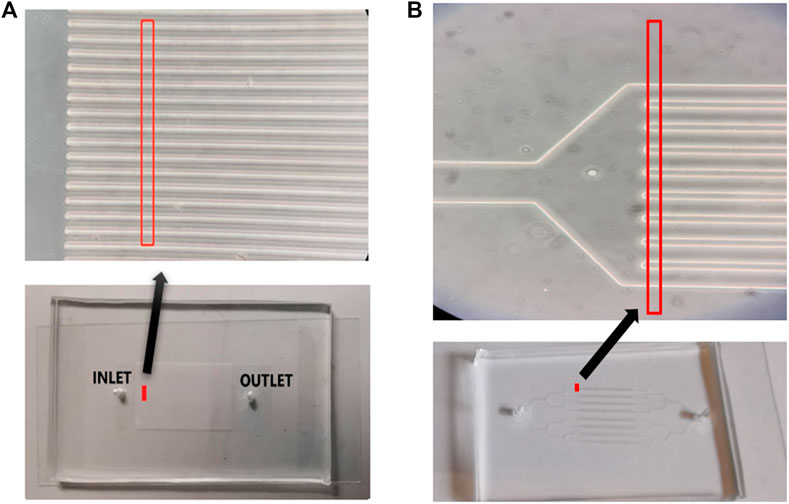
FIGURE 2. (A) Bottom: picture of continuous microfluidic channels. Top: enlarged image of subset of channels near inlet. Red lines enclose system’s field of view—16 channels. (B) Bottom: picture of branched microfluidic channels. Top: enlarged image of subset of channels near inlet. Red lines enclose system’s field of view—9 channels.
For each frame, the off-axis interferogram is processed using standard methods to extract a phase image of the optical path delay through each cell in the sample. Briefly, to obtain single cell images, each frame of the interferogram goes through phase reconstruction, background subtraction, background fitting and digital refocusing (Figure 3) [31]. To ensure that cell data describes individual cells and cell clumps are avoided, a watershed-based segmentation algorithm is implemented (Figure 4). The segmentation masks are dilated using Matlab’s default dilate function. With the segmented frames, a modified tracking code was developed based on the Matlab Computer Vision Toolbox to identify duplicate cells that are present across multiple frames [31]. Digital holograms allow for digital refocusing during postprocessing. In this sample, large refocusing ranges (up to 10’s of microns) are possible due to the tall channel height, so each cell within the same frame is refocused separately to different propagation distances (Figure 5). Every segmented whole cell identified by the tracking code, including duplicates, is refocused through Fresnel propagation to the plane with minimal amplitude variance to obtain the plane of best focus [31]. 25 morphological parameters (see supplementary) are calculated for each single cell image and passed through logistic regression [31]. The raw single cell images are used to train a convolutional neural network (CNN).

FIGURE 3. Image pre-processing: (A) Reconstructed raw phase image from a single interferogram. (B) Background image acquired with cell media but no cells present. (C) Phase image acquired with cell media and one cell present. (D) Resultant image after background subtraction. Slowly varying background noise is removed through fitting to third-order polynomials.

FIGURE 4. Image processing: (A) Reconstructed and processed phase image showing multiple cells in multiple channels. (B) Segmentation map produced by automated code, note partial cells are excluded. (C) Phase image of segmented cells that can be used for single cell analysis; algorithm excludes all partial cells from frame.
The acquired data are classified using two different algorithms—logistic regression and CNN. In total, 5,662 × 25 descriptors (cells x morphological parameters) are calculated for each binary classification cell line pair, where 5,400 × 25 are used for training and 262 × 25 are used for testing, as shown in Figure 6. The logistic regression model is trained for 10 epochs. In contrast to logistic regression, CNN classification accepts raw phase images as input and outputs classification results. Based on ResNet, the deep neural network consists of three res blocks (Figure 7B) and a final convolution layer. Conceptually, each res block serves as a residual minimizer (Figure 7A).
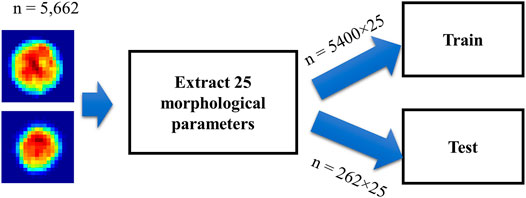
FIGURE 6. Workflow of logistic regression. Single cell images from any two cell lines of the three are passed through the algorithm, resulting in 5,400 × 25 data points for training and 262 × 25 data points for testing.
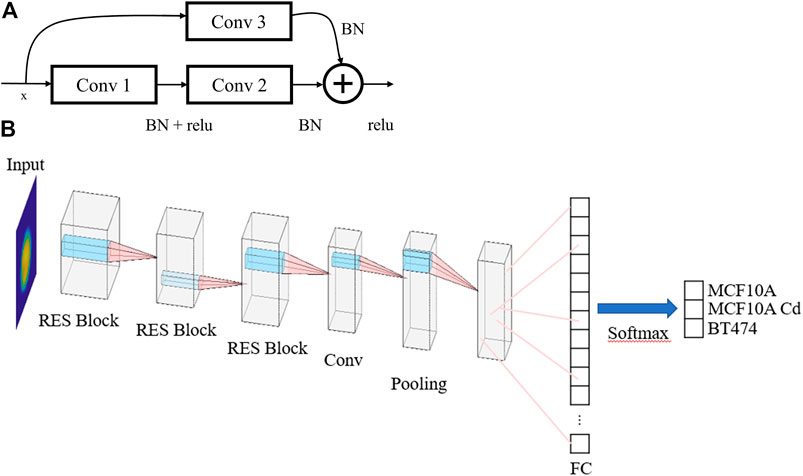
FIGURE 7. (A) Res Block architecture. BN: batch normalization. Conv: convolution layer. (B) Overall CNN architecture. FC: fully connected layer.
In the span of 33 s, the system obtained holographic images of flowing cells, showing up to 148 cells per second. In total, 8,493 unique cell images are extracted from acquired videos where 2,831 cells from each cell line are used for analysis. We manually selected the number of cells used for analysis so that the logistic regression pairs match and thus have comparable accuracy levels. 25 morphological parameters are calculated for each single-cell image, and almost all parameters exhibited significant differences across the three cell lines, with majority p-values near zero (See Supplementary). We observe that among the 25 morphological parameters extracted, optical volume (OV), area, major axis length and mean phase show the clearest trends. As shown in Figure 8(A-H), for mean area, mean OV and mean major axis length across the three cell lines, the ascending order of the parameters is MCF10A, Cd-treated MCF10A and BT474. While the BT474 cell line has more variation in OV values, the Cd-treated MCF10A and MCF10A cell lines show more homogeneity.
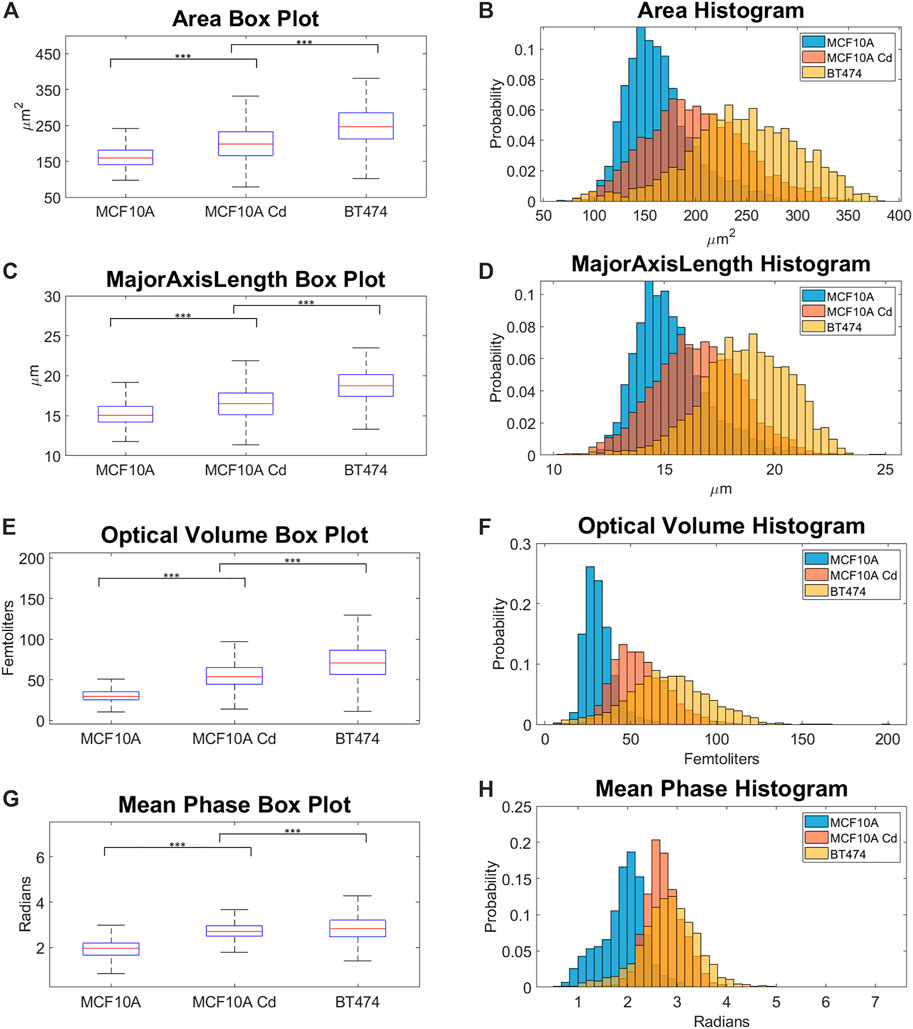
FIGURE 8. (A) Area box plot. (B) Area histogram. (C) Major axis length box plot. (D) Major axis length histogram. (E) OV box plot. (F) OV histogram. (G) Mean phase box plot. (H) Mean phase histogram. p-values were calculated using Wilcoxon rank-sum test, *** refers to p <
The dataset for each cell line is split into 2,700 training and 131 testing subsets. As shown in Table 1, when all 25 parameters are used for training, logistic regression yields the highest binary classification mean accuracy. If only the four morphological parameters shown above (Area, OV, Major Axis Length, Mean Phase) are used as input for logistic regression, the binary classification still yields adequate accuracy levels, as shown in Table 2. Overall, logistic regression demonstrates highly accurate classification performance for discriminating normal epithelial cells from abnormal cells. The CNN exhibits high accuracy performance in identifying MCF10A, Cd-treated MCF10A and BT474 through evaluating the single cell phase image, shown in Table 3 and Figure 9(A, B).

TABLE 1. Results of logistic regression binary classification [%], with 25 morphological parameters as input. In total, 25 × 2,700 parameters were used as training set and 25 × 131 parameters were used as testing set.

TABLE 2. Results of logistic regression binary classification [%], with only area, OV, major axis length and mean phase as input. In total, 4 × 2,700 parameters were used as training set and 4 × 131 parameters were used as testing set.

TABLE 3. Classification results from CNN. 2,700 images per cell line were used as training set and 131 images per cell line was used as test set. We evaluated the accuracy levels of four different models, three trained for binary classification and last one trained with all three cell lines.
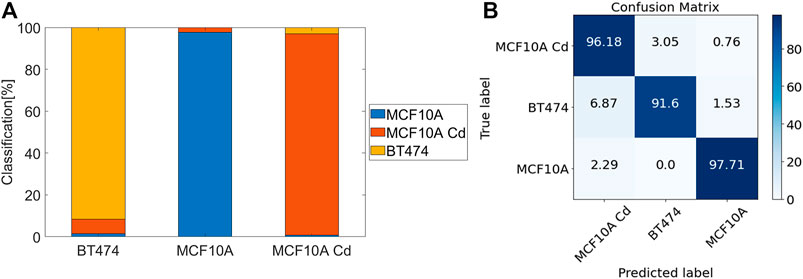
FIGURE 9. Performance of CNN classification trained with three cell lines. (A) Stack box plot of classification results. (B) Confusion matrix for CNN predictions [%].
The combination of FNAC with FC provides a cheaper, quicker and reliable alternative to the standard histological evaluation for finding cancer cells [33, 34]. However, some of the disadvantages of current FC methods include the inaccessibility to single-cell morphological information [35] and fluorescent assays of biochemical markers may be misleading if not exclusively expressed in cancer cells [35–37]. Sample preparation usually involves tedious staining processes and any mishandling can cause low test sensitivity [38]. In comparison, the holographic cytometer is a label-free imaging modality that provides a morphology-based phenotype profile for each cell line, without the need for fluorescent markers and very little sample preparation. High throughput, enabled by high-speed camera acquisition synchronized with pulsed illumination and fast cell flow, provides an abundance of single cell imaging data that is suitable for CNN classifications. In Table 3, we demonstrate with our CNN model performance that deep learning has a 98–99% in distinguishing between normal (MCF10A) and abnormal (Cd-treated MCF10A and BT474) cells.
Figure 8(A–H) show that the Cd-treated cell line exhibit intermediate morphological changes that are in between normal breast epithelial cells and breast cancer cells. For certain parameters such as mean phase, the Cd-treated cell line overlaps more with the breast cancer cells than normal cells. Through evaluating the similarities and differences of morphological parameters across the cell lines, we can potentially use these phenotype profiles to develop biomarkers which can be used to identify carcinogen-exposed cells.
We show in our analysis results that the modality indeed possesses great potential in serving as an abnormal cell identifier. Trained with large numbers of abnormal and normal healthy cells, the logistic regression algorithm and CNN are tuned to be highly sensitive and specific to abnormal cells. Among the three binary classification pairs, MCF10A/BT474 classification shows the best performance, with a mean accuracy of 99.3% and the highest sensitivity and specificity. The MCF10A/BT474 classification pair and MCF10A/MCF10A Cd pair have comparable accuracy levels (98–99%) in logistic regression and CNN, shown in Table 1 and Table 3. Note that because the Cd-treated MCF10A exhibit a greater overlap in morphological features with BT474 (Figure 8), it is within expectations that our models exhibit lower performance in classifying MCF10A Cd/BT474 pair (∼90%, Table 1). Using these two classification methods illustrates how each morphological difference contributes differently to the classification accuracy. CNN has proven to be a powerful tool in classifying the three cell lines while logistic regression provides insight on which traits play more prominent roles in classification. In general, the system is most accurate in differentiating between the abnormal cells and healthy cells.
We note that majority of the phenotypic variation can be explained by just the four statistically significant different parameters, cell area, OV, major axis length and mean phase. The logistic regression model achieves adequate accuracy levels (89–95%, Table 2) in identifying normal/abnormal cells, with only these four parameters as input. Thus, in practice, the system can operate fairly effectively by monitoring fewer morphological parameters to produce a shorter processing time. Alternatively, inclusion of more parameters offers additional diagnostic capability in classifying larger, more diverse cell populations with greater variability.
In previous work, we used a flow assay to investigate Arsenic-treated epithelial cells with QPI imaging. This study found that the tumorigenic cells show a reduced shear stiffness compared to non-tumorigenic cells [24]. Indeed, reduced stiffness is an essential feature for invasion through promotion of epithelial to mesenchymal transition. Here, we find that Cd treatment induces morphological changes in normal cells that resemble cancer cells. Combined, these results point to a potential means for identifying early signs that cells have malignant potential. Identification of such cells could have a significant impact on cancer detection and selection of therapeutic action. Future investigations will seek to identify the Cd threshold required for onset for phenotypic differences and to produce tumorigenic cell lines. We are also interested in investigating the effects of Cd treatment on disorder strength, which has been shown to be a surrogate biomarker of cell stiffness [39].
In conclusion, the HC system shows promising performance in enabling high throughput analysis of cell samples. Here the analysis demonstrates the feasibility of producing effective biomarkers for cancer cells and carcinogen-exposed cells. The results suggest these biomarkers offer the possibility that the system can be developed into a diagnostic tool for early-stage cancer by analysing large numbers of individual cell images. Incorporating additional features such as fluorescence and cell stiffness measurements in the future will further broaden utility.
The raw data supporting the conclusion of this article will be made available by the author, without undue reservation.
CC, assisted by HP, performed all experiments and data analysis and wrote the manuscript. HP. developed cell-tracking algorithm. AW. supervised the entire project and critical revision of the manuscript.
This work was supported by 1R21ES029791 from NIH grant.
The authors declare that the research was conducted in the absence of any commercial or financial relationships that could be construed as a potential conflict of interest.
All claims expressed in this article are solely those of the authors and do not necessarily represent those of their affiliated organizations, or those of the publisher, the editors and the reviewers. Any product that may be evaluated in this article, or claim that may be made by its manufacturer, is not guaranteed or endorsed by the publisher.
The Supplementary Material for this article can be found online at: https://www.frontiersin.org/articles/10.3389/fphy.2021.759142/full#supplementary-material
1. Ali W, Ilyas A, Bui L, Sayles B, Hur Y, Kim Y-T, et al. Differentiating Metastatic and Non-metastatic Tumor Cells from Their Translocation Profile through Solid-State Micropores. Langmuir (2016) 32(19):4924–34. doi:10.1021/acs.langmuir.6b00016
2. Liang Y, Zhang H, Song X, Yang Q. Metastatic Heterogeneity of Breast Cancer: Molecular Mechanism and Potential Therapeutic Targets. Semin Cancer Biol (2020) 60:14–27. doi:10.1016/j.semcancer.2019.08.012
3. Pesapane F, Suter MB, Rotili A, Penco S, Nigro O, Cremonesi M, et al. Will Traditional Biopsy Be Substituted by Radiomics and Liquid Biopsy for Breast Cancer Diagnosis and Characterisation? Med Oncol (2020) 37(4):29. doi:10.1007/s12032-020-01353-1
4. Wang M, He X, Chang Y, Sun G, Thabane L. A Sensitivity and Specificity Comparison of fine Needle Aspiration Cytology and Core Needle Biopsy in Evaluation of Suspicious Breast Lesions: A Systematic Review and Meta-Analysis. Breast (2017) 31:157–66. doi:10.1016/j.breast.2016.11.009
5. Liu K, Stern RC, Rogers RT, Dodd LG, Mann KP. Diagnosis of Hematopoietic Processes by fine-needle Aspiration in Conjunction with Flow Cytometry: A Review of 127 Cases. Diagn Cytopathol (2001) 24(1):1–10. doi:10.1002/1097-0339(200101)24:1<1:aid-dc1000>3.0.co;2-j
6. Zeppa P, Marino G, Troncone G, Fulciniti F, De Renzo A, Picardi M, et al. Fine-needle Cytology and Flow Cytometry Immunophenotyping and Subclassification of Non-hodgkin Lymphoma: a Critical Review of 307 Cases with Technical Suggestions. Cancer (2004) 102(1):55–65. doi:10.1002/cncr.11903
7. Levine PH, Zamuco R, Yee HT. Role of fine-needle Aspiration Cytology in Breast Lymphoma. Diagn Cytopathol (2004) 30(5):332–40. doi:10.1002/dc.20070
8. Rushton AJ, Nteliopoulos G, Shaw JA, Coombes RC. A Review of Circulating Tumour Cell Enrichment Technologies. Cancers (Basel) (2021) 13(5):970. doi:10.3390/cancers13050970
9. Mohan S, Chemi F, Brady G. Challenges and Unanswered Questions for the Next Decade of Circulating Tumour Cell Research in Lung Cancer. Transl Lung Cancer Res (2017) 6(4):454–72. doi:10.21037/tlcr.2017.06.04
10. Siu DMD, Lee KCM, Lo MCK, Stassen SV, Wang M, Zhang IZQ, et al. Deep-learning-assisted Biophysical Imaging Cytometry at Massive Throughput Delineates Cell Population Heterogeneity. Lab Chip (2020) 20(20):3696–708. doi:10.1039/d0lc00542h
11. Yip GGK, Lo MCK, Yan W, Lee KCM, Lai QTK, Wong KKY, et al. Multimodal FACED Imaging for Large-Scale Single-Cell Morphological Profiling. APL Photon (2021) 6(7):070801. doi:10.1063/5.0054714
12. Ryu D, Kim J, Lim D, Min H-S, Yoo IY, Cho D, et al. Label-Free White Blood Cell Classification Using Refractive Index Tomography and Deep Learning. BME Front (2021) 2021:9893804. doi:10.34133/2021/9893804
13. Carcagni P, Goncalves da Silva A, Memmolo P, Bianco V, Merola F, Garcia Goncalves LM, et al. An Investigation on Deep Learning Approaches for Diatoms Classification. In: Proceeding of Multimodal Sensing and Artificial Intelligence: Technologies and Applications, Munich, Germany, June 20, 2021. SPIE (2021).
14. Kandel ME, Kim E, Lee YJ, Tracy G, Chung HJ, Popescu G. Multiscale Assay of Unlabeled Neurite Dynamics Using Phase Imaging with Computational Specificity. ACS Sens. (2021) 6(5):1864–74. doi:10.1021/acssensors.1c00100
15. Kandel ME, He YR, Lee YJ, Chen TH-Y, Sullivan KM, Aydin O, et al. Phase Imaging with Computational Specificity (PICS) for Measuring Dry Mass Changes in Sub-cellular Compartments. Nat Commun (2020) 11(1):6256. doi:10.1038/s41467-020-20062-x
16. Cheng S, Fu S, Kim YM, Song W, Li Y, Xue Y, et al. Single-cell Cytometry via Multiplexed Fluorescence Prediction by Label-free Reflectance Microscopy. Sci Adv (2021) 7(3):eabe0431. doi:10.1126/sciadv.abe0431
17. Yan H, Wu Y, Zhou Y, Xu M, Paiè P, Lei C, et al. Virtual Optofluidic Time-Stretch Quantitative Phase Imaging. APL Photon (2020) 5(4):046103. doi:10.1063/1.5134125
18. Chung H, Huh J, Kim G, Park YK, Ye JC. Missing Cone Artifact Removal in ODT Using Unsupervised Deep Learning in the Projection Domain. IEEE Trans Comput Imaging (2021) 7:747–58. doi:10.1109/tci.2021.3098937
19. Matlock A, Xue Y, Li Y, Cheng S, Tahir W, Tian L. Model and Learning-Based Computational 3D Phase Microscopy with Intensity Diffraction Tomography. In: 2020 28th European Signal Processing Conference (EUSIPCO), Amsterdam, Netherlands, January 18-21, 2021 (2020).
20. Xue Y, Cheng S, Li Y, Tian L. Reliable Deep-Learning-Based Phase Imaging with Uncertainty Quantification. Optica (2019) 6(5):618–29. doi:10.1364/optica.6.000618
21. Kim HS, Kim YJ, Seo YR. An Overview of Carcinogenic Heavy Metal: Molecular Toxicity Mechanism and Prevention. J Cancer Prev (2015) 20(4):232–40. doi:10.15430/jcp.2015.20.4.232
22. Tchounwou PB, Yedjou CG, Patlolla AK, Sutton DJ. Heavy Metal Toxicity and the Environment. Exp Suppl (2012) 101:133–64. doi:10.1007/978-3-7643-8340-4_6
23. Mohammadi AA, Zarei A, Majidi S, Ghaderpoury A, Hashempour Y, Saghi MH, et al. Carcinogenic and Non-carcinogenic Health Risk Assessment of Heavy Metals in Drinking Water of Khorramabad, Iran. MethodsX (2019) 6:1642–51. doi:10.1016/j.mex.2019.07.017
24. Muñoz A, Eldridge WJ, Jakobsen NM, Sørensen H, Wax A, Costa M. Cellular Shear Stiffness Reflects Progression of Arsenic-Induced Transformation during G1. Carcinogenesis (2018) 39(2):109–17. doi:10.1093/carcin/bgx116
25. Fatima G, Raza AM, Hadi N, Nigam N, Mahdi AA. Cadmium in Human Diseases: It's More Than Just a Mere Metal. Ind J Clin Biochem (2019) 34(4):371–8. doi:10.1007/s12291-019-00839-8
26.IARC Working Group on the Evaluation of Carcinogenic Risks to Humans. Cadmium and Cadmium Compounds. Lyon, FR: International Agency for Research on Cancer (1993).
27. Wei Z, Shan Z, Shaikh ZA. Epithelial-mesenchymal Transition in Breast Epithelial Cells Treated with Cadmium and the Role of Snail. Toxicol Appl Pharmacol (2018) 344:46–55. doi:10.1016/j.taap.2018.02.022
28. McElroy JA, Shafer MM, Trentham-Dietz A, Hampton JM, Newcomb PA. Cadmium Exposure and Breast Cancer Risk. JNCI: J Natl Cancer Inst (2006) 98(12):869–73. doi:10.1093/jnci/djj233
29. Gallagher CM, Chen JJ, Kovach JS. Environmental Cadmium and Breast Cancer Risk. Aging (2010) 2(11):804–14. doi:10.18632/aging.100226
30. Han S, Park WJE, Ceballos S, Adam P. Wax, Editor High Throughput Screening of Cancer Cells Using Holographic Cytometry. In: Proceeding SPIE 11251, Label-free Biomedical Imaging and Sensing (LBIS) 2020, San Francisco, United States, March 10, 2020 (2020).
31. Park HS, Price H, Ceballos S, Chi J-T, Wax A. Single Cell Analysis of Stored Red Blood Cells Using Ultra-High Throughput Holographic Cytometry. Cells (2021) 10(9).
32. Park HS, Eldridge WJ, Yang W-H, Crose M, Ceballos S, Roback JD, et al. Quantitative Phase Imaging of Erythrocytes under Microfluidic Constriction in a High Refractive index Medium Reveals Water Content Changes. Microsyst Nanoeng (2019) 5:63. doi:10.1038/s41378-019-0113-y
33.D Varshney, M Kaushal, M Bhardwaj, VGS Kumar, and P Agarwal, editors. Comparative Evaluation of Combined Application of fine Needle Aspiration Cytology and Flow Cytometry with Histopathology for the Diagnosis of Non-Hodgkin Lymphoma, New Delhi: Khyati Education and Research Foundation (2020).
34. Barrena S, Almeida J, Del Carmen García-Macias M, López A, Rasillo A, Sayagués JM, et al. Flow Cytometry Immunophenotyping of fine-needle Aspiration Specimens: Utility in the Diagnosis and Classification of Non-hodgkin Lymphomas. Histopathology (2011) 58(6):906–18. doi:10.1111/j.1365-2559.2011.03804.x
35. Cossarizza A, Chang HD, Radbruch A, Akdis M, Andrä I, Annunziato F, et al. Guidelines for the Use of Flow Cytometry and Cell Sorting in Immunological Studies. Eur J Immunol (2017) 47(10):1584–797. doi:10.1002/eji.201646632
36. Cianciosi D, Ansary J, Forbes-Hernandez TY, Regolo L, Quinzi D, Gracia Villar S, et al. The Molecular Basis of Different Approaches for the Study of Cancer Stem Cells and the Advantages and Disadvantages of a Three-Dimensional Culture. Molecules (2021) 26(9):2615. doi:10.3390/molecules26092615
37. Kim W-T, Ryu CJ. Cancer Stem Cell Surface Markers on normal Stem Cells. BMB Rep (2017) 50(6):285–98. doi:10.5483/bmbrep.2017.50.6.039
38. Delmonte OM, Fleisher TA. Flow Cytometry: Surface Markers and beyond. J Allergy Clin Immunol (2019) 143(2):528–37. doi:10.1016/j.jaci.2018.08.011
Keywords: quantitative phase imaging (QPI), machine learning, high throughput microfluidics, cell biophysical properties, cancer diagnostics and screening
Citation: Chen CX, Park HS, Price H and Wax A (2021) Automated Classification of Breast Cancer Cells Using High-Throughput Holographic Cytometry. Front. Phys. 9:759142. doi: 10.3389/fphy.2021.759142
Received: 15 August 2021; Accepted: 01 November 2021;
Published: 30 November 2021.
Edited by:
YongKeun Park, Korea Advanced Institute of Science and Technology, South KoreaReviewed by:
Santosh Kumar, Liaocheng University, ChinaCopyright © 2021 Chen, Park, Price and Wax. This is an open-access article distributed under the terms of the Creative Commons Attribution License (CC BY). The use, distribution or reproduction in other forums is permitted, provided the original author(s) and the copyright owner(s) are credited and that the original publication in this journal is cited, in accordance with accepted academic practice. No use, distribution or reproduction is permitted which does not comply with these terms.
*Correspondence: Cindy X. Chen, eGMxNDdAZHVrZS5lZHU=
Disclaimer: All claims expressed in this article are solely those of the authors and do not necessarily represent those of their affiliated organizations, or those of the publisher, the editors and the reviewers. Any product that may be evaluated in this article or claim that may be made by its manufacturer is not guaranteed or endorsed by the publisher.
Research integrity at Frontiers

Learn more about the work of our research integrity team to safeguard the quality of each article we publish.