- School of Management Science and Engineering, Central University of Finance and Economics, Beijing, China
This study collects data on electric vehicle (EV) charging piles for various provinces in China and analyzes the development of the network of EV chargers from the perspective of a complex network. Features of the distribution of EV charging piles for the period from May 2016 to April 2019 and the spatio-temporal variations across provinces are thus analyzed. The study then transforms time-series data of the EV charging piles into a complex network by applying a visibility graph, uses several clustering methods to categorize different provinces, and predicts the future development of the network of EV charging piles in China. Additionally, the distribution of EV charging piles across time is analyzed for a combination of national policies and new-energy vehicles. The results of the study will guide provincial governments in creating policies that develop relevant industries progressively and promote the sustainable development of EVs and green-energy industry.
Introduction
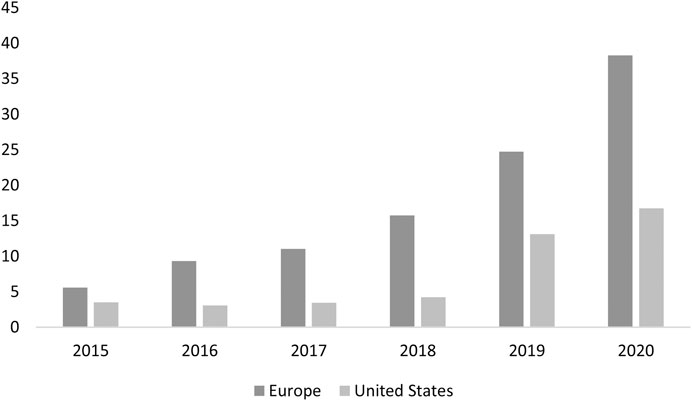
Electronic vehicles (EVs) are universally recognized as a practical solution to the problems of reducing carbon emissions and improving air quality in the global sector of transportation [1]. Many powerful economies are shifting their vehicle preference to electronic vehicles for eco-friendly purposes, and the development of the supporting infrastructure of EVs is rapidly progressing. However, short traveling distances and limited battery volumes due to current technical barriers are holding back the expansion of EVs, and the construction of EV chargers is thus considered the most effective way of promoting the adoption of EVs [2]. In recent years, European countries, along with the United States, have expanded their distributions of EVs and EV charging piles [3], as shown in Figure 1. From the viewpoint of the owners of EVs, the locations of EV charging piles are critical for the convenience of recharging EV batteries. Home chargers have the lowest cost, while public charging piles are becoming a necessary option for off-home charging [4]. Furthermore, public charging piles are mostly high power and provide faster charging in urban areas, which is more suitable for high-power charger installation than homes [5].
While wealthy countries are developing their EV infrastructure, China, a country with a large population and massive land area, is also creating a nationwide distribution of EVs. The charging pile industry is in full development with the expansion of the investment blueprint of new infrastructure in China. As new-energy vehicles are being promoted in China, the construction of charging piles, as important infrastructure, has gradually attracted attention. The central government, provinces, and cities have successively introduced preferential policies and measures that promote the development of the charging pile industry, and the construction of charging piles in China has undergone explosive growth, from 33,000 piles in 2014 to 777,000 piles in 2018, which is growth of more than 200% in 4 years. Statistics show that the 2017 new-energy vehicle ownership, public charging pile number, car pile ratio compared with before 2012 decreased, but the rate of construction of charging piles is not keeping up with the manufacture of new-energy vehicles. China has built 55.7% of the world’s new-energy charging piles, but the shortage of public charging resources and user complaints about charging problems continues. Additionally, there are many other problems; e.g., the layout of the charging pile is unreasonable, there is an imbalance between supply and demand, and the time required for investment to turn into profit is uncertain.
This paper gives a new perspective of complex network to study the growing distribution of EVs and charging piles in China. This study investigates the historical development of China’s new-energy vehicles and charging piles from May 2016 to April 2019 and how local policies have affected the distribution of EVs in China. The data are analyzed by adopting time series visualization, complex networks, and several clustering methods. Combined with the model results, policies and characteristics of provinces, it is believed that the results of this study will provide a reference for the rapid development of charging piles in China.
The remainder of the paper is organized as follows. Literature Review reviews previous research on new-energy vehicles and piles. Data and Model presents the models and methods used in the paper, including the methodology and data collection. Results and Discussion presents the estimation results and analysis. Results and Discussion presents empirical research and analyzes features and reasons that lead to these results. Conclusion presents what we do in this study, our findings and expectations.
Literature Review
Environmental problems have become a major concern in recent years. Many papers have suggested that the cause of environmental problems, such as environmental deterioration and frequent haze, lies in automobile exhaust emissions, which has encouraged the development of new-energy vehicles and their related industries [6,7,8]. The traditional-automobile industry is driven by oil and consumes many precious resources. Therefore, the promulgation of appropriate policies that promote the innovative development of the new-energy vehicle industry will greatly help solve environmental problems.
However, there are many problems to be solved in developing new-energy vehicles. One problem is the development of new-energy charging technology while another is the gulf between the rate of manufacture of new-energy vehicles and the rate of construction of new-energy vehicle charging piles, which continues to grow.
Scholars have found that the construction of charging pile facilities plays a positive role in the development of new-energy vehicles. Policies supporting EV construction cultivate the EV market, with technical advances and subsidies in China promoting future progress of the EV industry [9]. [10] found that improving the supporting infrastructure has a more obvious effect on the market promotion of new-energy vehicles than factors of technological progress [11]. showed that the construction of charging pile infrastructure provides a stronger incentive to the new-energy vehicle market than government subsidies for vehicle companies. Improvements to charging piles and the supporting facilities of charging stations can affect the customer’s intention to purchase new-energy vehicles [12–16].
There is a lack of relevant empirical studies in the literature, with most studies considering simulated scenarios. The situation in the simulated scenario tends to be more or less different from the actual situation. Additionally, most studies have focused on different factors and perspectives of the planning layout of the site selection, operation mode, and system improvements of charging piles whereas there have been few tracing studies on actual construction or studies providing a macroscale or comparative perspective.
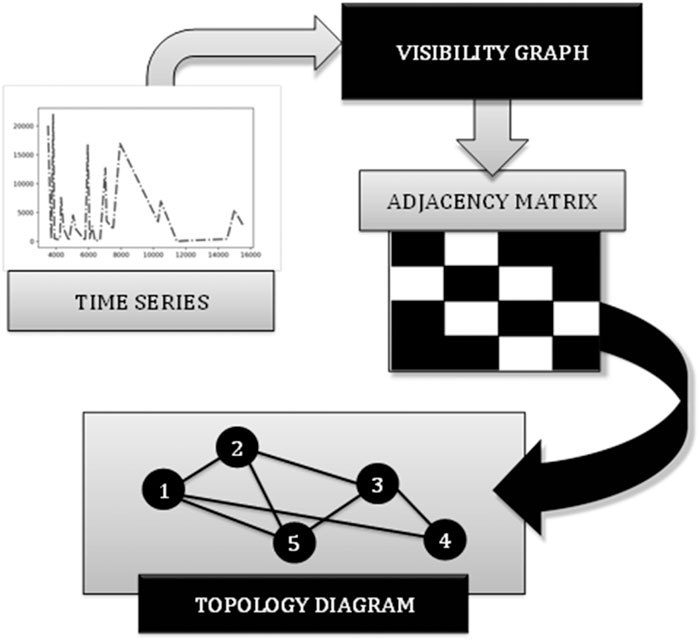
This paper adopts real-world data to conduct a visual network analysis of the overall development of new-energy vehicles and charging piles based on the Chinese background of the development of new-energy vehicle charging piles. In addition, considering the formulation of new-energy vehicles and charging pile development policies by province, complex network clustering analysis is conducted on data of the development of public charging piles in 31 provinces and cities in China. And Figure 3 shows the process of construction of the time-series network and extraction of features.
Data and Model
Data
Data are collected from the National Bureau of Statistics of China and the China Electric Vehicle Charging Infrastructure Promotion Alliance1. Eliminating the missing data and outliers, this study analyzes the data of new-energy vehicles and charging piles in China for the period from May 2016 to April 2019.
Time series statistics of EVs in China are processed and generated in MATLAB algorithms, and Gephi has been applied to output the visibility graph and relevant coefficients.
Figure 2 shows obvious good trends of the manufacture of new-energy vehicles and charging piles on the whole. However, the difference in scale of the left and right vertical axes directly reflects the mismatch of the manufacture of charging piles and new-energy vehicles in China. The statistical results for all charging piles and public charging piles in China are similar, and different from those for new-energy vehicles.
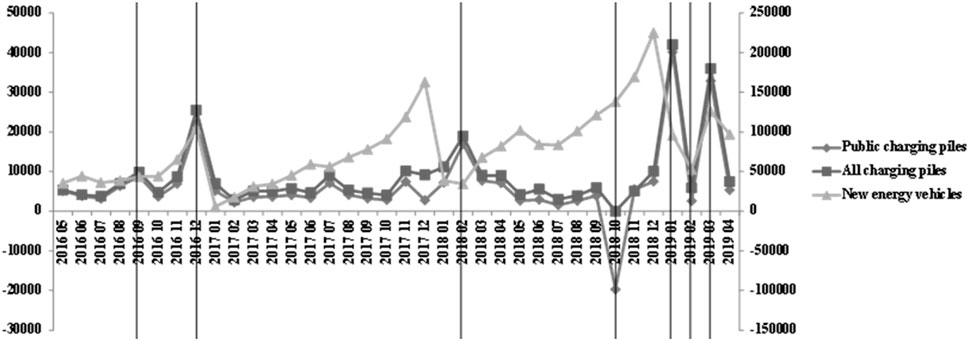
FIGURE 2. Trends of the numbers of new-energy vehicles, all charging piles, and public charging piles.
The new monthly increase in the number of charging piles of new-energy vehicles had small peaks in September 2016, December 2018, February 2018, January 2019, and March 2019. Table 1 shows that important relevant policies were launched before and after some of these peaks.
China’s ratio of new-energy vehicles to charging piles still does not meet the requirements of the development guide. Accelerating the planning and implementation of the reasonable construction of charging piles is the cornerstone of further development.
Table 2 displays the statistical results of EVs, all charging piles, and public charging piles in China during 2016–2019.

TABLE 2. Statistical results of collected data of EVs, all charging piles, and public charging piles.
Principles of Time-Series Visualization
A time series is a series of data points indexed by the observation time. Common tasks of time-series data mining are dimension reduction, similarity measurement, classification, cluster analysis, pattern discovery, and visualization. Different time-series analysis methods, such as chaos analysis, fractal analysis, recursion graph, complexity measurement, multi-scale entropy, and time-frequency representation, have been developed. In the past decade, scholars have increasingly adopted complex networks to analyze dynamic systems based on time series, such as investigating USA’s electricity market, stock prices and even global efforts against terrorism [17-19].
The VG method adopted in this paper is based on the complex network model proposed by [20]. Time series can be divided into univariate time series (UTSs) and multivariate time series (MTSs) according to the number of variables. Traditional methods such as K-Shape and K-MS can be used for the rapid and accurate clustering and classification of UTS data sets but they are unsuitable for MTS data mining [21]. Used different frequencies as multiple variables to construct complex networks, detect community structure characteristics, and analyze the relationship between the clustering coefficient and system evolution. By constructing a common projection axis as the prototype of each cluster, the tail removal algorithm Mc2PCA of the method is given and its time complexity is analyzed.
The constructed new graph inherits essential properties and inherent features of the time-series data, allowing scholars to conduct analyses and further interpret the original data with the application of theoretical methods of complex networks and graph theory. The VG algorithm transforms a time series {xi}, i = 1,…, n into a VG G = (V,E), where V(G) = {vi}, i = 1,…, n is a set of vertices with vertex vi corresponding to data point xi. E(G) is the edge of the graph. We define A = {ai,j}, i, j = 1,…, n as the adjacent matrix of the VG with ai,j = 1 for connected vertices and ai,j = 0 for disconnected vertices. The element ai,j = 1 when the geometrical criterion
is fulfilled.
The principle of the transition is stated as follows. The graph is deemed as a set of zeniths, which are nodes linked to each other by lines called edges. The numbers of new-energy vehicles and charging piles are first counted according to the set time. Statistical histograms are then produced accordingly. The height of the histogram reflects the volume at each time point or month from May 2016 to April 2019.
The bottom line is the criterion determining whether two points are set as being connected. The prerequisite for connecting the two points in the network is whether the peaks of the two histograms can be seen from each other (i.e., whether a straight line can connect the peaks without crossing all the histograms). It can then be transformed into the corresponding relationship between the two pairs, which is shown as the connection of each time points on the time dimension.
We next acquire the adjacency matrix by working on the time-series nodes and edges, and we calculate the various features of the subject networks.
By analyzing the original data, we visualize the time series data and obtain the complex network characteristics of the new-energy vehicles, all charging piles, and public charging piles.
As previously mentioned, we transform the time series data into complex network forms. The network parameters are given in Table 3. We find that among the three networks, the number of edges and average degree are largest for the public charging piles, reflecting that there are more peaks and troughs for these piles. The diameters of the networks of the new-energy vehicles, all charging piles, and public charging piles are respectively 3, 4, and 4; these values are the lowest number of edges between the two time points with the longest distance. The average path lengths are respectively 2.075, 2.111, and 2.129 for the three networks; these values indicate the average number of edges between any two time points.
Analysis of Centrality
Using data for the period from May 2016 to April 2019, we conduct a quantification analysis of the daily networks, including analyses of the degree centrality, betweenness centrality, eigenvector centrality, strength, and clustering coefficient of the complex network.
Degree of Centrality
The degree of centrality is the most direct measurement in the analysis of a network and is the simplest measure characterizing the connectivity properties of a single vertex in theory [22]. The calculation of the degree of centrality of a node is simply the counting of the number of edges associated with the subject node n. The degree of centrality of a node is positively correlated to the importance of the node in the network. In network N with k nodes, the degree of centrality of node n, denoted Dc(n), is expressed as
In graph theory, Θ(V2) and Θ(E) are respectively the complexities of calculating the degree of centrality in the dense adjacency matrix and sparse adjacency matrix, where V is representative of all nodes and E makes reference to all edges.
The definition of centrality can be extended from the node to the graph [22]. Assume that n* is the node with the highest degree of centrality in network N. X:=(Y,Z) is then defined as the maximum:
The centrality of network N is defined as
If a node is linked to all other nodes in network W and all other nodes only link to this central node, H of network W (which will be a star graph) reaches a maximum [22]. Here, H = (k − 1) (k − 2), and the centrality of network N can be simplified as
Betweenness Centrality
The extent to which the location of a node is within the scope of other nodes on a graph is a measure of betweenness. Nodes that have higher betweenness centrality values are on the shortest path from other nodes.
According to Sanjiv and Purohit [22], in network N with n nodes, the betweenness centrality Bc(n) of node n is calculated as follows. First, all the shortest paths of each node pair (p, q) are calculated, it is then evaluated whether node n is on the shortest path of each node pair (p, q), the results are finally cumulated. This process can be simplified as
where
The computations of the betweenness and closeness centrality are based on the computations of the shortest distance. In the search for the shortest path for each node pair, the modified Floyd–Warshall algorithm has complexity of Θ(W3). On a sparse graph, the efficiency of the Johnson algorithm exceeds
On an undirected graph, weighted edges should not be considered in the calculation of the betweenness and closeness centrality of nodes. More importantly, the norm of graph processing is not to use rings or weighted edges to render relationships simple. In these circumstances, adopting the Brandes algorithm will halve the ultimate centrality owing to the double calculation of the shortest path.
Closeness Centrality
According to graph theory, closeness is a measure of the complex centrality of a node. Shallower nodes (i.e., nodes having shorter geodesic distances) have higher values of closeness. The nodes that are more central have higher closeness values, and the closeness thus represents the minimum path length in the network. Additionally, closeness is often related to other measurements. The closeness centrality is the average geodesic distance (e.g., shortest path) from node n to other accessible nodes [22]:
where k ≥ 2 is the distance of access section N from node n in the network. The closeness centrality is a measure of the time that it takes for a given node to propagate information to other reachable nodes in a network. The closeness centrality CC(n) of node n is defined as the reciprocal of the sum of the geodesic distances to all other nodes N [22]:
Closeness can be obtained using different methods and algorithms. Dangalchev [23] modified the definition of closeness so that it can be applied to a non-connected graph and is easier to calculate:
Eigenvector Centrality
Most hub nodes are found in line with the integral structure of the network, and the eigenvector centrality is then measured. The dimensions of the distance between nodes are acquired through factor analysis. Each node in a network has a relative index value based on the principle that the contribution of a high-index node connecting to a node is more than that of a low-index node [24].
Let pi be the (exponential) value of node i and
where M(i) is the set of nodes connected to node i, N is the number of nodes, and λ is a constant. The matrix form is
Strength
In a directed and weighted network, the strength denotes the total weights of the edges connecting to one node [25]. In this paper, the strength is a measure of the number of EVs in different provinces. The strength is calculated as
where
Clustering Coefficient
The clustering coefficient describes the characteristics of the graph (or network). A graph G consists of a number of vertices V and a number of lines (called edges) E between vertices. Two adjacent vertices are called adjacent points. The clustering coefficient of a network is defined as [25]:
Clustering
Applying complex network theory to the primal data, the relations within the data are represented on a graph as nodes and edges. In this way, there is a great advantage over the traditional static method in that we can capture the dynamic features and community structures. Furthermore, the nodes and edges can be clustered into different groups. The clustering is an analyzable phenomenon in that the correlation between the set of nodes in a subgroup is higher than that outside the group. In an attempt to obtain an effective clustering result, we adopt a widely used principle proposed by Newman [26]. The modularity Q is formularized as
where K is the number of subgroups, L is the number of edges, and
Results and Discussion
Analysis of Network Properties
Analysis of Centrality
Following the analysis of the degree of centrality of the complex networks, three network centricities are calculated and six indicators are presented in frequency diagrams; these are the eccentricity, closeness centrality, harmonic closeness centrality, betweenness centrality, strength, and clustering coefficient.
A comparison of the three eccentricities reveals that in the complex network of new-energy vehicles, the eccentricity is low and the distribution is relatively uniform. The eccentricity of the network nodes of charging piles is mainly around 3 or 4, and the distribution of all charging piles is especially concentrated. This reflects the rapid manufacture of new-energy vehicles, whereas the rate of manufacture of charging piles is relatively stable.
The three networks have similar distributions of closeness centrality and betweenness centrality, and it appears that they all have the right-hand bias. In the field of topology and related mathematics, closeness is an elementary concept of the topological space. Intuitively, when two sets are arbitrarily close, they are said to be tight. This concept is easy to adopt in a metric space that defines the distance between elements within a space, but it is difficult to extend to a topological space without a specific metric distance. In network analysis, closeness represents the minimum path length, which means that in the development of the three networks over the 3 years, there is a high possibility of there being extreme quantitative values. Additionally, the strengths and clustering coefficients of the three networks are similar, with medium values having the highest frequency, which indicates that the development of the network of EV charging piles is steady and provinces in China are well connected and coordinated in the advance of EV infrastructure. The results match those of the analyses in the first part above.
Figure 4 shows that the centrality distributions of new-energy vehicles and charging piles are somewhat similar and that they are in the process of coordinated development. An increase in the penetration rate of new-energy vehicles requires a foundation of a sufficient number of public charging piles.
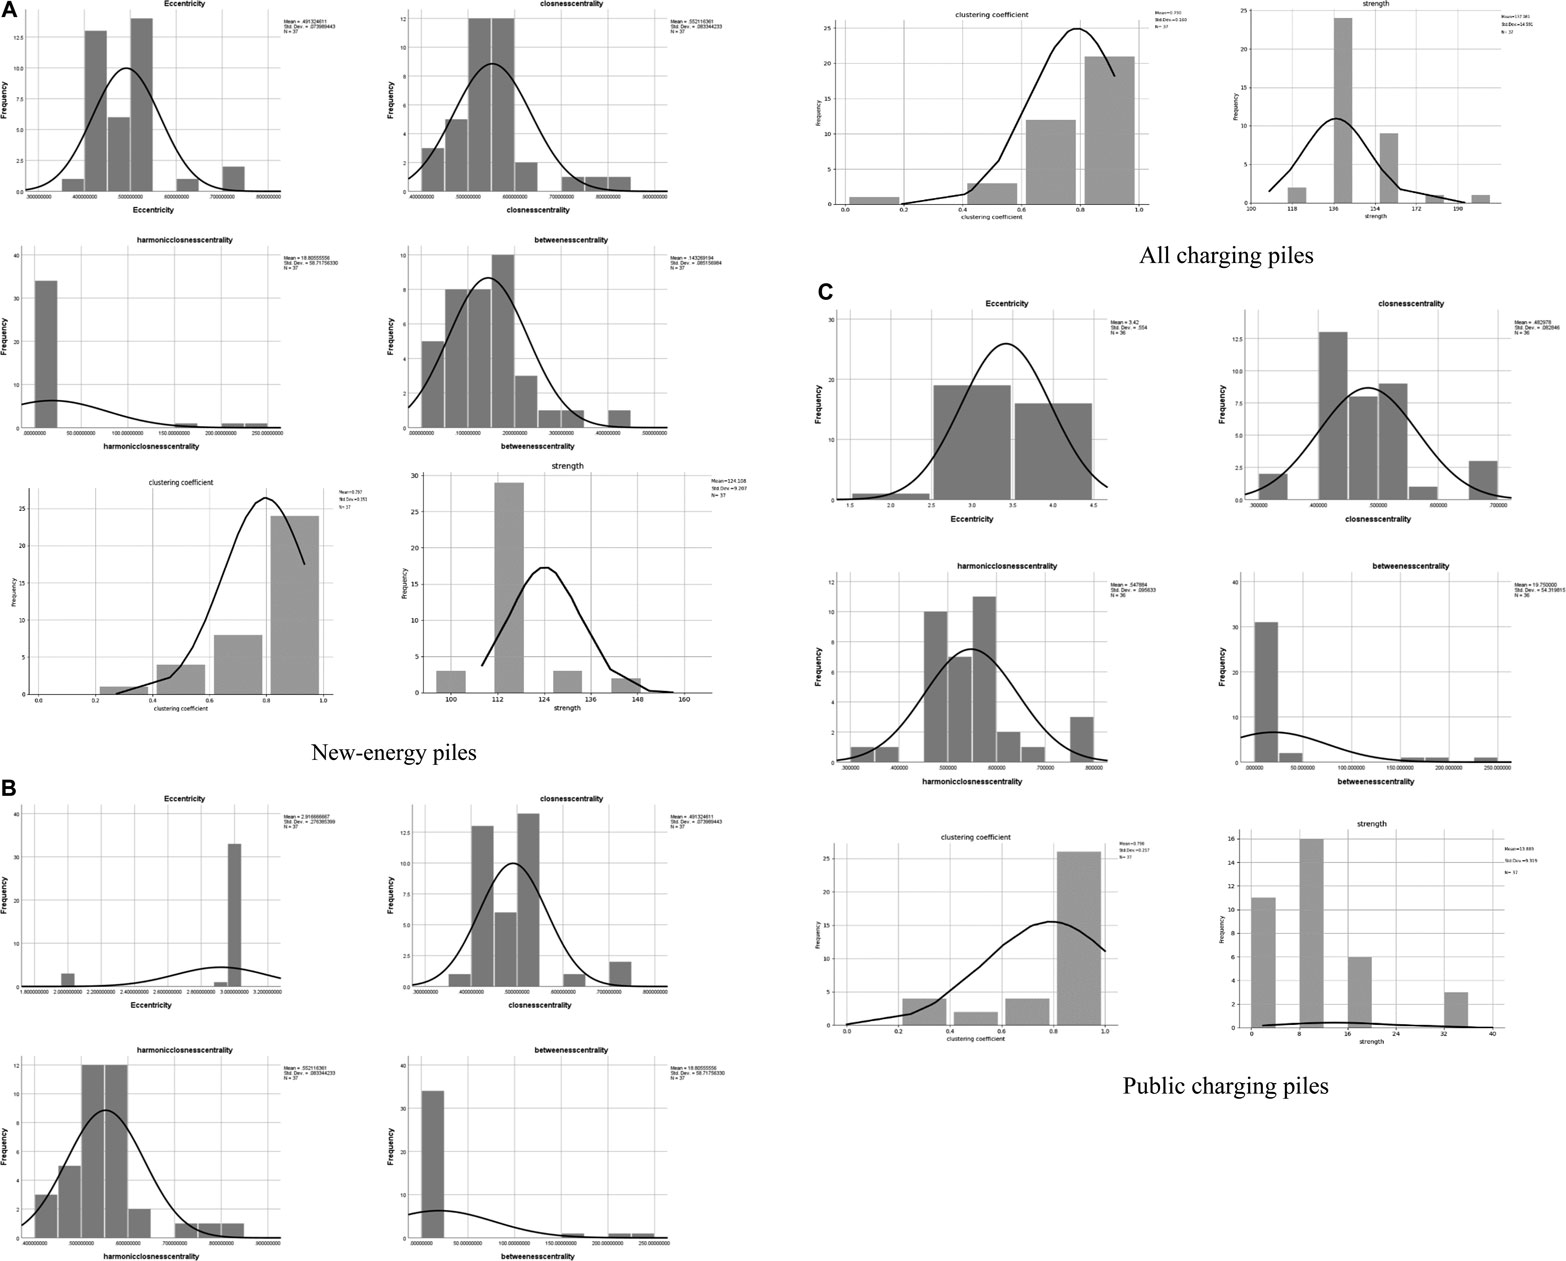
FIGURE 4. Histogram of the frequency distribution of the centrality of (A) new-energy piles, (B) all charging piles, and (C) public charging piles. One presents the eccentricity, 2 presents the closeness centrality, 3 presents the harmonic closeness centrality, four presents the betweenness centrality, 5 presents the clustering coefficient, and 6 presents the strength.
Small World
As explained earlier, we use a fast modular method to cluster nodes in the networks. The results are shown in Figure 5. The densities of the three networks and the number of subgroups are similar.
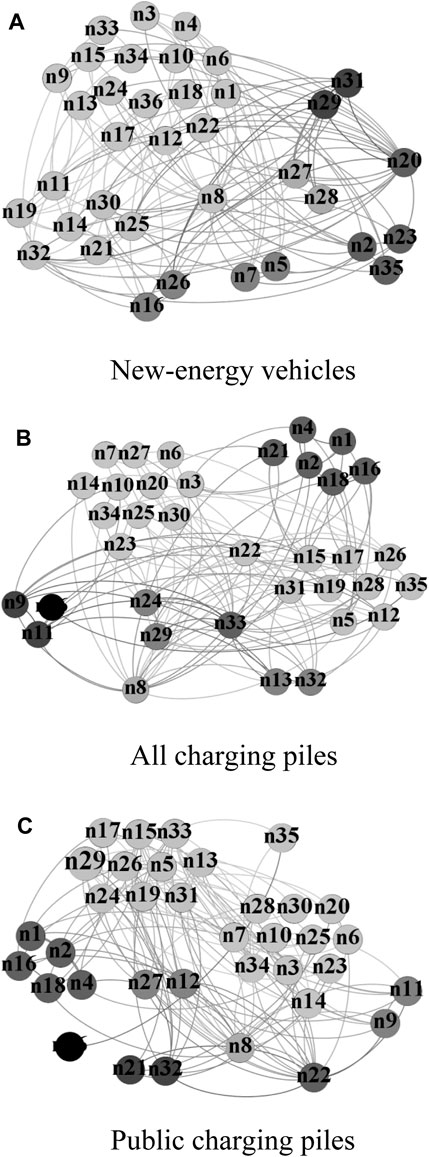
FIGURE 5. Clustering of the three networks (where n1 to n36 represent individual months from May 2016 to April 2019).
Although the numbers are largely similar, we find that there are more subgroups in the network of new-energy vehicles than in the network of charging piles. This is because when we conduct the clustering, if data are relatively flat with a lower peak value, the network distance increases over time, such that the clustering results have more subgroups.
Figure 5 shows that, in the three clustering networks, N8 is distinct, which is consistent with the peak in December 2016 for the underlying trend. At this time, the government issued a notice on accelerating the construction of charging piles and supporting facilities for EVs in residential areas.
Overall, however, the results of clustering in these three networks reveal that the development of the network of EVs and that of the network of the piles are in fact inconsistent. The nodes in each subgroup are largely different, and there is therefore still much to do for the pace of manufacture of piles to catch that of EVs.
Distribution of the Degree of Centrality
The power law distribution is a common statistical phenomenon. Fitting parameters for power law distributions are given in Table 4.
Figure 6 and Table 4 show that the distributions of the degree of centrality of new-energy vehicles, total charging piles, and public charging piles follow power laws, with more time nodes and fewer connected edges, and the number of nodes decreases with an increase in the degree of centrality. This clearly indicates that the networks of new-energy vehicles and charging piles are small-world networks and that the manufacture of new-energy vehicles and charging piles will be greatly affected by external factors at critical moments.
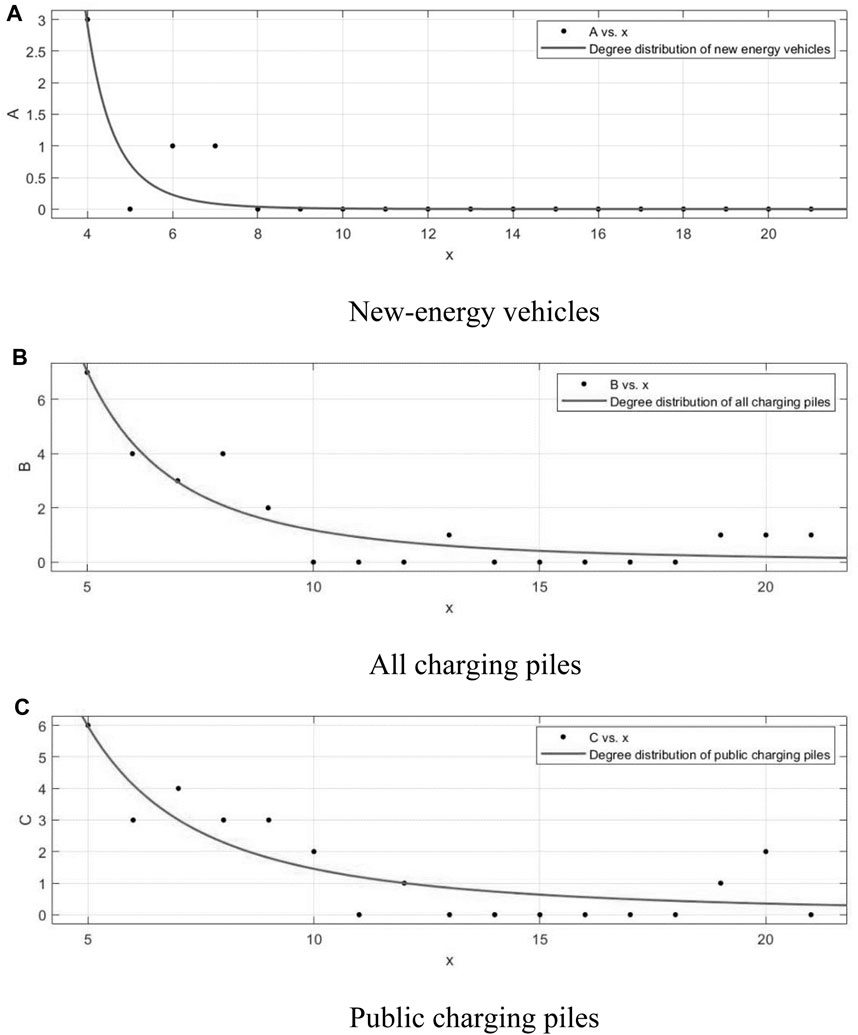
FIGURE 6. Degree distributions of new-energy vehicles, all charging piles, and public charging piles.
The sales of fuel-powered cars were in the middle of a slump in 2018, but China’s new-energy automobile market grew in 2018 relative to sales in 2016 and 2017. This contrast is closely related to a number of new-energy vehicle subsidies (e.g., a tax exemption for the purchase of new-energy automobile vehicles, tariff cuts of reversed transmission enterprise technology upgrades, and double integral policy). This correspondence shows the importance of promoting government policy.
Complex Network Clustering of Provinces
Figure 7 shows that in the development of charging pile networks, Hunan Province had the highest betweenness centrality, Jiangxi Province had the lowest closeness centrality, clustering, and degree, and Shanxi Province and Qinghai Province had the highest degree of centrality.
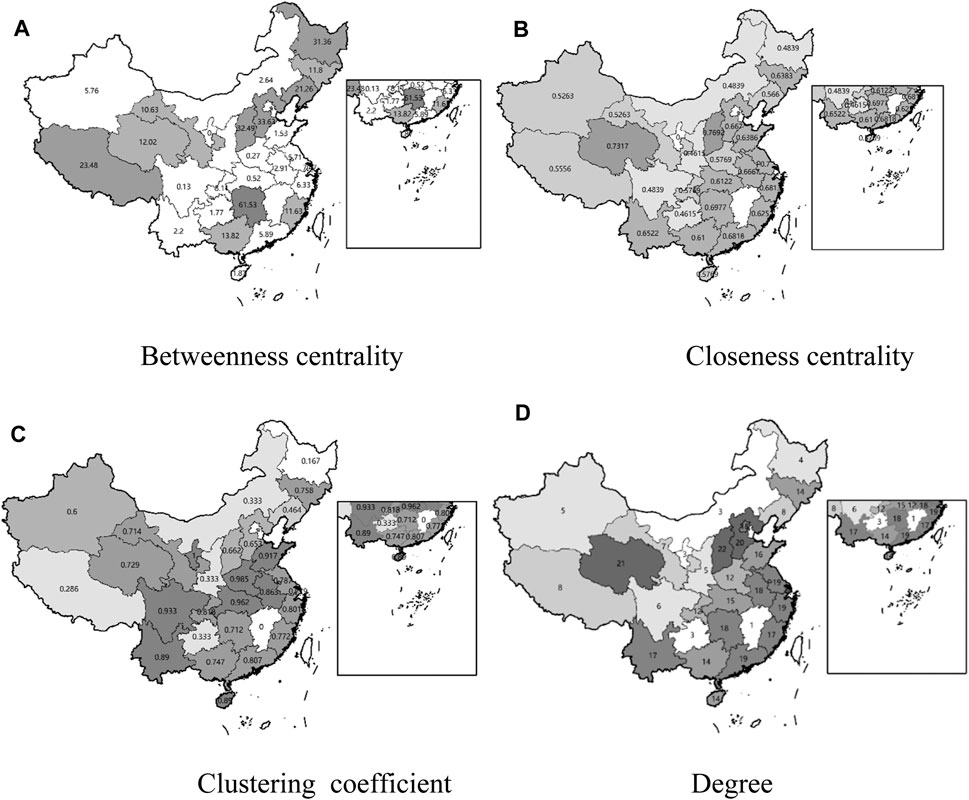
FIGURE 7. (A) Betweenness centrality, (B) closeness centrality, (C) clustering, and (D) degree of centrality for all provinces in China.
The developmental trends for 2016 to 2019 can be divided into four stages, which are basically the four natural years. The figure shows that the manufacturing of new-energy vehicles and charging piles in China is accelerating year by year.
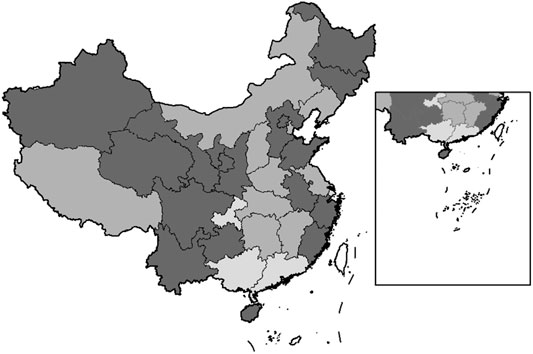
The visualization of the monthly increase in the number of public charging piles for China’s new-energy vehicles in Figure 8 shows that the clustering results for China’s provinces can be divided into three categories.
The first category includes Anhui Province, Beijing, Fujian Province, Gansu Province, Guangdong Province, Hainan Province, Hebei Province, Henan Province, Hubei Province, Jiangsu Province, Qinghai Province, Shandong Province, Shanxi Province, Shanghai, Tianjin, Yunnan Province, Zhejiang Province, and Chongqing. The results show that the closeness centrality and degree of centrality of these provinces, which are accelerating development areas in Guidance on the Development of Electric Vehicle Charging Infrastructure 2015–2020 issued by the National Development and Reform Commission of China in 2015, are relatively high. These provinces have a good foundation for the development of EVs in that they have a large population base and a high population density and require intensive haze control. The local governments of these provinces have formulated and implemented relevant policies earlier and more frequently to guide the development of new-energy vehicles and charging piles. In addition, Beijing, Tianjin and Hebei, and the Yangtze River Delta and the Pearl River Delta are three key areas for haze prevention and control. In particular, Beijing, Shanghai, Jiangsu, and Guangdong have formulated many policies of promoting new-energy vehicles and charging piles for different application scenarios.
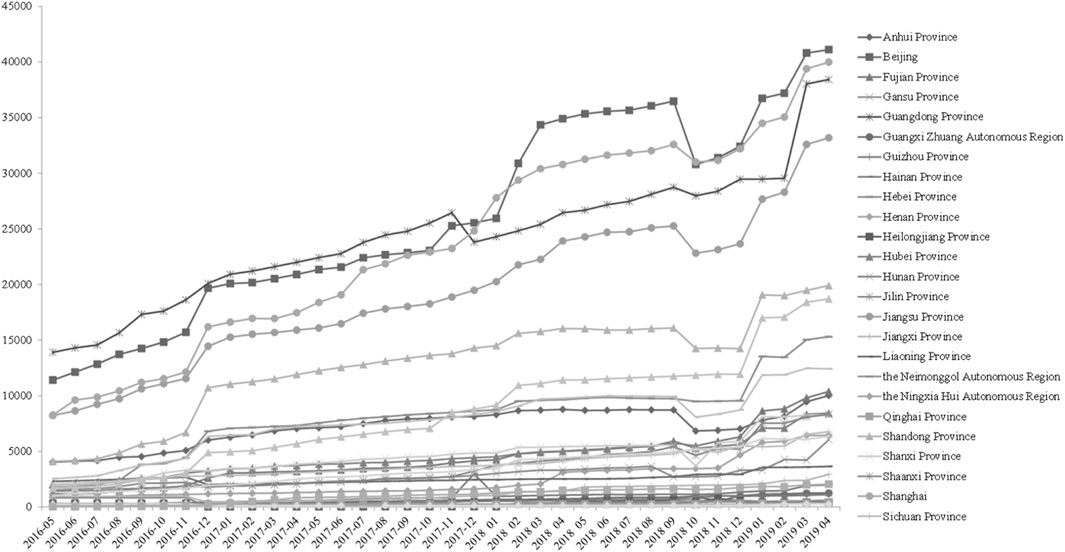
In Figure 9, Beijing is at the top of the number of public charging piles. In April 2019, the number of public charging piles in Beijing reached 930,000, in particular because of the serious air pollution and the urgent need for governance. Local government in Beijing has issued a series of policies related to car purchase subsidies and welfare for new-energy vehicles. As an example, there is a lottery for the purchase of new-energy vehicles, which drives the use of new-energy vehicles. Additionally, Beijing considered the construction and use of charging piles earlier and more thoroughly than other provinces. In Shunyi District of Beijing, construction units of public charging facilities that meet the requirements of the state and municipality may apply for government subsidies, and new-energy vehicles using public charging piles are given a charging service fee subsidy. Overall, Beijing’s new-energy development is policy driven.
Meanwhile, the use of new-energy vehicles and charging piles in Guangdong Province, which ranks the second, is technology driven. Guangdong Province is home to many high-tech new-energy car manufacturers, such as China’s leading new-energy car company, BYD, which is headquartered in Shenzhen. The local technological atmosphere supports the development of new-energy cars and charging piles in the province.
Qinghai Province, Gansu Province, and Yunnan Province have weak industrial foundations, insufficient research and development capacities, insufficient promotion policies, lagging infrastructure, and unimproved market environments. However, they all have a place in the industrial chain of energy resources and new-energy vehicles and charging piles. These provinces are energy-driven. Although the development of charging piles in Qinghai Province started relatively late, the province’s clean-energy resources have broad application prospects in the province’s new-energy vehicle charging service business, and there are thus similarities between Qinghai Province and areas of accelerating development in terms of the overall development trend. Additionally, Yunnan Province has unique advantages because of its energy resources. The local government of Yunnan Province attaches importance to the active development of smart services, closely follows the pace of development in the region, formulates and implements development plans, and is committed to combining the tourism resources of the province with the development of new-energy vehicles. For instance, at tourist distribution centers and key scenic spots, tourist buses, shared cars, and self-driving camps (bases) will be built, and regional charging networks will be created to realize intelligent travel, “a mobile phone to travel in Yunnan”. Therefore, although there is a gap between the number of charging piles and the provinces in the eastern region, the trend of development is fast.
The second category includes the Xinjiang Uygur Autonomous Region, Tibet Autonomous Region, Inner Mongolia Autonomous Region, Shaanxi Province, Liaoning Province, Jilin Province, and Heilongjiang Province. These areas are mainly northwestern and northeastern provinces in which the development of the charging pile network started relatively late, mostly from 2017 to 2019. We take the northeastern provinces as an example. Many automobile industry bases were set up in northeastern China when new China was first founded. However, the technologies of fuel energy are now somewhat backward, and the existing industrial base in northeastern China has resulted in a slow conversion from old to new ways of generating kinetic energy. In addition, as established industries are important to local employment, the local government pays little attention to new industries, and the development of new-energy vehicles and charging piles has been slow. The northwestern provinces and regions, such as the Xinjiang Uygur Autonomous Region, Tibet Autonomous Region, and Inner Mongolia Autonomous Region, are characterized by a vast areas of land and sparse populations. Moreover, there are many ethnic minorities and strong ethnic traditions. The new-energy vehicle market space is small and the costs of constructing charging piles are high in these regions. The cities have weak development potential except for the provincial capitals and some larger cities.
In contrast with accelerating the construction of charging piles in developing regions, the main purpose of constructing public charging piles in the regions of the second category is to further improve the convenience of transportation, thus strengthening connectivity, accelerating regional development, and gradually building a national inter-city fast-charging network based on expressways.
The third category includes Sichuan Province, Guizhou Province, and the Guangxi Zhuang Autonomous Region. The development of the new-energy vehicle charging pile network began reasonably early, around 2016, in each of these three provinces. However, none of the provinces has advantages in the industrial chain, and the automobile industry is weak in these provinces. At the same time, owing to the renewal of new-energy vehicles in the eastern regions, old fuel-based vehicles have been eliminated, which have emission specifications superior to the existing ones in the western region. These old vehicles are therefore flowing into the western market because their second-hand transaction prices are lower, squeezing the already insufficient space for EVs in the car market. In addition, the geographical conditions of these provinces are a major disadvantage to the adoption of new-energy vehicles and charging piles. Rugged terrain accelerates the power consumption of new-energy vehicles, and the planning and construction efficiency of charging piles is limited. There is thus little motivation to purchase new-energy vehicles, and the overall development of the EV network is slow relative to the development of the economic base.
Conclusion
This paper used time series data for May 2016 to April 2019 to build a complex network and used characteristic data for the network to obtain supplementary information, so as to establish a new effective connection between the time series and the complex network. The results show that the overall speeds of development of networks of new-energy vehicles and charging piles in China are similar, but the speed of development of the charging pile network is relatively slow. Moreover, both the networks of new-energy vehicles and charging piles are greatly affected by special events, such as policy implementations, and it is thus crucial to formulate policies that can be effectively implemented.
China is in the background of “New Infrastructure”. We carried out cluster analysis on provincial data of public charging piles after time-series visualization, considering that relevant industrial development policies are mostly formulated by provincial governments. The results of the research are summarized as follows. 1) Regional factors play a dominant role in the development of networks of new-energy vehicles and charging piles. A basic regional characteristic of China is that the eastern provinces are more developed than the western provinces, which is obviously reflected in the clustering results. The eastern developed provinces, with a high degree of urbanization, high population densities, and superior economic foundations, have good application conditions for the development of networks of new-energy vehicles and charging piles in that they have a broad market space and rapid socioeconomic development. 2) Whether a province occupies a place in the industrial chain of new-energy vehicles and charging piles and how important it is in the industrial chain strongly affect the situation of local construction. In the case of the upstream provinces, the reserves of energy resources and the difficulty of collection are important. In the case of the downstream provinces, the ability to conduct research and development and the technical level of relevant enterprises are important. 3) National and local industrial policies play an important role in the development of networks of new-energy vehicles and charging piles. In 2018, various ministries and commissions in China issued a series of policies that promoted the rapid development of networks of new-energy vehicles and charging piles. As an example, the Ministry of Industry and Information Technology issued the Notice on Strengthening the Administration of The Catalogue of New-energy Vehicles Exempted from Vehicle purchase Tax (Draft for Comments). Additionally, the Ministry of Finance, Ministry of Science and Technology, and Development and Reform Commission issued “On the adjustment to perfect the new energy automobile application finance subsidy policy notice”, a national department would raise technical threshold requirements, perfect the subsidy standard requirements, and adjust the operating range to the new-energy vehicles subsidies.
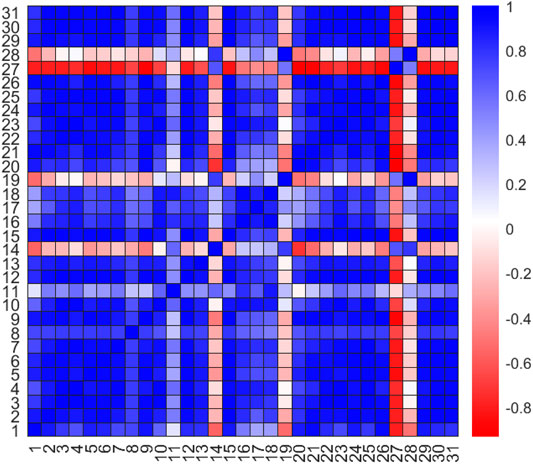
Overall, the outlook of the domestic new-energy vehicle market in China remains good, and the development potential is extremely large. With the replacement of social energy and on the basis of the good development prospects of China’s new-energy vehicles, charging piles will inevitably be adopted broadly as the supplemental energy infrastructure of new-energy vehicles. Provinces that are developing rapidly need to further improve the efficiency of charging pile construction. The construction of charging piles of new-energy vehicles and the development of new-energy vehicles promote and restrict each other. To further develop the network of new-energy vehicles, the premise must be to reduce the ratio of the vehicle pile. Provinces that are developing slowly need to upgrade their industrial structures in light of local conditions and enhance the conditions for new-energy applications. Figure 10 shows the similarity of EV development between provinces in China.
We suggest that government have an in-depth understanding of the local application basis, geographical factors, cultural factors, and other application conditions before making future policies. The government should set reasonable development goals, actively implement a subsidy policy for the construction of new-energy vehicle charging piles, and scientifically guide the construction of EV charging infrastructure. We suggest that in the future construction of charging piles, enterprises consider reasonable construction that balances supply and demand and combines with new intelligent infrastructure and the Internet of things. As an example, the sharing mode can be combined with the operation of charging piles. Through win–win cooperation among the government, enterprises, and users, it will be possible to promote the rapid development of the EV industry and create a better air environment.
The present study adopted a single index to analyze China’s use of new-energy vehicles and charging piles owing to the limitations of the data breadth, scale, and accuracy. In future studies, we will further collect data of relevant indicators and use complex networks in coupled analysis to explore in detail the reasons for variations in development across provinces and cities.
Data Availability Statement
The original contributions presented in the study are included in the article/supplementary material, further inquiries can be directed to the corresponding author.
Author Contributions
MW conceived the research. FW designed the analyses and compiled the data. JC conducted the analyses. MW, FW and JC wrote the paper. All authors read and approved the final manuscript.
Conflict of Interest
The authors declare that the research was conducted in the absence of any commercial or financial relationships that could be construed as a potential conflict of interest.
Publisher’s Note
All claims expressed in this article are solely those of the authors and do not necessarily represent those of their affiliated organizations, or those of the publisher, the editors and the reviewers. Any product that may be evaluated in this article, or claim that may be made by its manufacturer, is not guaranteed or endorsed by the publisher.
Footnotes
1All data of EVs in China were collected from online sources from website of EVCIPA (http://www.evcipa.org.cn/)
References
1. Huo H, Zhang Q, Wang MQ, Streets DG, He K. Environmental Implication of Electric Vehicles in China. Environ Sci Technol (2010) 44(13):4856–61. doi:10.1021/es100520c
2. Gong H, Wang MQ, Wang H. New Energy Vehicles in China: Policies, Demonstration, and Progress. Mitig Adapt Strateg Glob Change (2013) 18(2):207–28. doi:10.1007/s11027-012-9358-6
3.IEA. Stock of Fast Public Electric Light Duty Vehicles Chargers, 2015–2020. Paris: IEA (2020). Available at: https://www.iea.org/data-and-statistics/charts/stock-of-fast-public-electric-light-duty-vehicles-chargers-2015-2020 (Accessed July 20, 2021).
4. Hardman S, Jenn A, Tal G, Axsen J, Beard G, Daina N, et al. A Review of Consumer Preferences of and Interactions with Electric Vehicle Charging Infrastructure. Transportation Res D: Transport Environ (2018) 62:508–23. doi:10.1016/j.trd.2018.04.002
5. Faria MV, Baptista PC, Farias TL. Electric Vehicle Parking in European and American Context: Economic, Energy and Environmental Analysis. Transportation Res A: Pol Pract (2014) 64:110–21. doi:10.1016/j.tra.2014.03.011
6. Schuitema G, Anable J, Skippon S, Kinnear N. The Role of Instrumental, Hedonic and Symbolic Attributes in the Intention to Adopt Electric Vehicles. Transportation Res Part A: Pol Pract (2013) 48:39–49. doi:10.1016/j.tra.2012.10.004
7. Larson PD, Viáfara J, Parsons RV, Elias A. Consumer Attitudes about Electric Cars: Pricing Analysis and Policy Implications. Transportation Res Part A: Pol Pract (2014) 69:299–314. doi:10.1016/j.tra.2014.09.002
8. He J, Zhang L, Hu R, Xie Y(2020). “Optimal Site Selection Planning of EV Charging Pile Based on Genetic Algorithm,” in: 2020 IEEE 5th Information Technology and Mechatronics Engineering Conference (ITOEC); June 12–14, 2020; Chongqing, China. 1799–803.
9. Zhang X, Bai X. Incentive Policies from 2006 to 2016 and New Energy Vehicle Adoption in 2010-2020 in China. Renew Sustain Energ Rev (2017) 70:24–43. doi:10.1016/j.rser.2016.11.211
10. Lee DH, Park SY, Kim JW, Lee SK. Analysis on the Feedback Effect for the Diffusion of Innovative Technologies Focusing on the green Car. Technol Forecast Soc Change (2013) 80(3):498–509. doi:10.1016/j.techfore.2012.08.009
11. Sierzchula W, Bakker S, Maat K, van Wee B. The Influence of Financial Incentives and Other Socio-Economic Factors on Electric Vehicle Adoption. Energy Policy (2014) 68:183–94. doi:10.1016/j.enpol.2014.01.043
12. Coad A, de Haan P, Woersdorfer JS. Consumer Support for Environmental Policies: An Application to Purchases of green Cars. Ecol Econ (2009) 68(7):2078–86. doi:10.1016/j.ecolecon.2009.01.015
13. Zhang X, Wang K, Hao Y, Fan J-L, Wei Y-M. The Impact of Government Policy on Preference for NEVs: The Evidence from China. Energy Policy (2013) 61:382–93. doi:10.1016/j.enpol.2013.06.114
14. Li W, Long R, Chen H. Consumers' Evaluation of National New Energy Vehicle Policy in China: An Analysis Based on a Four Paradigm Model. Energy Policy (2016) 99:33–41. doi:10.1016/j.enpol.2016.09.050
15. She Z-Y, Sun Q, Ma J-J, Xie B-C. What Are the Barriers to Widespread Adoption of Battery Electric Vehicles? A Survey of Public Perception in Tianjin, China. Transport Policy (2017) 56:29–40. doi:10.1016/j.tranpol.2017.03.001
16. White LV, Sintov ND. You Are what You Drive: Environmentalist and Social Innovator Symbolism Drives Electric Vehicle Adoption Intentions. Transportation Res Part A: Pol Pract (2017) 99:94–113. doi:10.1016/j.tra.2017.03.008
17. Hu J, Xia C, Li H, Zhu P, Xiong W. (2020). Properties and structural analyses of USA’s regional electricity market: A visibility graph network approach. Applied Mathematics and Computation 385, 125434. doi:10.1016/j.amc.2020.125434
18. Cui X, Hu J, Ma Y, Wu P, Zhu P, Li H-J. (2021). Investigation of stock price network based on time series analysis and complex network. International Journal of Modern Physics B 35(13):2150171. doi:10.1142/S021797922150171X
19. Qiao H.-H, Deng Z.-H, Li H.-J, Jin N-D, Hu J, Song Q, Gao L. (2021). Research on historical phase division of terrorism: An analysis method by time series complex network. Neurocomputing 420, 246–265. doi:10.1016/j.neucom.2020.07.125
20. Lacasa L, Luque B, Ballesteros F, Luque J, Nuño JC. From Time Series to Complex Networks: The Visibility Graph. Proc Natl Acad Sci (2008) 105(13):4972–5. doi:10.1073/pnas.0709247105
21. Gao Z-K, Fang P-C, Ding M-S, Jin N-D. Multivariate Weighted Complex Network Analysis for Characterizing Nonlinear Dynamic Behavior in Two-Phase Flow. Exp Therm Fluid Sci (2015) 60:157–64. doi:10.1016/j.expthermflusci.2014.09.008
22. Sanjiv S, Purohit GN. A New Centrality Measure for Tracking Online Community in Social Network. Int J Inf Technol Comput Sci (2012) 4:47–53. doi:10.5815/ijitcs.2012.04.07
23. Dangalchev C. Residual Closeness in Networks. Physica A: Stat Mech its Appl (2006) 365(2):556–64. doi:10.1016/j.physa.2005.12.020
24. Ruhnau B. Eigenvector-centrality - a Node-Centrality? Social Networks (2000) 22(4):357–65. doi:10.1016/S0378-8733(00)00031-9
25. Costa LDF, Rodrigues FA, Travieso G, Villas Boas PR. Characterization of Complex Networks: A Survey of Measurements. Adv Phys (2007) 56(1):167–242. doi:10.1080/00018730601170527
Keywords: complex network, EV charging piles, visibility graph, policy effects, new energy vehicles
Citation: Wang M, Wu F and Chen J (2021) Comprehensive Analyses of the Spatio-Temporal Variation of New-Energy Vehicle Charging Piles in China: A Complex Network Approach. Front. Phys. 9:755932. doi: 10.3389/fphy.2021.755932
Received: 09 August 2021; Accepted: 05 October 2021;
Published: 25 October 2021.
Edited by:
Peican Zhu, Northwestern Polytechnical University, ChinaCopyright © 2021 Wang, Wu and Chen. This is an open-access article distributed under the terms of the Creative Commons Attribution License (CC BY). The use, distribution or reproduction in other forums is permitted, provided the original author(s) and the copyright owner(s) are credited and that the original publication in this journal is cited, in accordance with accepted academic practice. No use, distribution or reproduction is permitted which does not comply with these terms.
*Correspondence: Junhua Chen, anVuaHVhY2hlbkBjdWZlLmVkdS5jbg==
 Maoze Wang
 Fan Wu
 Junhua Chen