 Lei Hou
 Yaodong Wang
 Junnan Wang
 Lei Yang
 Wei Shi
- The Key Laboratory of Ultrafast Photoelectric Technology and Technology and Terahertz Science in Shaanxi, Xi’an University of Technology, Xi’an, China
Discharge gases have been used to detect terahertz (THz) waves, however, there are few relevant theoretical studies. The neon glow discharge model is established by COMSOL Multiphysics software, the characteristics of glow discharged neon and the interaction of the discharged gas with THz waves were investigated. The results show that with the increase of THz wave’s frequency, the transmittance increases, the change of plasma discharge characteristics caused by THz wave can be used for THz wave detection. The results provide a theoretical basis for the development of cheap, room temperature THz wave detector with fast response speed, and high sensitivity.
Introduction
Terahertz (THz) radiation spanning from 0.1 to 10 THz falls between the microwave and infrared spectral ranges [1]. In recent years, THz technology applications have been rapidly expanding in areas including nondestructive material evaluation, imaging, sensing, and wireless communication [2]. In the development of THz technology, how to detect THz radiation efficiently is of great significance to the progress of THz technology.
At present, commercial room temperature THz detectors, including Golay cells, pyroelectric detectors and Schottky diodes, have the disadvantages of slow speed, limited bandwidth or high price, so they are difficult to be widely used in THz community [3]. In 1952, the glow discharge plasma was used to detect microwave radiation [4]. It was later discovered that glow discharge plasma can also be used for detection in THz, infrared and ultraviolet bands ( [5, 6]). The glow discharge detectors (GDD) based on commercial neon lamps are potential detectors with high sensitivity. In addition, the use of glow discharge plasma to detect THz radiation has the advantages of low cost, wide dynamic range, wide spectral range, room temperature operation, and simple use [7].
The interaction between gas discharge plasma and electromagnetic waves has been investigated in the infrared and microwave bands [8–13]. These preliminary studies have shown that far infrared radiation with relatively high field amplitudes can be detected by GDDs, and the detection mechanism is attributed to the incident far infrared radiation increasing the energy of the plasma, which increase the discharge current. The detection of THz radiation by GDDs can be explained by the interaction of THz wave and plasma in discharge gases. Since the frequency of the glow discharge plasma in a commercial neon lamp is about a few GHz [7], the plasma is almost transparent to the incident THz radiation. In the neon lamp, the strong electric field of the applied voltage will cause the electrons to move from the cathode to the anode, the incident THz wave is absorbed by free electrons and this process cause the discharge current to slightly changes, the sign of the change depends on which of the enhanced ionization and enhanced diffusion mechanisms is dominant in the detection mechanism [14]. Ref. 15 have shown that the main mechanism for detecting THz radiation with GDDs is to enhance cascade ionization, which causes an increase in discharge [15]. The transmission of THz wave decreasing with increasing bias voltage for certain frequencies [16].
In this paper, we provided a theoretical basis for the development of a new type of THz wave detector based on neon glow discharge by investigating the characteristics of neon glow discharge and its interaction with THz waves.
Characteristics of Neon Discharge
2D Neon Discharge Model
In this work, we use the plasma module in COMSOL Multiphysics software to establish the neon discharge model, and obtain the plasma characteristic parameters and electric field distribution parameter diagram, and verify whether the model realizes the glow discharge and the feasibility of the model by comparing with the existing theoretical and experimental results.
Assuming that the system is in an ideal plasma environment, the plasma discharge area is filled with pure neon gas. A two-dimensional axisymmetric model was established as shown in Figure 1. The outer length of the model is
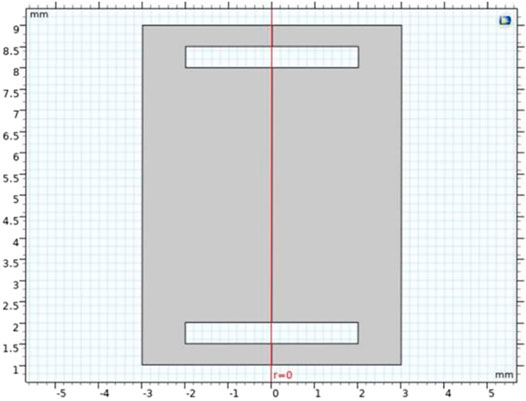
FIGURE 1. 2D structure of gas discharge model.
The discharge area includes discharge module, particle drift diffusion module and energy module.
Discharge module: Neon’s discharge region includes four kinds of particles, namely electron
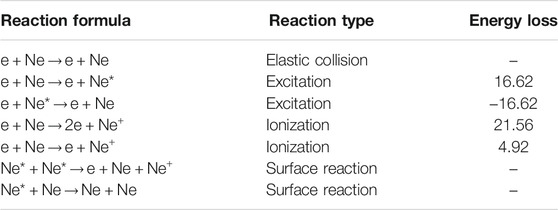
TABLE 1. Reaction formulas and reaction types in discharge process of neon gas.
Ion drift diffusion module: it contains the electron drift diffusion equation and the input of model parameters, the setting of gas temperature, gas pressure and reduced electron mobility parameters.
Energy module: it includes insulation surface, initial value, metal contact (anode), grounding (cathode), dielectric contact, wall, as so on. The initial value is the initial electron density and the applied voltage value. Metal contact include the setting of type setting and circuit type setting. The circuit types include RC circuit, ballast resistance, DC isolation resistance and DC isolation capacitor. In this paper, we choose RC circuit.
Simulation Results of Neon Discharge Characteristics
According to the volt-ampere characteristic curve of gas discharge, at first, due to the migration movement of electrons and positive ions, a small current is generated in the discharge tube, and the space charge formed by positive ions is conducive to the movement of electrons towards the anode in the tube. As the electrons slowly gather at the anode, they collide and ionize frequently with the gas atoms near the anode, and a large number of electrons and positive ions generate. The electrons continue to collide with the gas atoms, and the positive ions move to the cathode under the action of the electric field, bombard the cathode and emit secondary electrons, which then collide with the gas particles. And finally the discharge reaches a stable state.
In the 2D Neon discharge model, the electrode spacing is set to
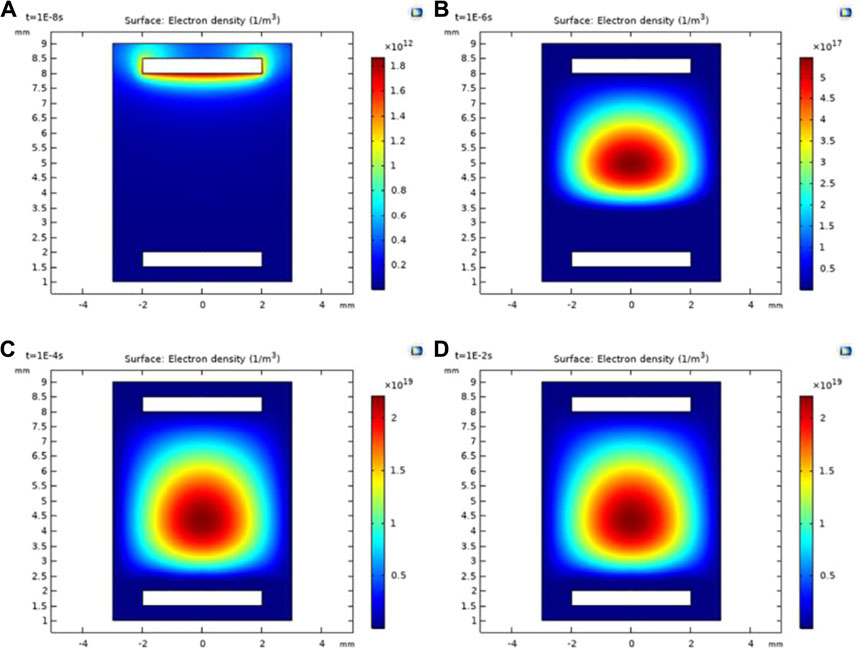
FIGURE 2. Distributions of electron density at different times. (A)
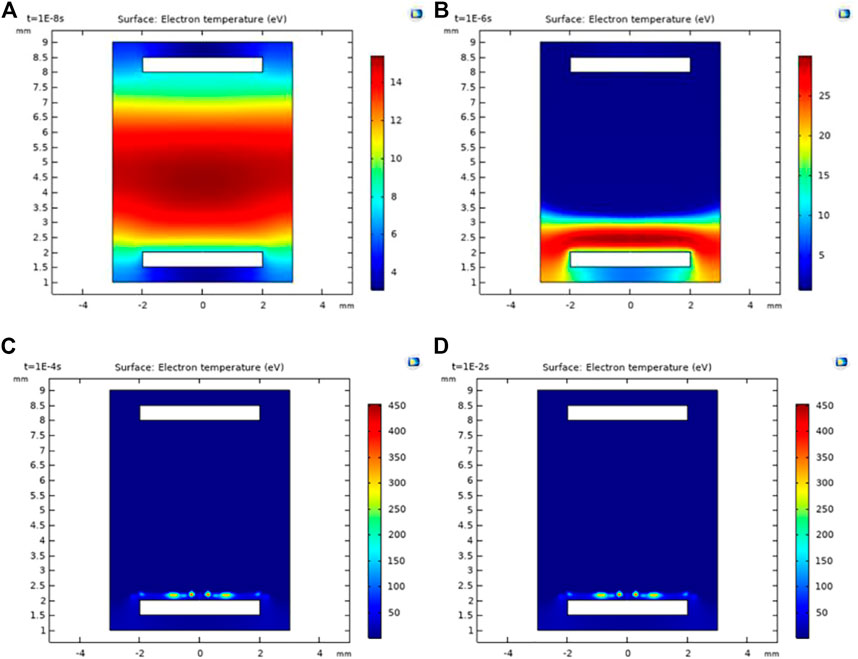
FIGURE 3. Electron temperature distribution at different times. (A)
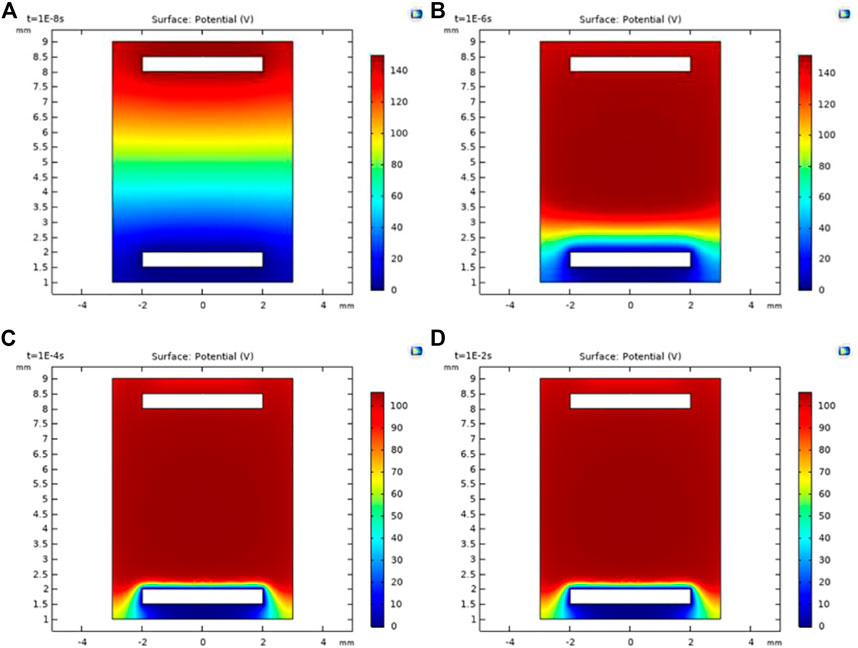
FIGURE 4. Electric potential distribution at different times. (A)
Figure 2 shows the distribution of electron density at different time. In Figure 2A
Figure 3 shows the distribution of electron temperature at different time. Electron temperature is used to describe the thermal energy of particles. In Figure 3A, when
Figure 4 shows the distribution of electric potential at different time. In Figure 4A, when
According to the analysis of simulation results, our model is consistent with the glow discharge theory, so the model can be used to simulate a gas glow discharge. In our simulation, we have simulated the glow discharge respectively when the electrode spacing is
Simulation of Interaction of Neon Discharge and THz Wave
Simulation Model
Based on the results of part 2, we established the interaction model of neon gas and THz wave as shown in Figure 5. The model is divided into five regions. Region one is the incident region; region 2 is the transmission region with a size of
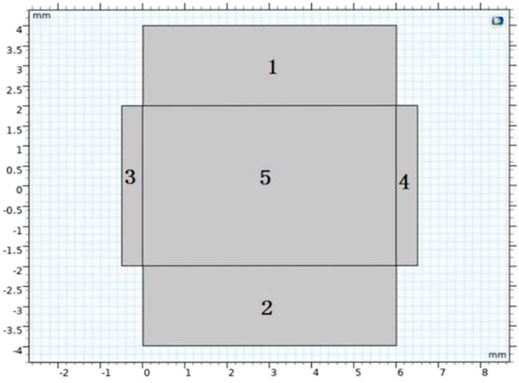
FIGURE 5. Model of interaction of discharged neon and THz wave.
The Influence of Frequency of THz Waves on Glow Discharge
We suppose that the electric field is no loss in the incident area. When the THz wave illuminates the discharge area, the part of incident energy is absorbed by the electrons, which will enhance the interaction between the charged particles and the neutral particles in the discharge area. The temperature of the electrons rises to the extent that new electrons can be generated through ionization, and the ionization rate is increased. With the increase of the kinetic energy of electrons, the ionization rate and the number of electrons increases, which increases the frequency of collisions between electrons and neutral particles. The effect of frequency on the interaction between THz wave and plasma was investigated by simulating the electric field distribution of THz wave with different THz frequencies before and after passing through the neon discharge region. The simulated results are shown in Figures 6A,C,E.
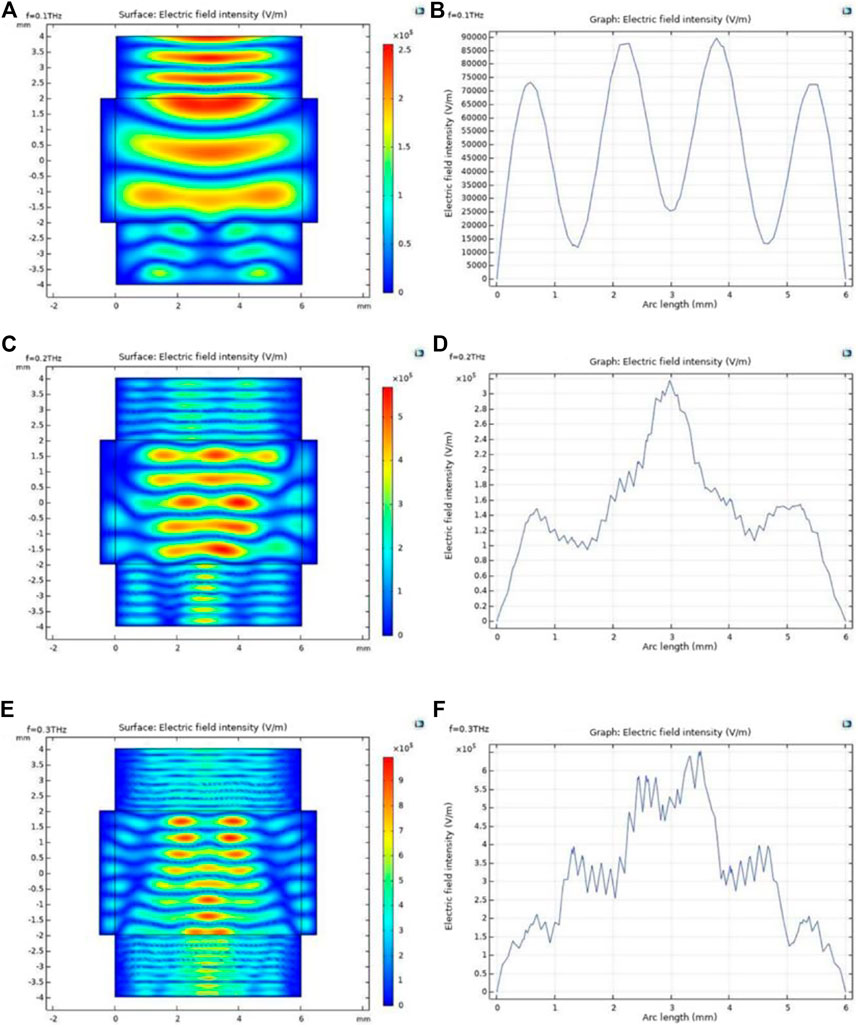
FIGURE 6. Electric filed intensity distribution of discharge interval (left column) and the distribution of THz electric field along the horizontal line of y = −2.5 mm after it passing through the discharge region (right column) at different THz frequencies. (A,B)
Take a horizontal line parallel to the discharge section at
When the THz wave enters the discharge region, the plasma absorbs the energy of the THz wave to improve its internal energy, collision frequency increases, and a large number of electrons, neon ions and excited neon atoms are constantly produced. After that, high-energy electrons and excited neon atoms are consumed in large quantities, new electrons generated and the electron density in the discharge region increases. The external energy input is difficult to maintain the frequent and violent inelastic collision reaction, and the plasma gradually reaches a new balance. It can be seen from the Figure 6, the peak value of the electric field intensity distribution curve is increasing and different peaks appear. The reason is that the interaction of electrons and neutral particles in the plasma is strengthened, which leads to the decrease of energy absorbed by electrons from THz waves with the increase of frequencies. The transmittance of THz wave increases in the discharge region, and the electric field intensity increases in the transmission region. The absorbed THz waves change the plasma density and the potential between the two electrodes also will changes, the THz intensity can be detected according the potential change.
Conclusion
In this paper, the discharge characteristics of neon and its interaction with THz wave are simulated. The neon glow discharge model is established by COMSOL Multiphysics software, and the results are consistent with the glow discharge theory. Then, the neon glow discharge model with stable discharge interval is obtained. Finally, based on the neon glow discharge model, the THz electric field intensities of THz wave passing through the discharge region under different terahertz wave frequencies are investigated. The results show that with the increase of THz frequency, the transmittance of terahertz wave is strong and the loss decreases. The results of the paper provide a theoretical basis for the development of cheap, room temperature THz wave detector with fast response speed, and high sensitivity.
Data Availability Statement
The raw data supporting the conclusions of this article will be made available by the authors, without undue reservation.
Author Contributions
LH: Conceptualization, Methodology, Writing-Reviewing and Editing; YW: Investigation, Simulation, Writing-Original Draft; JW: Investigation, Results analysis; LY: Methodology; WS: Conceptualization. All authors agree to be accountable for the content of the work.
Funding
This work was supported by the National Natural Science Foundation of China (grant numbers 62075179, 61575161); the Natural Science Foundation of Shaanxi Province (grant number 2019JZ-04); the Shaanxi Key Laboratory of Ultrafast Photoelectronic Technology and Terahertz Science (grant number 2018SZS-06); the Xi’an Key Laboratory of Ultrafast Photoelectronic Device Technology (grant number 201805055ZD6CG39).
Conflict of Interest
The authors declare that the research was conducted in the absence of any commercial or financial relationships that could be construed as a potential conflict of interest.
Publisher’s Note
All claims expressed in this article are solely those of the authors and do not necessarily represent those of their affiliated organizations, or those of the publisher, the editors and the reviewers. Any product that may be evaluated in this article, or claim that may be made by its manufacturer, is not guaranteed or endorsed by the publisher.
References
1. Siegel PH. Terahertz Technology. IEEE Trans Microwave Theor Techn (2002) 50(3):910–28. doi:10.1109/22.989974
2. Jia W, Liu M, Lu Y, Feng X, Wang Q, Zhang X, et al. Broadband Terahertz Wave Generation from an Epsilon-Near-Zero Material. Light Sci Appl (2021) 10(1):11. doi:10.1038/s41377-020-00452-y
3. Lewis RA. Terahertz Imaging and Spectroscopy Methods and Instrumentation. Encyclopedia Spectrosc Spectrom (2017) 422–6. doi:10.1016/B978-0-12-409547-2.12146-8
5. Severin PJW, van Nie AG. A Simple and Rugged Wide-Band Gas Discharge Detector for Millimeter Waves. IEEE Trans Microwave Theor Techn (1966) 14(9):431–6. doi:10.1109/TMTT.1966.1126292
6. Lei H, Zhang XC. Broadband Detector Measures IR, Millimeter & THz Waves. In: 2009 34th International Conference on Infrared, Millimeter, and Terahertz Waves IEEE (2009) doi:10.1109/ICIMW.2009.5325580
7. Kopeika NS. Glow Discharge Detection of Long Wavelength Electromagnetic Radiation: Cascade Ionization Process Internal Signal Gain and Temporal and Spectral Response Properties. IEEE Trans Plasma Sci (1978) 6(2):139–57. doi:10.1109/TPS.1978.4317104
8. Ferrari RL. Plasma Diagnostic Techniques. Edited by R. H. Huddlestone and S. L. Leonard. Academic Press, 1965, Pp. 627, $19.50. J Plasma Phys (1967) 1(01):156. doi:10.1017/s0022377800003160
10. Kopeika NS, Farhat NH. Video Detection of Millimeter Waves with Glow Discharge Tubes: Part I—Physical Description; Part II—Experimental Results. IEEE Trans Electron Devices (1975) 22(8):534–48. doi:10.1109/t-ed.1975.18175
11. Abramovich A, Kopeika NS, Rozban D, Farber E. Inexpensive Detector for Terahertz Imaging. Appl Opt (2007) 46(29):7207–11. doi:10.1364/ao.46.007207
12. Abramovich A, Kopeika NS, Rozban D. THz Polarization Effects on Detection Responsivity of Glow Discharge Detectors (GDDs). IEEE Sensors J (2009) 9(10):1181–4. doi:10.1109/JSEN.2009.2027415
13. Hou L, Park H, Zhang X-C. Terahertz Wave Imaging System Based on Glow Discharge Detector. IEEE J Select Top Quan Electron. (2011) 17(1):177–82. doi:10.1109/JSTQE.2010.2045640
14. Alasgarzade N, Nebioğlu MA, Takan T, Uzun-Kaymak IU, Sahin AB, Altan H. Investigating Glow Discharge Detectors as a Millimeter-Wave/Terahertz Radiation Detection Tool. In: M. Pereira, and O. Shulika, editors THz for CBRN and Explosives Detection ans Diagnosisa. NATO Science for Peace and Security Series B: Physics and Biophysics. Dordrecht: Springer (2017). doi:10.1007/978-94-024-1093-8_21
15. Rozban D, Kopeika NS, Abramovich A, Farber E. Terahertz Detection Mechanism of Inexpensive Sensitive Glow Discharge Detectors. J Appl Phys (2008) 103(9): 093306–343. doi:10.1063/1.2917386
Keywords: terahertz wave, neon gas, glow discharge, COMSOL multiphysics, theoretical study
Citation: Hou L, Wang Y, Wang J, Yang L and Shi W (2021) Theoretical Study on Characteristics of Glow Discharged Neon Gas and Its Interaction With Terahertz Waves. Front. Phys. 9:751335. doi: 10.3389/fphy.2021.751335
Received: 31 July 2021; Accepted: 24 August 2021;
Published: 08 September 2021.
Edited by:
Yingxin Wang, Tsinghua University, ChinaReviewed by:
Yan Peng, University of Shanghai for Science and Technology, ChinaJun Wang, University of Electronic Science and Technology of China, China
Copyright © 2021 Hou, Wang, Wang, Yang and Shi. This is an open-access article distributed under the terms of the Creative Commons Attribution License (CC BY). The use, distribution or reproduction in other forums is permitted, provided the original author(s) and the copyright owner(s) are credited and that the original publication in this journal is cited, in accordance with accepted academic practice. No use, distribution or reproduction is permitted which does not comply with these terms.
*Correspondence: Lei Hou, aG91bGVpeGF1dEAxMjYuY29t