 Zhilong Li1
 Jian Zuo1*
 Yuanmeng Zhao1Zhongde Han2Zhihao Xu2Yunzhang Zhao2Chao Yang3Weidong Hu2Cunlin Zhang1
- 1Beijing Key Laboratory for Terahertz Spectroscopy and Imaging, MOE Key Laboratory of Terahertz Optoelectronics, Department of Physics, Capital Normal University, Beijing, China
- 2Beijing Key Laboratory of Millimeter Wave and Terahertz Technology, Beijing Institute of Technology, Beijing, China
- 3Kuang-Chi Silver Star Base Technology Room, Shenzhen Kuang-Chi Advanced Technology Co., Ltd, Shenzhen, China
When terahertz imaging technology is used for the nondestructive testing of composite materials, the signal is often affected by the experimental environment and internal noise of the system, as well as the absorption and scattering effect of the tested materials. The obtained image has degradation phenomena such as low contrast, poor resolution of small targets and blurred details. In order to improve the image quality, this paper proposes a novel method for the enhancement of composite materials’ terahertz image by using unsharp masking and guided filtering technology. The method includes the processing steps of hard threshold shrinkage denoising based on discrete wavelet transform, amplitude imaging, unsharp masking, guided filtering, contrast stretching, and pseudo-color mapping. In this paper, these steps are reasonably combined and optimized to obtain the final resulting image. To verify the effectiveness of the proposed method, a 150–220 GHz high frequency terahertz frequency modulated radar imaging system was used to image three commonly used sandwich structure composites, and the enhancement processing were carried out. The resulting images with significantly enhanced contrast, detail resolution and edge information were obtained, and the prefabricated defects were all detected; Five objective evaluation indexes including standard deviation, mean gradient, information entropy, energy gradient and local contrast were used to compare and analyze the processing results of different image enhancement methods. The subjective and objective evaluation results showed that the proposed method can effectively suppress the noise in terahertz detection signals, enhance the ability of defect detection and positioning, and improve the accuracy of detection. The proposed method in this paper is expected to play a positive role in improving the practicability of terahertz imaging detection technology and expanding its application fields.
Introduction
Terahertz imaging detection technology has the advantages of high penetrability. In the detection of composite materials’ defect, it is easier to detect the internal defects of composite materials than other traditional detection technologies, and it can be used for imaging without contacting the tested materials [1]. The photon energy of terahertz wave is in the order of millielectron volts, and it will not cause structural damage to the tested material or produce harmful radiation to biological tissue in terahertz imaging detection [2]. However, in the application of this technology, the terahertz wave will be affected by the experimental environment noise (energy level absorption of water vapor and air molecules around the system), the internal noise of the system (photon radiation noise, thermal noise, granular noise, etc.), and the material properties of the sample to be tested (interlaminar multiple reflections caused by the laminated structure and scattering caused by poor surface roughness of the sample) [3, 4], resulting in the degradation of the detection image such as low contrast, low detail resolution and poor sharpness, which affects the application of terahertz imaging detection technology and the accurate judgment of the internal information of the tested material. Thus, the interference properties of terahertz wave in the imaging process are analyzed. Meanwhile, the de-noising technology and image enhancement technology are used to process the detection image, which is expected to obtain the detection image with high contrast and strong detail resolution.
In order to solve the problem of terahertz image degradation, many scholars did a lot of research. Many methods for terahertz image denoising and enhancement were proposed such as mean filtering, Gaussian filtering, nonlocal mean filtering and the edge detection of Laplacian Gaussian operator. Mean filtering has better removal effect on Gaussian noise in the detected image, but the sharpness of the detected image after filtering will be reduced and the image details such as edges will become blurred; Gaussian filtering can effectively filter out speckle noise in the detected image, but it will cause certain damage to the effective information in the detected signal and the edge and texture details of the image; Nonlocal mean filtering can preserve the texture details of the image while filtering out the background noise, but it cannot adaptively select the optimal filtering parameters, resulting in artifacts in the detection image; The edge detection of Laplacian Gaussian operator can effectively enhance the edge and texture details of the detected image, but it will amplify the background noise while enhancing the edge and details of the image, so that the resolution of the detected image cannot be further improved [5–8]. Therefore, it is necessary to develop new terahertz image denoising and enhancement methods. Guided filtering technology was proposed by, after a large number of experiments, which had good performance in image detail enhancement and other aspects [9]. In their research, a guidance image was used to guide the input image, hence the edge of the output image was the same as the input image, and the texture details were similar to the guidance image. It can effectively preserve the edge information while denoising. In addition, Liu et al. and Zhou et al. used the guided filtering technology to enhance the details of infrared images, and achieved good results. However, the direct use of guided filtering technology would cause the problem that the background noise of the detection image is amplified [10, 11]. Wavelet transform has good time-frequency localization analysis ability and multi-resolution analysis characteristics. In this paper, the hard threshold shrinkage denoising method based on discrete wavelet transform is proposed to filter out the high-frequency noise of the original terahertz detection signal, so as to avoid the problem that the noise in the detection image is amplified after the guided filtering. On the other hand, since the unsharp masking method can preserve the smooth region of the image while highlighting the edge and texture details of the image, this paper proposes to use the sharpened image of the unsharp masking as a guidance image to make the details of the output image clearer. After guided filtering, the obtained detail layer and base layer are gained and superimposed to improve the contrast of terahertz detection image and enhance the detail and edge information of the image. In this paper, a 150–220 GHz high frequency terahertz frequency modulated radar imaging system was used to collect terahertz images of samples, and the denoising and enhancement processing were carried out. In the following, the imaging principle, the principle of wavelet-based unsharp masking and guided filtering method, the experimental samples, experimental setup, the experimental results and objective evaluation are described in detail.
THE Principles of Terahertz Frequency Modulated Radar Imaging System
In this paper, a 150–220 GHz high frequency terahertz frequency modulated radar imaging system had been used for imaging experiments [12]. This system uses a sawtooth wave generator to drive a voltage controlled oscillator to produce a linear frequency modulated continuous wave signal in the microwave band. The instantaneous frequency varies linearly with time in the range of 150–220 GHz, and the frequency modulation bandwidth is 70 GHz. The relationship between the angular frequency of the interference signal and the generated beat signal in the sawtooth wave frequency modulated continuous wave interference is shown in Figure 1.
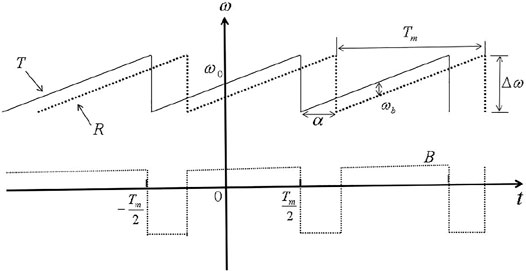
FIGURE 1. The relationship between angular frequency of the sawtooth wave interference signal and the generated beat frequency signal.
Among them, solid line
Where
When the system is used for terahertz imaging detection of sandwich structure composites with internal defects, the refractive index of defect and non-defect is different, and their reflection coefficient at the interface is different. When the terahertz wave is reflected through the interface, the amplitude of the reflected signal at the defect and non-defect will be different. Therefore, this paper selects the amplitude imaging method that can reflect the specific information of the different interface of the sample to image [13], so as to obtain the internal section information of the sample. The amplitude imaging method is expressed as
Where
Image Denoising Enhancement Based on Wavelet Unsharp Masking and Guided Filtering Technology
Wavelet transform is a time-frequency analysis method of signal, which has good time-frequency localization analysis ability and multi-resolution analysis function, and can distinguish the abrupt part of signal and noise in different decomposition layers, so it is suitable for analyzing non-stationary signals and extracting the local characteristics of signals [14]. Terahertz detection signal is a typical non-linear and non-stationary signal, so this paper uses the hard threshold shrinkage denoising method based on discrete wavelet transform to pre-denoise the original terahertz detection signal, and filter out the high-frequency noise in the detection signal. After the first high frequency denoising, the guided filtering technology which can further denoise and keep the edge information of the image well is introduced to filter the image after wavelet denoising. In order to better enhance the texture detail region of the output image, the sharpened image of the unsharpen masking is used as the guidance image to guide and filter the image after wavelet denoising again; Through the gain and superposition of the detail layer and the base layer obtained after filtering, the purpose of improving the contrast of terahertz detection image and enhancing the resolution of image detail is achieved. The block diagram of the method in this paper is shown in Figure 2.
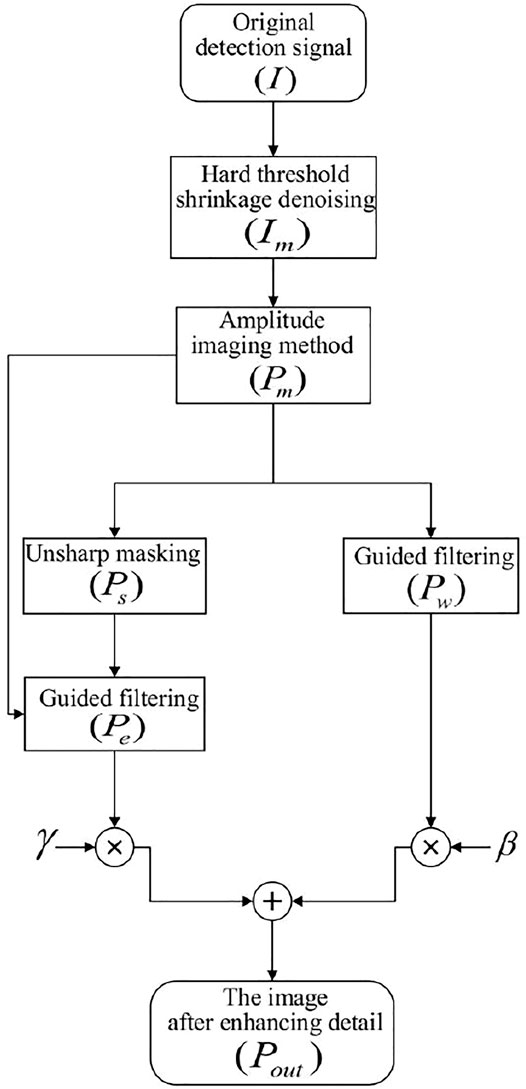
FIGURE 2. Block diagram of terahertz image processing method based on wavelet unsharp masking and guided filtering technology.
In the first step, the hard threshold shrinkage denoising method based on discrete wavelet transform is used to perform high-frequency denoising preprocessing on the original terahertz detection signal
Hard Threshold Shrinkage Denoising Enhancement Based on Discrete Wavelet Transform
For a square integrable function
Where
Where
In the detection of the sample under test, the detected signal usually contains certain noise, which can be considered as Gaussian white noise. The signal containing noise can be simply expressed as follows
Where
Define the scale function
If space
Similarly, the newly closed signal space spanned by
After further derivation of the scale function
The equation shows that different scale functions correspond to different
Among them, there is
According to the multi-resolution analysis equation
Then there is
Similarly, according to
Set the standard deviation of the wavelet coefficient
where
According to the characteristics of Gaussian distribution, setting the wavelet coefficient within the threshold range to zero can suppress the interference of noise to the maximum extent, namely, the effect of hard threshold function. Therefore, this paper selects the hard threshold function to carry out the hard threshold shrinkage denoising process for the wavelet coefficient of the noise containing signal. When the absolute value of the wavelet coefficient of the noise containing signal is less than the set threshold, it is made to be zero; otherwise, it keeps unchanged. After shrinkage denoising, the wavelet coefficients are reconstructed and restored to the terahertz detection signal, and the amplitude imaging method is used for imaging processing to obtain the preliminary terahertz detection image.
Guided Filtering
Guided filtering [9–11] is a filtering method with good performance in image denoising, defogging and detail enhancement. Its core idea is to guide the input image through a guidance image based on the local linear model, so that the overall contour feature of the output image is similar to that of the input image, and the texture detail region is similar to that of the guidance image. The output image
Where
Where
Where
Where
Where
Guided Filtering Based on Unsharp Masking
Unsharp masking [19, 20] is a common sharpening enhancement technique. Its basic principle is that the high frequency part of the image is obtained by subtracting the original image from the blurred image that is obtained by low-pass filtering, and then the high frequency part of the image is gained and superimposed with the original image to obtain the resulting image with enhanced details and edges. The unsharp masking process can be expressed as follows
where
In this paper, the mean filter is selected as the low-pass filter smoothing filter, and the mean filter template with a size of 3 × 3 is generated to conduct convolution filtering on the image after wavelet denoising, so as to obtain its blurred image. According to the principle of unsharp masking, the difference operation between the original image and the blurred image is used to obtain the mask image, that is, the image reflecting the detail information of the image. After
Image
Where
Imaging Samples, Experimental Methods and Image Processing
Sample Introduction and Experimental Setup
Polymethacrylimide foam composites are heat-resistant composites with the highest strength and stiffness to weight ratio. As the core material of sandwich structure, polymethacrylimide foam composites are widely used in aerospace, shipbuilding, military and other fields [21]. As one of the three major polymer materials, rubber has high elasticity than metal, high mechanical strength and good bending resistance. Because of its unique properties, rubber is widely used in medical and health, power communication, civil engineering and other fields [22]. Glass fiber reinforced composites are widely used in the bearing and electromagnetic wave transmission structures of unmanned aerial vehicles due to their excellent strength-weight ratio, aerodynamic performance and microwave permeability [23]. With the increasingly wide application of the above composites, the demand for its quality control, nondestructive testing and evaluation is also increasing. In the process of preparation and application, the above composites will be affected by external forces and temperature variations, resulting in internal defects such as cracks, voids and adhesive debonding, affecting the normal use of composite materials, and when the damage reaches a certain level, it will even cause a catastrophe [24], so the accurate detection of composite materials has important practical significance.
Polymethacrylimide Foam Sandwich Structure Composite Material
In this paper, aramid fiber paper honeycomb and polymethacrylimide foam composites were used to combine into sample 1 (the actual photos, defect location and size, structure diagram were shown in Figure 3). The sample was composed of thin aramid fiber paper honeycomb with thickness of 4.0 mm, two layers of polymethacrylimide foam with thickness of 4.3 mm and aramid fiber paper honeycomb with thickness of 40.0 mm, which were bonded to each other by epoxy resin adhesive, and two layers of Teflon films with diameters of 10.0 and 6.0 mm and thicknesses of 0.1 mm were used to prefabricate the adhesive debonding defects of different sizes in the sample. The locations of the two adhesive debonding defects were shown in the green mark in Figure 3.
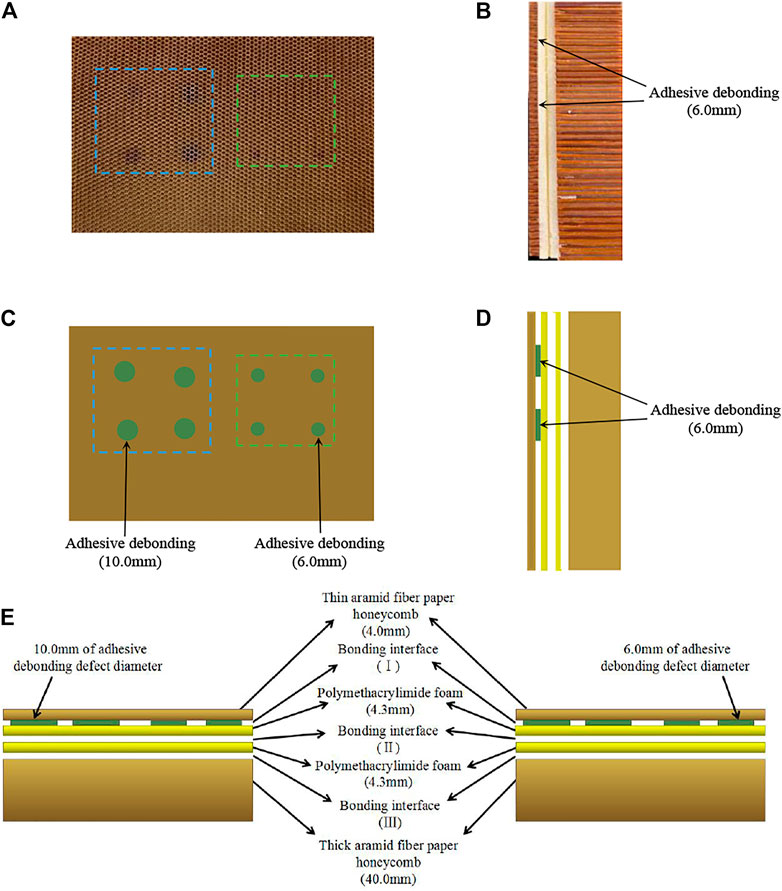
FIGURE 3. The actual photos, defect location and size, structure diagram of aramid fiber paper honeycomb and polymethacrylimide foam sandwich composite material. (A) the actual photo (top view), (B) the actual photo (side view), (C) the diagram of defect location and size (top view), (D) the diagram of defect location and size (side view), (E) the structure diagram.
Rubber and Glass Fiber Reinforced Composite Sandwich Structure
Sample two rubber and glass fiber reinforced composite sandwich structure (the actual photos, defect location and size, structure diagram were shown in Figure 4). The sample consisted of a rubber of 10.0 cm × 10.0 cm in size and 5.0 mm in thickness and a glass fiber reinforced composite of the same size and 13.0 mm in thickness. The two were bonded to each other by epoxy resin adhesive, and three delamination defects with a length of 4.2 cm and a depth of 2.0 mm were prefabricated in the glass fiber reinforced composite. The locations of the defects were shown in the yellow block in Figure 4.
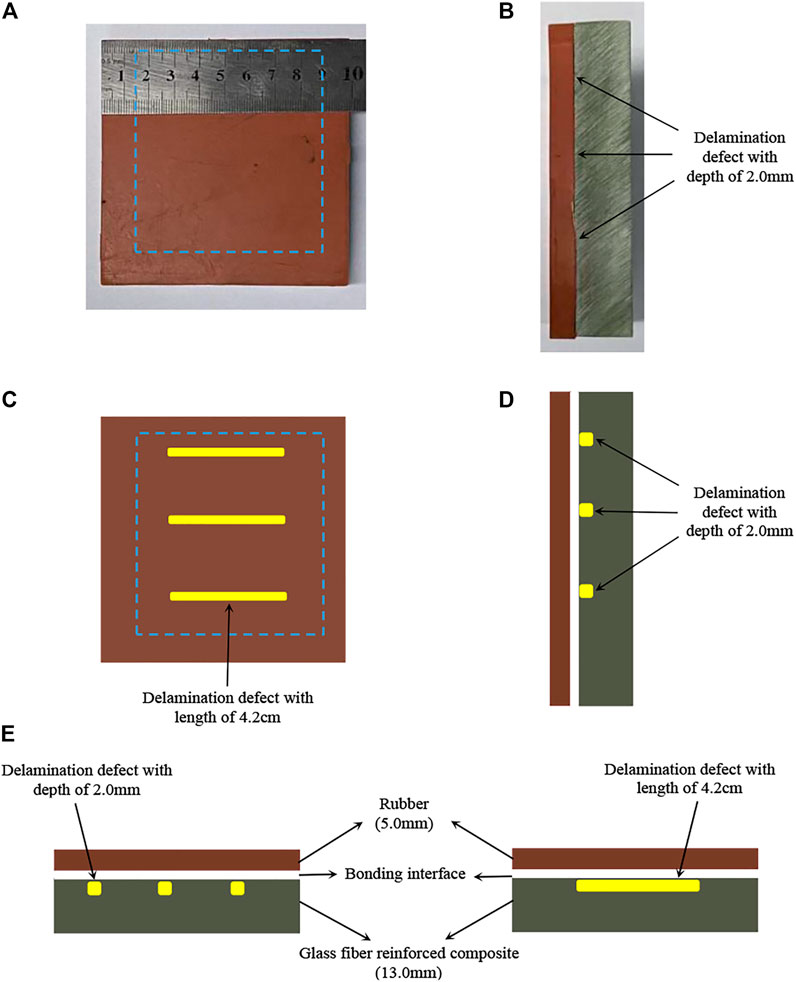
FIGURE 4. The actual photos, defect location and size, structure diagram of rubber and glass fiber reinforced composite sandwich structure. (A) the actual photo (top view), (B) the actual photo (side view), (C) the diagram of defect location and size (top view), (D) the diagram of defect location and size (side view), (E) the structure diagram.
Polymethacrylimide Foam and Polyvinyl Chloride Sheet Sandwich Composite Material
Sample 3 polymethacrylimide foam and polyvinyl chloride sheet sandwich composite material (the actual photos, defect location and size, structure diagram were shown in Figure 5). The sample was composed of two layers of 4.3 mm in thickness of polymethacrylimide foam and a layer of 2.0 mm in thickness of polyvinyl chloride sheet, which were also bonded with epoxy resin adhesive, and Teflon films of 10.0 and 3.0 mm in diameter and 0.1 mm in thickness were respectively used to prefabricate the adhesive debonding defects of different sizes in the sample. The locations of the two adhesive debonding defects were shown in the green mark in Figure 5.
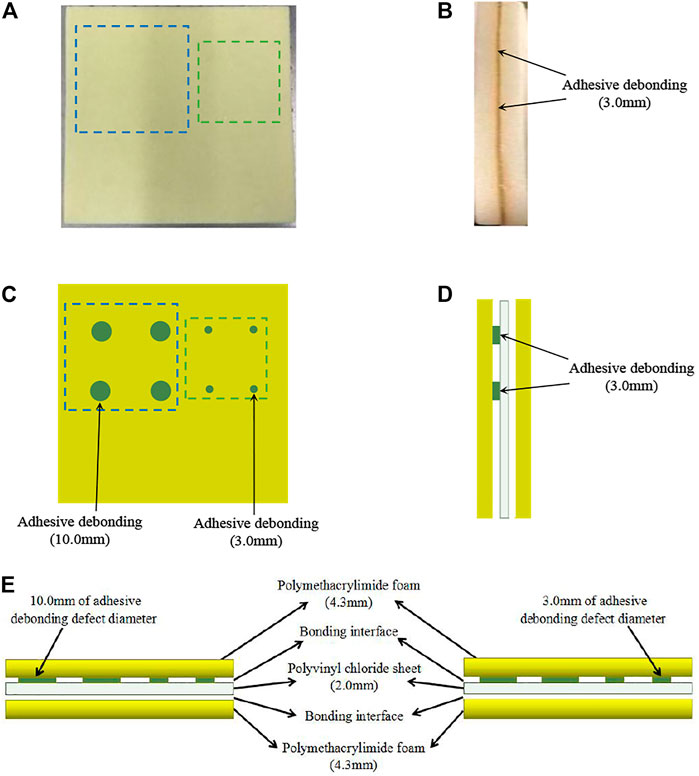
FIGURE 5. The actual photos, defect location and size, structure diagram of polymethacrylimide foam and polyvinyl chloride sheet sandwich composite material. (A) the actual photo (top view), (B) the actual photo (side view), (C) the diagram of defect location and size (top view), (D) the diagram of defect location and size (side view), (E) the structure diagram.
Experimental Setup
In this paper, when the 150–220 GHz high frequency terahertz frequency modulated radar imaging system was used for imaging detection of the above composite materials, in order to reduce the system noise and make the detection images clearer, all samples were placed near the focal plane of the detection system and detected by one-way point-by-point scanning. In order to further improve the detection accuracy of the detection system, the minimum detection accuracy of the stepper motor for the adhesive debonding defect in sample 1 with a diameter of 10.0 mm was set as 2.0 mm × 2.0 mm, and the minimum detection accuracy of the stepper motor for the adhesive debonding defect with a diameter of 6.0 mm was set as 1.0 mm × 1.0 mm; The minimum detection accuracy of the stepper motor was set as 1.5 mm × 1.5 mm for the delamination defects in sample two; the minimum detection accuracy of the stepper motor for the adhesive debonding defect in sample 3 with a diameter of 10.0 mm was also set as 1.5 mm × 1.5 mm, and the minimum detection accuracy of the stepper motor for the adhesive debonding defect with a diameter of 3.0 mm was set as 1.0 mm × 1.0 mm.
Image Processing Results and Analysis
After the imaging detection of the above composite materials, the amplitude imaging method was used to image the obtained terahertz detection signal, and Gaussian filtering and the method proposed in this paper were used to denoise and enhance the terahertz detection image. When the hard threshold shrinkage denoising method based on discrete wavelet transform was used to denoise the original detection signal, for the adhesive debonding defect with a diameter of 10.0 mm in sample 1, “sym4” was selected as the wavelet denoising combination with 3 layers of decomposition layer, and “sym5” was selected as the wavelet denoising combination with four layers of decomposition layer for the adhesive debonding defect with a diameter of 6.0 mm; For the delamination defects in sample 2, “sym5” was selected as the wavelet denoising combination with two layers of decomposition layer; For the adhesive debonding defect with a diameter of 10.0 mm and the adhesive debonding defect with a diameter of 3.0 mm in sample 3, the combination of wavelet denoising with “sym5” as the wavelet basis and the decomposition layer of 3 layers was selected for hard threshold shrinkage denoising.
Sample1: Imaging Results Analysis
The imaging results of each method for the adhesive debonding defect in sample 1 with a diameter of 10.0 mm are shown in Figure 6, and the imaging results of each method for the adhesive debonding defect with a diameter of 6.0 mm are shown in Figure 7. Firstly, according to the observation of the original detection images of two different sizes of the adhesive debonding defects, no matter the diameter of 6.0 mm or 10.0 mm, the adhesive debonding defects could not be effectively identified, only part of the defects could be vaguely observed, and the defect edges are blurred, the imaging contrast is not obvious, and the resolution of small targets is poor. Theoretically, the color distribution of the background region of the detection image should be relatively uniform, while there are differences in the color distribution of the background region in the actual detection image, with obvious noise distribution, which affects the quality of the detection image. The main reason for this phenomenon is that the energy loss of terahertz wave propagating in the measured sample is serious, and the effective reflection signal received by the detector is weak, which leads to the effective signal being submerged by noise, thus reducing the signal-noise ratio of the detected signal and reducing the imaging effect. Then observe the results of Gaussian filtering processing, although the use of this method can suppress the background noise of the detection image to some extent and enhance the contrast of the image, but the denoising is not complete, the background region still exists obvious noise distribution, unable to accurately identify the prefabricated adhesive debonding defects. Furthermore, the problem of signal distortion appears after filtering with this method, so that the effective defect information has been damaged. Finally, the results of the method proposed in this paper show that the recognition effect of the prefabricated defect region is significantly better than that of other methods. The prefabricated adhesive debonding defects are all effectively identified, and the details such as the edge of the defect are enhanced, and the contrast with the background region is improved. In addition, the noise in the background region of the image is significantly suppressed. Different from the Gaussian filtering method, the effective defect information is retained while filtering out the background noise of the image.
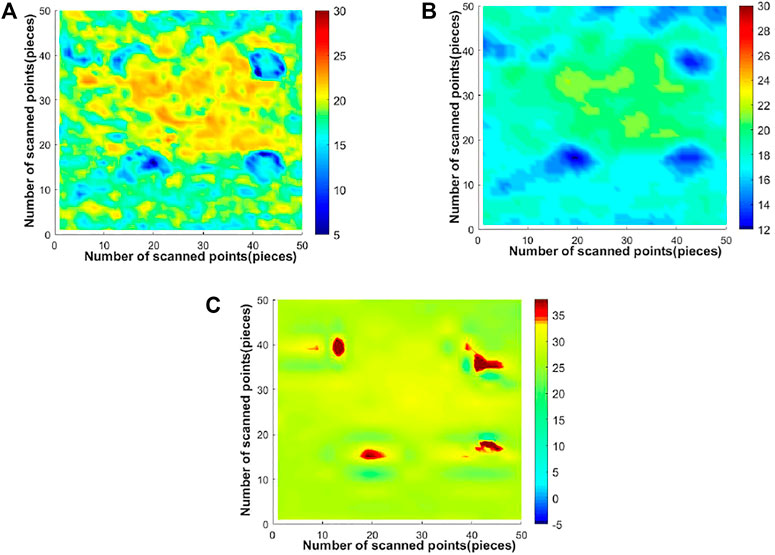
FIGURE 6. Image of processing results of each method for adhesive debonding with a diameter of 10.0 mm in sample 1. (A) image of original detection, (B) Gaussian filtering, (C) method in this paper.
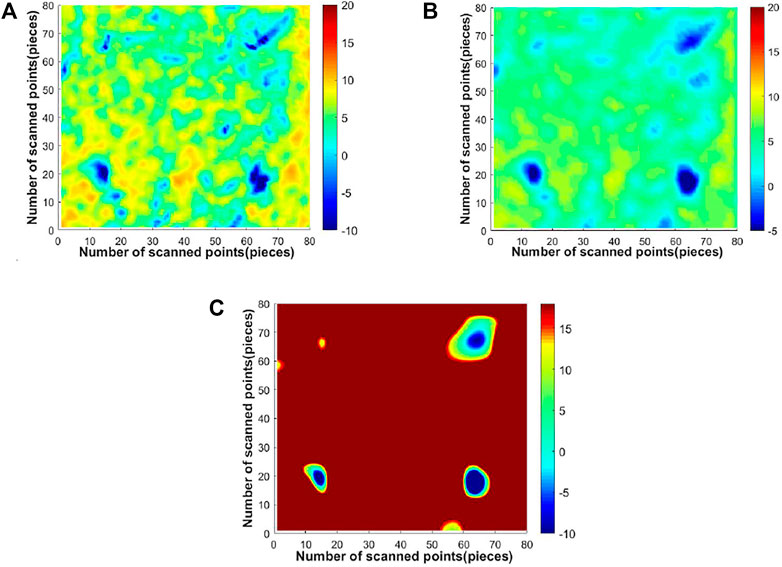
FIGURE 7. Image of processing results of each method for adhesive debonding with a diameter of 6.0 mm in sample 1. (A) image of original detection, (B) Gaussian filtering, (C) method in this paper.
Sample2: Imaging Results Analysis
The imaging results of each method of the delamination defects with depth of 2.0 mm in sample two are shown in Figure 8. Firstly, the original detection image of delamination defects is observed. It can be seen that the prefabricated delamination defects can be identified by the original detection image, but the edge of the defect is blurred, the detail resolution needs to be improved, and the background region also has obvious noise distribution, which affects the quality of the detection image. After observing the results of Gaussian filtering processing, it can be seen that this method has a certain denoising effect, but the denoising effect is not obvious, there is still some residual noise, and the defect edge is still blurred, and the overall sharpness of the detection image is poor. Finally, by observing the results processed by the method in this paper, it can be seen that the overall sharpness of the detection image greatly improved, and the details such as the edge of the prefabricated delamination defects have been significantly enhanced. Moreover, the background noise of the detection image has been effectively suppressed, and the contrast between the defect and the background region has been improved, which is helpful for the accurate identification of internal defects.
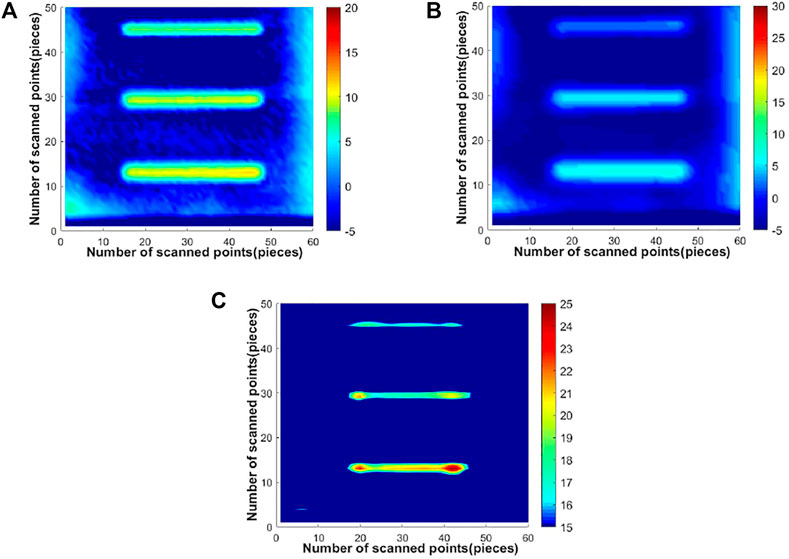
FIGURE 8. Image of processing results of each method for delamination defects in sample 2. (A) image of original detection, (B) Gaussian filtering, (C) method in this paper.
Sample3: Imaging Results Analysis
The imaging results of each method for the adhesive debonding defect in sample 3 with a diameter of 10.0 mm are shown in Figure 9, and the imaging results of each method for the adhesive debonding defect with a diameter of 3.0 mm are shown in Figure 10. Firstly, the original detection images of different sizes of adhesive debonding defect in sample 3 are observed. It is found that the prefabricated adhesive debonding defect with diameters of 10.0 and 3.0 mm could be vaguely identified in the original detection image, but the edge of the defect is blurred and the contrast with the background area is low. In addition, the background region of the image also has obvious noise distribution, which needs further denoising and enhancement to improve the contrast of the detection image and enhance the edge of the defect and other details. By observing the detection image after Gaussian filtering, it can be seen that the prefabricated adhesive debonding defect recognition effect has been improved to some extent, the noise in the background region has been well filtered, and the contrast between the defect and the background region has also been improved to some extent. However, the detection image becomes blurred after Gaussian filtering, and the detail resolution of the small target also needs to be further improved. Finally, through the observation of the results processed by the method in this paper, it can be seen that the detection images of two kinds of adhesive debonding defect have been greatly improved in the overall sharpness, contrast and defect edge details. The prefabricated two kinds of adhesive debonding defect can be well recognized, and the background noise of the detection image has been effectively suppressed. While filtering out the background noise, the defect information is effectively retained. Compared with the original detection image and the image after Gaussian filtering, the image quality is better.
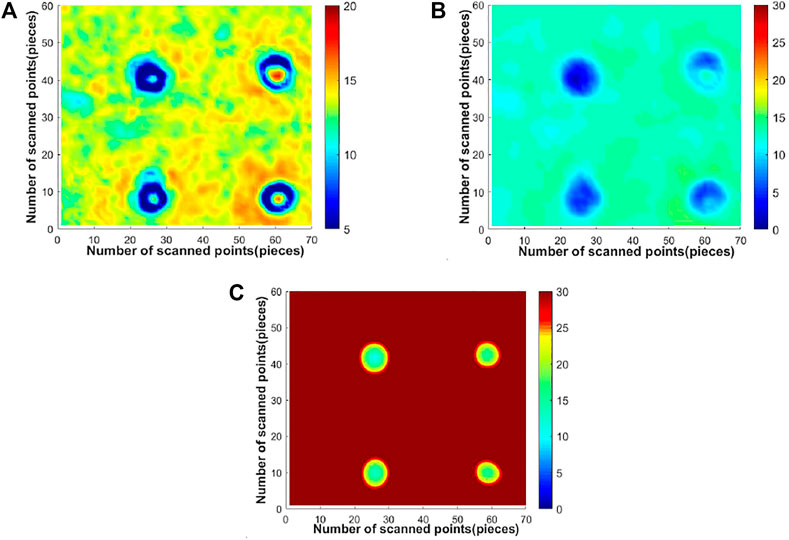
FIGURE 9. Image of processing results of each method for adhesive debonding with a diameter of 10.0 mm in sample 3. (A) image of original detection, (B) Gaussian filtering, (C) method in this paper.
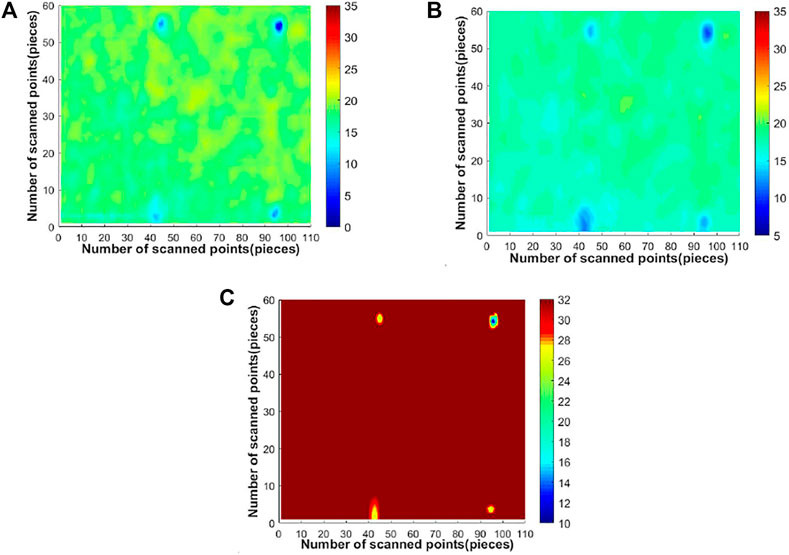
FIGURE 10. Image of processing results of each method for adhesive debonding with a diameter of 3.0 mm in sample 3. (A) image of original detection, (B) Gaussian filtering, (C) method in this paper.
Objective Evaluation of Resulting Images
In order to accurately evaluate the image processed by each method, this paper also uses five objective evaluation indexes, namely standard deviation (SD), mean gradient (MG), information entropy (IE), energy gradient (EG) and local contrast (LC), to objectively evaluate the image processing results [25–27].
Standard Deviation
Standard deviation refers to the degree of dispersion of image pixel gray value relative to the mean value. If the standard deviation is larger, it indicates that the gray scale in the image is more dispersed and the image quality is better. Its calculation formula is
where
Mean Gradient
The mean gradient represents the ability of image to express details, which is a measure of image sharpness. Usually, the greater the mean gradient is, the more the details of the image are, and the higher the sharpness is. The calculation formula of the mean gradient is as follows
where
Information Entropy
Information entropy is an effective method to evaluate information content in images. For an image with gray scale in the range of [0,L-1], the expression of information entropy is
Where
Energy Gradient
Image sharpness is an important index to measure the quality of the image, which can better correspond to the subjective feelings of people. The energy gradient can evaluate the image sharpness in real time, and the greater the energy gradient value of the image, the better the image sharpness. The definition of the function is as follows
Where
Local Contrast
The local contrast of the image can reflect the dynamic range of the gray distribution of the image pixels. The larger the dynamic range is, the higher the contrast is. The formula for calculating the local contrast is
Where
The calculation results of objective evaluation indexes of different methods are shown in Table 1. It can be seen from the table that the standard deviation, mean gradient, information entropy, energy gradient and local contrast of the five objective evaluation index data are higher than the corresponding values of the original detection image and the detection image after Gaussian filtering. It shows that the method in this paper has obvious advantages in contrast enhancement and level of detail and sharpness improvement.
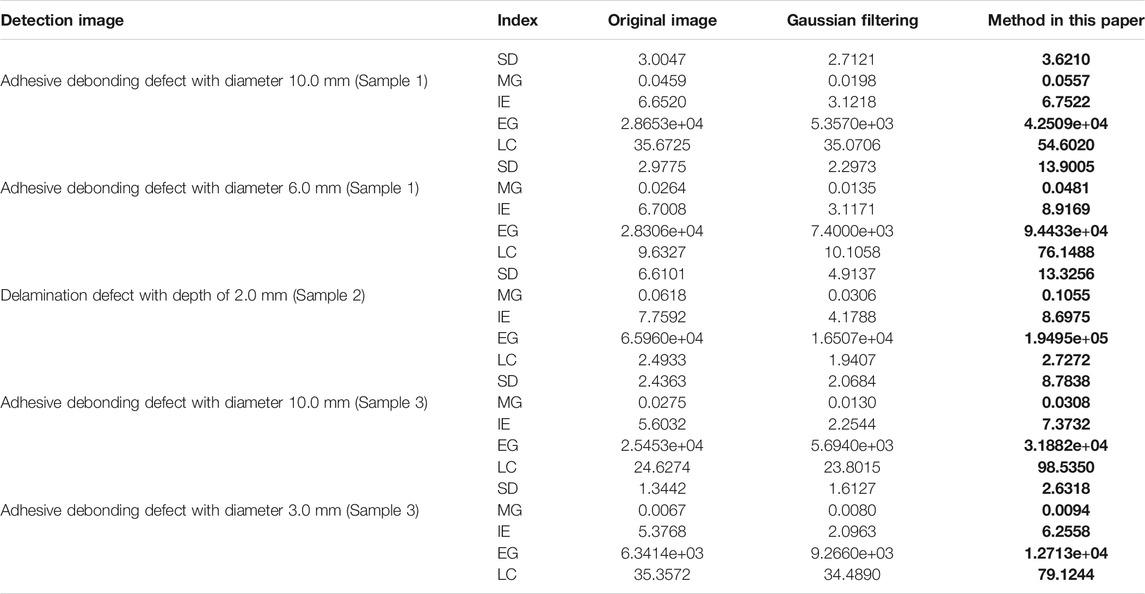
TABLE 1. Contrast results of image objective indexes between original image and images with different methods (Bold numbers indicate the optimal value for each set of data).
Conclusion
Aiming at the degradation phenomena of terahertz detection images, such as low contrast, poor resolution of small targets and blurred details, this paper proposes a novel method for the enhancement of composite materials’ terahertz image using unsharp masking and guided filtering technology. Through the imaging detection of a variety of composite materials, denoise and enhance the imaging by using this novel method, the experimental results and evaluation results show that the proposed method can effectively filter out the noise in the detection signal, improve the image contrast and resolution, and enhance the details of the detection image, which is conducive to the wider application of terahertz technology in the field of nondestructive testing of composite materials. In the future research, the existing methods are further improved to find a new method to achieve the size of the identified defect close to the actual size on the basis of improving the contrast and detail resolution of the terahertz detection image.
Data Availability Statement
The raw data supporting the conclusion of this article will be made available by the authors, without undue reservation.
Author Contributions
ZL: Methodology, Experiment, Validation, Investigation, Writing-Original Draft; JZ: Supervision, Investigation; YMZ: Supervision, Methodology, Writing-Reviewing and Editing; ZH: Experiment; ZX: Experiment; YZZ: Experiment; CY: Sample preparation; WH: Experiment, Supervision; CZ: Supervision, Funding acquisition.
Funding
This research was supported by the Beijing Advanced Innovation Center for Imaging Theory and Technology Scientific Research Funds (008/19530012003), the Capital Normal University Development Funds by Category–Physics Department–Practice base Projects for Degree Study Program (008-2155089).
Conflict of Interest
Author CY is employed by Shenzhen Kuang-Chi Advanced Technology Co., Ltd.
The remaining authors declare that the research was conducted in the absence of any commercial or financial relationships that could be construed as a potential conflict of interest.
Publisher’s Note
All claims expressed in this article are solely those of the authors and do not necessarily represent those of their affiliated organizations, or those of the publisher, the editors and the reviewers. Any product that may be evaluated in this article, or claim that may be made by its manufacturer, is not guaranteed or endorsed by the publisher.
References
1. Siegel PH. Terahertz Technology. IEEE Trans Microwave Theor Techn. (2002) 50(3):910–28. doi:10.1109/22.989974
2. Kawase K, Shibuya T, Hayashi Si., Suizu K. THz Imaging Techniques for Nondestructive Inspections. Comptes Rendus Physique (2010) 11(7-8):510–8. doi:10.1016/j.crhy.2010.04.003
3. Ferguson B, Abbott D. De-noising Techniques for Terahertz Responses of Biological Samples. Microelectron J (2001) 32(12):943–53. doi:10.1016/S0026-2692(01)00093-3
4. Kowalski M, Kastek M, Walczakowski M, Palka N, Szustakowski M. Passive Imaging of Concealed Objects in Terahertz and Long-Wavelength Infrared. Appl Opt (2015) 54(13):3826–33. doi:10.1364/AO.54.003826
5. Hua Zhong H, Yongwei Li YW, Jiao LC. SAR Image Despeckling Using Bayesian Nonlocal Means Filter with Sigma Preselection. IEEE Geosci Remote Sens Lett (2011) 8(4):809–13. doi:10.1109/LGRS.2011.2112331
6. Buades A, Coll B, Morel JM. A Review of Image Denoising Algorithms, with a New One. Multiscale Model Simul (2005) 4(2):490–530. doi:10.1137/040616024
7. Buades A, Coll B, Morel J-M. A Non-local Algorithm for Image Denoising. In: IEEE Computer Society Conference on Computer Vision and Pattern Recognition (CVPR'05); 2005 Jun 20–25; San Diego, CA, USA. IEEE (2005). doi:10.1109/CVPR.2005.38
8. Shi YX, Li JS. Based on Double Threshold Canny Equalization Algorithm for Terahertz Image Enhancement. Spectrosc Spect Anal (2018) 38(6):1680–3. doi:10.3964/j.issn.1000-0593(2018)06-1680-04
9. He K, Sun J, Tang X. Guided Image Filtering. IEEE Trans Pattern Anal Mach Intell (2013) 35(6):1397–409. doi:10.1109/TPAMI.2012.213
10. Liu N, Zhao D. Detail Enhancement for High-Dynamic-Range Infrared Images Based on Guided Image Filter. Infrared Phys Technol (2014) 67:138–47. doi:10.1016/j.infrared.2014.07.013
11. Zhou B, Luo Y, Yang M, Chen B, Wang M, Peng L, et al. An Improved Adaptive Detail Enhancement Algorithm for Infrared Images Based on Guided Image Filter. J Mod Opt (2019) 66(1):33–46. doi:10.1080/09500340.2018.1511861
12. Li Y, Hu W, Zhang X, Zhao Y, Ni J, Ligthart LP. A Non-linear Correction Method for Terahertz LFMCW Radar. IEEE Access (2020) 8:102784–94. doi:10.1109/ACCESS.2020.2998602
13. Dong J, Kim B, Locquet A, McKeon P, Declercq N, Citrin DS. Nondestructive Evaluation of Forced Delamination in Glass Fiber-Reinforced Composites by Terahertz and Ultrasonic Waves. Composites B: Eng (2015) 79:667–75. doi:10.1016/j.compositesb.2015.05.028
14. Maraun D, Kurths J. Cross Wavelet Analysis: Significance Testing and Pitfalls. Nonlin Process. Geophys (2004) 11(4):505–14. doi:10.5194/npg-11-505-2004
15. Mallat S, Hwang WL. Singularity Detection and Processing with Wavelets. IEEE Trans Inform Theor (1992) 38(2):617–43. doi:10.1109/18.119727
16. Sappa A, Carvajal J, Aguilera C, Oliveira M, Romero D, Vintimilla B. Wavelet-Based Visible and Infrared Image Fusion: A Comparative Study. Sensors (2016) 16(6):861. doi:10.3390/s16060861
17. Mallat SG. A Theory for Multiresolution Signal Decomposition: the Wavelet Representation. IEEE Trans Pattern Anal Machine Intell (1989) 11(7):674–93. doi:10.1109/34.192463
18. González‐Audícana M, Otazu X, Fors O, Seco A. Comparison between Mallat's and the 'à trous' discrete wavelet transform based algorithms for the fusion of multispectral and panchromatic images. Int J Remote Sens (2005) 26(3):595–614. doi:10.1080/01431160512331314056
19. Ramponi G. A Cubic Unsharp Masking Technique for Contrast Enhancement. Signal Process. (1998) 67(2):211–22. doi:10.1016/S0165-1684(98)00038-3
20. Polesel A, Ramponi G, Mathews VJ. Image Enhancement via Adaptive Unsharp Masking. IEEE Trans Image Process (2000) 9(3):505–10. doi:10.1109/83.826787
21. Xing L, Cui H-L, Shi C, Zhang Z, Zhang J, Chang T, et al. Nondestructive Examination of Polymethacrylimide Composite Structures with Terahertz Time-Domain Spectroscopy. Polym Test (2017) 57:141–8. doi:10.1016/j.polymertesting.2016.11.022
22. Frydrych I, Xu F, Duan Mu QD, Li LJ, Yang D, Xia B. Nondestructive Evaluation of Rubber Composites Using Terahertz Time Domain Spectroscopy. Fibres Text East Europe (2018) 26(1):67–72. doi:10.5604/01.3001.0010.7799
23. Ospald F, Zouaghi W, Beigang R, Matheis C, Jonuscheit J, Recur B, et al. Aeronautics Composite Material Inspection with a Terahertz Time-Domain Spectroscopy System. Opt Eng (2013) 53(3):031208. doi:10.1117/1.OE.53.3.031208
24. Walker J, Richter J. Nondestructive Evaluation of Foam Insulation for the External Tank Return to Flight. In: 42nd AIAA/ASME/SAE/ASEE Joint Propulsion Conference & Exhibit, Sacramento, California (2006). doi:10.2514/6.2006-4601
25. Liu J, Zhou C, Chen P, Kang C. An Efficient Contrast Enhancement Method for Remote Sensing Images. IEEE Geosci Remote Sens Lett (2017) 14(10):1715–9. doi:10.1109/LGRS.2017.2730247
26. Wang Y, Pan Z. Image Contrast Enhancement Using Adjacent-Blocks-Based Modification for Local Histogram Equalization. Infrared Phys Technol (2017) 86:59–65. doi:10.1016/j.infrared.2017.08.005
Keywords: terahertz imaging, image enhancement, discrete wavelet, hard threshold shrinkage denoising, guided filtering, unsharp masking
Citation: Li Z, Zuo J, Zhao Y, Han Z, Xu Z, Zhao Y, Yang C, Hu W and Zhang C (2021) A Novel Method for the Enhancement of Composite Materials’ Terahertz Image Using Unsharp Masking and Guided Filtering Technology. Front. Phys. 9:750588. doi: 10.3389/fphy.2021.750588
Received: 30 July 2021; Accepted: 04 October 2021;
Published: 03 November 2021.
Edited by:
Yingxin Wang, Tsinghua University, ChinaReviewed by:
Tao Peng, Texas A and M University, United StatesYing Liu, Beijing Normal University, China
Copyright © 2021 Li, Zuo, Zhao, Han, Xu, Zhao, Yang, Hu and Zhang. This is an open-access article distributed under the terms of the Creative Commons Attribution License (CC BY). The use, distribution or reproduction in other forums is permitted, provided the original author(s) and the copyright owner(s) are credited and that the original publication in this journal is cited, in accordance with accepted academic practice. No use, distribution or reproduction is permitted which does not comply with these terms.
*Correspondence: Jian Zuo, amlhbi56dW9AY251LmVkdS5jbg==