- Indian Institute of Astrophysics, Bengaluru, India
This paper studies the magnetic topology of successively erupting active regions (ARs) 11,429 and 12,371. Employing vector magnetic field observations from Helioseismic and Magnetic Imager, the pre-eruptive magnetic structure is reconstructed by a model of non-linear force-free field (NLFFF). For all the five CMEs from these ARs, the pre-eruptive magnetic structure identifies an inverse-S sigmoid consistent with the coronal plasma tracers in EUV observations. In all the eruption cases, the quasi-separatrix layers (QSLs) of large Q values are continuously enclosing core field bipolar regions in which inverse-S shaped flare ribbons are observed. These QSLs essentially represent the large connectivity gradients between the domains of twisted core flux within the inner bipolar region and the surrounding potential like arcade. It is consistent with the observed field structure largely with the sheared arcade. The QSL maps in the chromosphere are compared with the flare-ribbons observed at the peak time of the flares. The flare ribbons are largely inverse-S shape morphology with their continuity of visibility is missing in the observations. For the CMEs in the AR 12371, the QSLs outline the flare ribbons as a combination of two inverse J-shape sections with their straight parts being separated. These QSLs are typical with the weakly twisted flux rope. Similarly, for the CMEs in the AR 11429, the QSLs are co-spatial with the flare ribbons both in the middle of the PIL and in the hook sections. In the frame work of standard model of eruptions, the observed flare ribbons are the characteristic of the pre-eruptive magnetic structure being sigmoid which is reproduced by the NLFFF model with a weakly twisted flux rope at the core.
1 Introduction
Most often the coronal mass ejections are seen to launch from magnetically concentrated regions called active regions (ARs). In soft X-rays or in EUV images, the ARs that precede CMEs are seen with the observational features of S- and J-shaped loops situated over along the polarity inversion line (PIL). Owing to this specific S- or inverted S-shape, [1] termed these regions as sigmoids and are considered to be one of the most important precursor structures for the solar eruptions [2–4].
The shape of the sigmoid indicates the loops composed of non-potential magnetic field configuration characterised by sheared and/or twisted magnetic field lines. As a reason, the magnetic structure of the sigmoids are described by two competing configurations that are sheared arcade and magnetic flux rope (MFR). In the sheared arcade model, the two magnetic elbows sheared past each other are situated at the opposite ends of the PIL with a central sheared core at the middle section of the PIL [5,6]. And in the MFR scenario, a magnetic MFR is embedded in a stabilizing potential envelope field [1,7,8]. Because of the non-potential nature of the magnetic field, the magnetic structure in the sigmoid is approximated with a non-linear force-free field (NLFFF) which allows different twist parameter for individual field lines. The force-free modeling is justified by the low-β corona with a slowly evolving field compared to the Alfven crossing time.
To understand the eruptive nature of sigmoidal regions, it is important to study their magnetic structure and evolution both theoretically and observationally. Observations showed that the magnetic flux ropes have frequently been associated with sigmoidal regions [1,9–13] and the modelled NLFFF magnetic configuration that describes the observed shape of sigmoids is a weakly twisted flux rope embedded in potential arcade [14–18]. The flux rope structure constructed from analytical configurations [4,19,20] exhibits current sheets in the magnetic interface layers called quasi-separatrix layers (QSLs) where the connectivity of the field lines changes drastically just like separatrix layers. In the process of emerging, such a MFR develops a separatrix surface touching the photosphere along the PIL section [21,22]. These sections of the PIL are called bald-patches (BPs) and the separatrix surface at the BP appears as an S-shape from top view similar to sigmoid shape. After the emergence phase, the S-shaped bald-patch separatrix surface (BPSS) bifurcates into a double J-shaped QSL with the main body of the MFR lifted off. From this BPSS topology, the QSL structure underneath the rising flux rope develops an X-line configuration referred to as hyperbolic flux tube (HFT), where the reconnection sets in for the onset of the eruption. Therefore, the HFT topology is the predicted site for flare reconnection and CME eruption [23]. Further, the topological analysis of the MFR configurations, both models and observations, recommends the extension of the standard CHSHK flare model [24–27] to 3D. In the 2D flare model two flare ribbons are observed on either side of the PIL, whereas MFR eruptions found co-spatial flare ribbons with hook-shaped QSLs [15,28–30]. Figure 1 displays the schematic of the 3D standard model for eruptive flares as interpreted from simulations of eruptive MFRs [21,28,31]. In the left panel, the hook-shape inverse-S shaped QSLs in the photosphere are shown in thick black curves. The HFT underneath the uplifting MFR is depicted in the right panel as seen from perspective view. The photospheric QSL footpoints are co-spatial with flare ribbons in the 3D-eruptive flare models which is a signature of the MFR topology.
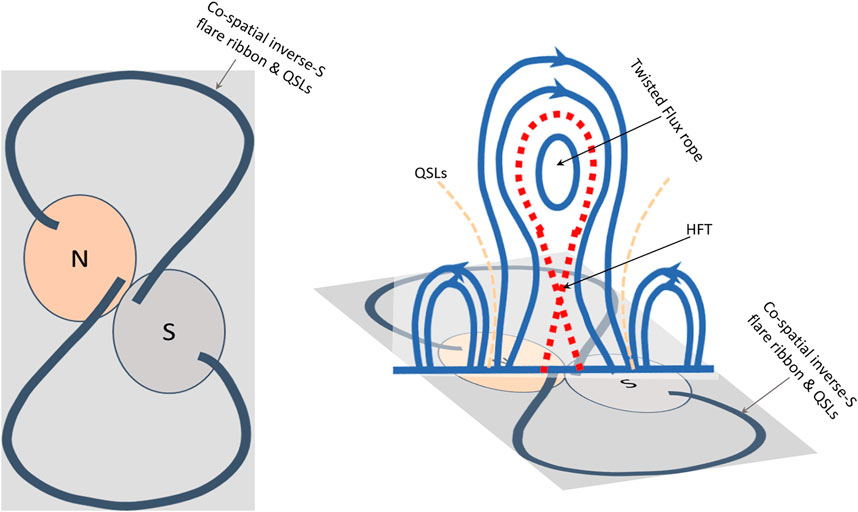
FIGURE 1. Schematic of the 3D standard model for eruptive flares. left panel: Black thick curves indicate the inverse-S QSL footprints at the photosphere. “N” (“S”) refers to north (south) polarity magnetic flux distribution. These inverse-S QSLs are regarded as the combination of two inverse-J shaped sections with straight parts lying in the opposite polarities about the PIL. right panel: Perspective view of the erupting flux rope structure and HFT underneath in a vertical plane across the MFR. Erupting MFRs form flare ribbons which trace these photospheric QSL footpoints.
Motivated by the above topological studies of the erupting regions, in this paper, we study the pre-eruptive magnetic structure of five CMEs from two successively erupting ARs. The coronal field is constructed by NLFFF [32], then we computed the chromospheric QSLs to compare their spatial locations with the geometry of the observed flare ribbons. By this comparison, one can ascertain the model predictions of the topological features with the observations, and then also validate the extent of the invoked NLFFF model to reproduce the actual coronal field. The paper is organized as follows. In Section 2, an overview of the CME events with a brief description of results presented in the previous reports. Reconstruction of the magnetic structure by NLFFF modeling is presented in Section 3. Comparison of the QSLs with the flare-ribbons is made in Section 4 and concluded with a summarized discussion in Section 5.
2 Overview of the Observations
Observations of the successive eruptions from the ARs 11429 and 12371 are obtained from the Atmospheric Imaging Assembly (AIA [33]) and Helioseismic Magnetic Imager (HMI [34]) on board NASA’s space-based Solar Dynamics Observatory (SDO). The AIA instrument captures the full disc images of the solar corona in 10 wavelengths at 0.6 arcsec pixel−1 resolution. The HMI provides photospheric line of sight and vector magnetic field observations at 0.5 arcsec pixel−1 resolution in Fe i 6,173 Å wavelength. The pipeline procedures of deriving the vector magnetic fields from the Stokes filter images are documented in [35] and [36]. We used vector magnetic field data product hmi.sharp_cea_720s at a cadence of 720s. Additional information of the CME eruptions is obtained from web portals like CME catalog1, and solar monitor2.
The AR 11429 was a pre-emerged one probably on far-side of the Sun. Figure 2 demonstrates the eruption scenario in this AR 11429. In panel 2a. the full disk image of AIA 131 Å shows the structured coronal emission from the AR 11429 (yellow rectangular box) located in the north (N17◦) hemisphere. HMI observations of the photospheric vector magnetograms at the pre-eruption time on two different days are displayed in panels 2 (b-c). The AR presents a large interface opposite polarities known as polarity inversion line (PIL). These magnetic polarities evolve with persistent shearing and converging motions which led to continuous flux cancellation as observed with the decay of the magnetic flux regions. Such regions are favorable to form stored energy configurations of sheared magnetic fields along the PIL. As a result, the AR evolved to a much more complex magnetic configuration (β/γ/δ) producing severe flare/CME activity during its disk transit. In Panel 2(c), GOES X-ray flux (1–8 Å band) displays the peaks of one X and two M-class flares associated with the CME eruptions from the AR 11429. Because of recurrent eruptions from the same region under a continuous physical process, these eruptions are referred to as homologous eruptions [37,38]. Study of this AR by [39] suggests that the shearing motion and magnetic flux cancellation by converging fluxes were key processes to recurrently form the erupting structure and then its eruption. Details of the CME eruptions from this AR are listed in Table 1.
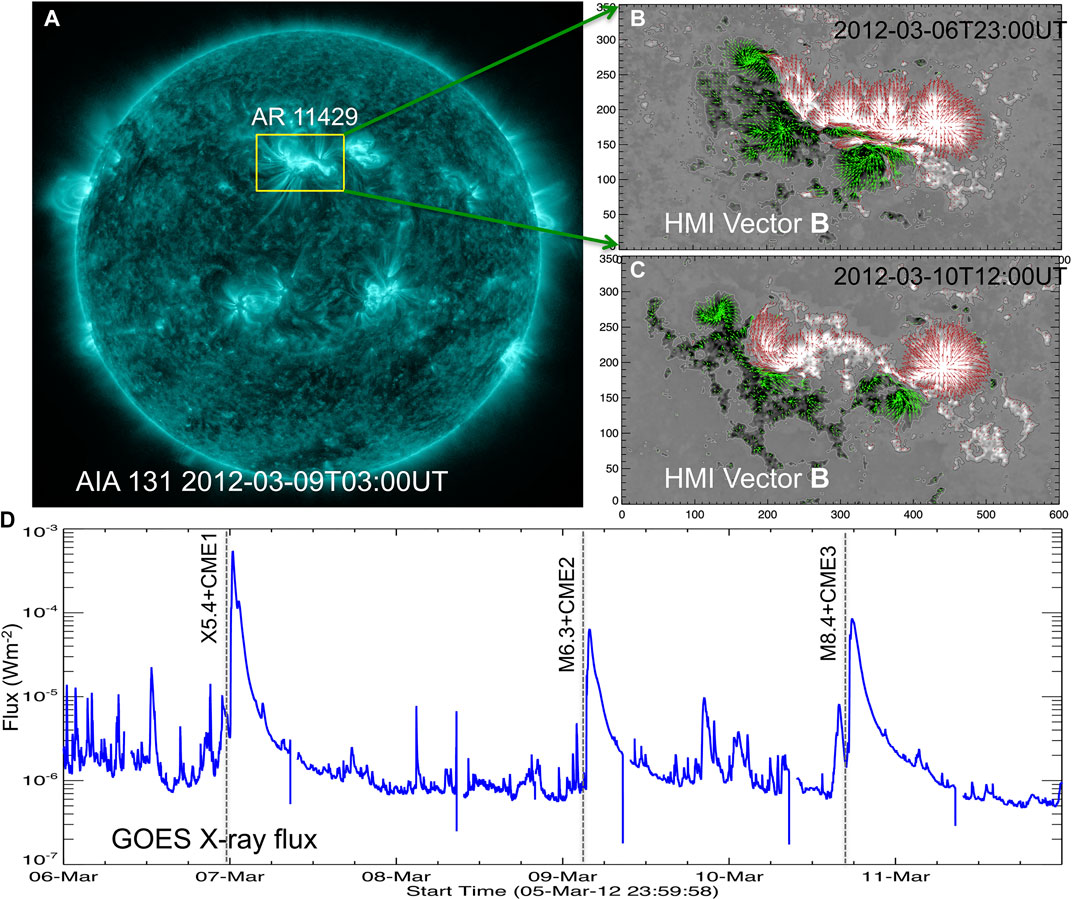
FIGURE 2. Observations of the successively erupting AR 11429 (A) Full disk observation of AIA 131 Å. The structured emission from AR 11429 is outlined with yellow rectangular box, (B-C) HMI vector magnetogram observations of the AR 11429 at the onset of CME eruptions on March 6 and 10 respectively. The background image is vertical magnetic field with contours at ±120 G. Green/red arrows denote horizontal field with their length being proportional to the magnitude
Another recurrent CME producing AR was NOAA 12371, which was also a pre-emerged region that passes the visible solar disk 12◦N on June 16, 2015. Figure 3 presents the eruption scenario of this AR. A representative AIA 131 Å full disk image is displayed in panel 3a, which shows the sigmoidal morphology of AR corona (yellow rectangular box). Panels 3 (b-c) display the HMI vector magnetograms at the pre-eruption time on June 21 and 22. The AR essentially consists of a leading negative flux region with the following interacting opposite polarity regions. From these magnetic field observations, the AR’s disk passage reveals that the following bipolar region was seen with large shear and converging motion as a result the flux distribution becomes diffused and disintegrated in successive days. As in the earlier AR, such an evolution of magnetic polarities leads to formation of the twisted flux along the PIL, which indeed is revealed by the sigmoidal loop structure in the EUV images. Four major CME eruptions occurred associated with M-class flares from this AR as shown by the peaks in the GOES X-ray flux plot of panel 3c. A detailed study of this AR by [40] interprets the successive eruptions by the cyclic process of energy and helicity storage over a time scale of a day or two and then its release by the CME eruptions. Table 1 lists the CME eruptions and associated flares from this AR.
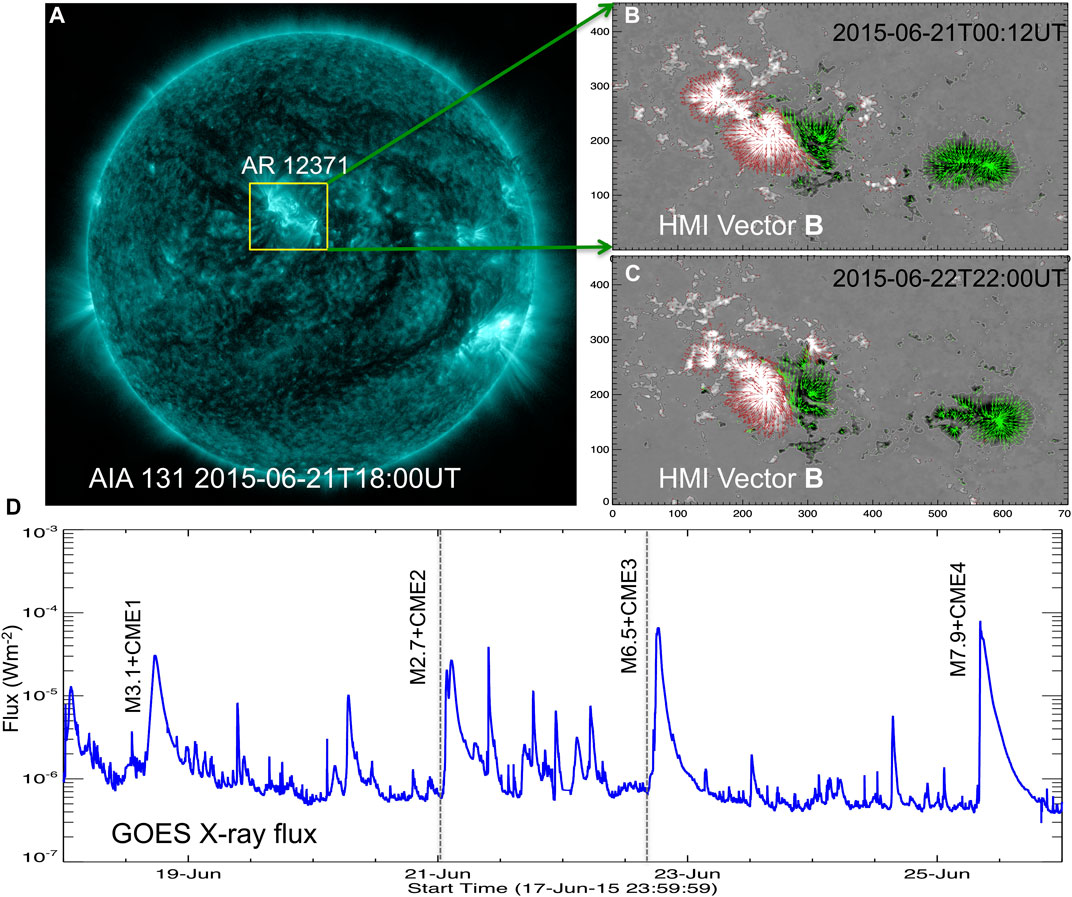
FIGURE 3. Observations of the successively erupting AR 12371 (A) Full disk observation of AIA 131 Å. The structured emission from AR 12371 is outlined with yellow rectangular box, (B-C) HMI vector magnetogram observations of the AR 12371 at the onset of CME eruptions on June 21 and 22 respectively. The background image is vertical magnetic field with contours at ±120 G. Green/red arrows denote horizontal field vector whose length is proportional to magnitude
3 Modelled Magnetic Structure: Non-linear Force-free Field
The AR magnetic structure in 3D is modelled by applying the NLFFF extrapolation [32,41,42]. The NLFFF algorithm involves minimization of the functional
In the above equation, the first integral includes quadratic forms of the force-free and solenoidal conditions and w is a weighting function toward the lateral and top boundaries. Second term is surface integral to take into account measurement errors and allows a slow injection of the boundary data controlled by the Lagrangian multiplier ν (see [42], for more details). W (x, y) is a diagonal matrix, which is chosen inversely proportional to the transverse magnetic field strength.
The observed photospheric vector magnetic field from the HMI is used as the lower boundary condition, for which the field has to satisfy flux balance, force-free conditions. When the vector magnetic field has full coverage of the AR, the flux balance condition is normally satisfied within 10% deviation. To keep this value as small as possible, we multiply the positive polarity region with a relative flux factor defined by the ratio of positive and negative flux. The force-free conditions are further satisfied by applying a pre-processing procedure on the magnetic field components [43]. To facilitate tracing field lines in a large extent of volume comparable to EUV field-of-view, the boundary magnetic field observations are inserted in an extended field of view and then rebinned to 1 arcsec pixel−1. With the normal field component of magnetic field, we reconstructed the 3D potential field (PF) which is then used as the initial condition and also to prescribe the top and side boundaries for the NLFFF algorithm.
In Figure 4, we show the NLFFF magnetic structure of AR 11429 just before the CME events on March 6, 9 and 10. The NLFFF is constructed on a grid of 450 × 450 × 201 representing the physical dimensions of 328 × 328 × 146 Mm3 AR corona. Similarly in Figure 5, we show the NLFFF magnetic structure of AR 12371 just before the CME events on June 21 and 22. In this case, the NLFFF field is constructed on a grid of 512 × 512 × 256 representing the physical dimensions of 373 × 373 × 186 Mm3 AR corona. For all of the cases, the NLFFF relaxation converges to an average field divergence of the order 10–4 and an average field-aligned current defined by θJ to an extent 9–12◦.
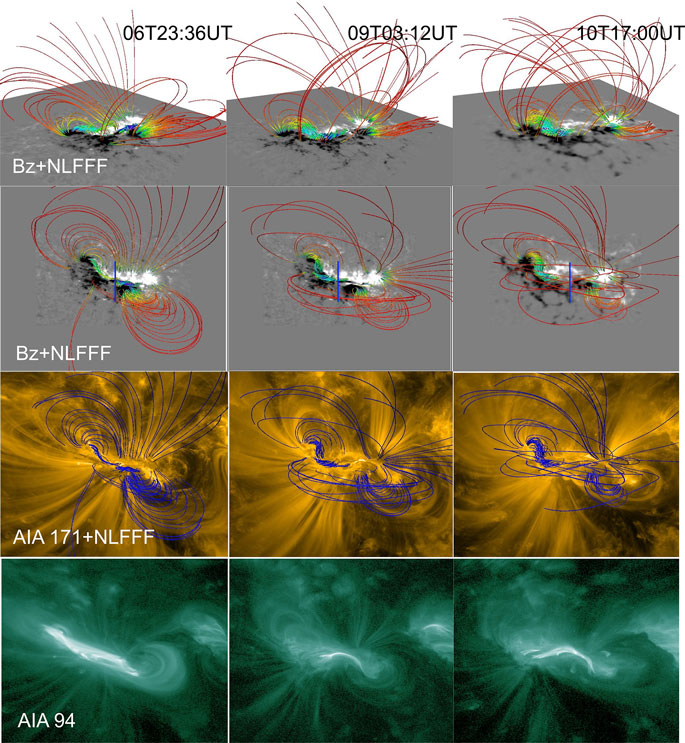
FIGURE 4. Pre-eruptive magnetic structure modeled by NLFFF in the AR 11429 for the three CME events. First row: Perspective view of the field-line rendering. Bottom image is photospheric magnetogram (Bz). Twisted structure along the PIL is overlaid by the less sheared field lines Second row: field lines plotted on top of the photospheric magnetogram (Bz). The global structure is a sigmoid with two opposite-J-shaped loops and an inner core of highly twisted field. Vertical blue lines indicate the location of the slice plane for QSL analysis. Third row: same field lines on AIA 171 Å images, Fourth row: AIA 94 Å images at the same time. Hot plasma emission is mainly co-spatial with the strongly sheared core along the PIL. To a good approximation, the modeled structure resembles the coronal plasma loops in the EUV images. Field lines are color coded (blue (red): 1,200 (2)G) with the horizontal field strength in height in first and second rows.

FIGURE 5. Pre-eruptive magnetic structure modeled by NLFFF in the AR 12371 for the CME2 and CME3 events. First row: Perspective view of the field-line rendering. Bottom image is photospheric magnetogram (Bz). Twisted structure along the PIL is overlaid by the less sheared field lines Second row: field lines plotted on top of the photospheric magnetogram (Bz). The global structure is a sigmoid with two opposite-J-shaped sections and an inner core of highly twisted field. Horizontal blue lines indicate the location of the slice plane for QSL analysis. Third row: same field lines on AIA 171 Å images, Fourth row: AIA 94 Å images at the same time. Hot plasma emission is mainly co-spatial with the strongly sheared core along the PIL. To a good approximation, the modeled structure resembles the coronal plasma loops in the EUV images. Field lines are color coded (blue (red): 1,200 (2)G) with the horizontal field strength in height in first and second rows.
To capture the most sheared structure, the field lines are rendered according to total current density (|J|) and horizontal field component (Bh) at the bottom boundary. The field line rendering is shown in perspective and top views in first and second rows respectively of Figures 4, 5. In these panels, the bottom plane is an observed Bz map. The field rendering in these panels comprise two inverse J-shaped field lines sheared past each other about the main PIL, which together reveal the shape of the inverse S-sigmoid. Owing to shearing motions of the foot points, the field lines near PIL are strongly stressed, manifesting low lying twisted core of the sigmoid, which is regarded as flux rope with helical field lines. During the onset of the eruption, this flux rope builds up further by the reconnection of oppositely sheared field, and therefore is the central structure of the solar eruptions [5,44].
In order to judge the NLFFF model to the coronal magnetic field, the modeled magnetic structure is compared to EUV coronal observations. To this end, we ensure that the EUV images are co-aligned to the magnetic field with the same field-of-view. The same field line rendering is over-plotted on EUV observations of corona captured in AIA 171 Å images (second row panels) which delineates a good global resemblance of the field lines with the plasma tracers. Because of the strong volume currents, the intense hot emission in AIA 94 Å images is mostly co-spatial with the NLFFF twisted core along the PIL.
4 Quasi-Separatrix Layers and Flare Ribbons
QSLs are the regions of the magnetic volume where the field line connectivity experiences dramatic but continuous variations, including possible discontinuities in the mapping, so are the generalized features to the separatrices [45]. From the constructed 3D coronal fields, the change in magnetic field line linkage in the volume is measured by the strength of QSLs which is defined by squashing factor Q [22,46]. Q describes the gradients in the field line mapping whose larger values correspond to the cross section of QSLs in any plane. It is computed by tracing two consecutive field lines with foot points at an extremely small distance and then measuring the distance between the respective conjugate foot points as given by the following mathematical expression
where Xi (i = 1, 2) is the coordinates of the conjugate foot point in the Cartesian system and Bz,0 and Bz,1 are vertical field components at the starting and ending footpoints of a field line. From the 3D NLFFF, we calculate Q using the code developed by [47] according to formalism prescribed in [28]. The field lines are traced by integrating the first order differential equations by fourth order Runge-Kutta solver with the help of tri-linear interpolation scheme. To have a smooth and dense distribution of Q, these computations are performed on a finer grid of resolution increased by eight times that of the extrapolation grid.
The complexity in the QSL maps of the NLFFF model is intrinsic to the large amount of fragmentation in the observed photospheric magnetic-field distribution. It has been shown that the complexity of QSL maps decreases with the height [14]. This is a consequence of the magnetic field being progressively smoother with height. Therefore, to determine important QSLs, Q maps are computed at 1.5 Mm height above the photosphere, which we refer chromospheric QSLs in this manuscript discussion.
In the first row panels of Figures 6, 7, we plot log Q maps at z = 1.5 Mm with inverse sign, so the darker parts correspond to higher Q values. For a reference, Bz contours of ±120G are over-plotted. Due to noisy transverse field, the Q maps of NLFFF are more fragmented in weak field regions. The relevant QSLs are having large Q values (>107) located in the stronger magnetic polarities related to the sigmoid structure. In panel of 23:36UT on March 6, the relevant QSLs traces the PIL in addition to the QSLs in the hooked sections in the top and bottom of the sigmoid. A similar distribution is presented in other panels. As seen in the 02:00 UT map on June 21, the QSL of high-Q values have two sections each falling in the opposite polarity regions of inner bipolar regions, both of which extends towards leading negative polarity. These two sections joined at the top in positive polarity. Although lower part have smaller values of Q, this overall QSL is continuous and encloses an inverse S-shaped region filled with lower Q-values. Essentially, these QSL highlights the difference between the twisted core flux within the region and the surrounding potential like arcade outside.
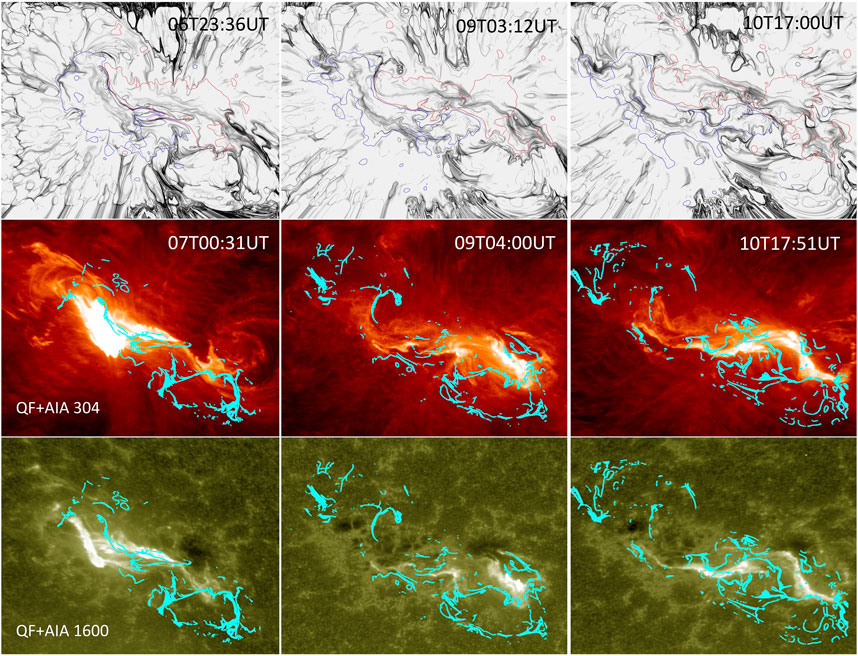
FIGURE 6. Comparison of QSLs and flare ribbons for the pre-eruptive magnetic structure of CME1 (first column), CME2 (second column), CME3 (third column) in the AR 11429. First row: Inverse maps of Log(Q) obtained at z =1.5 Mm. Bz-contours at ±120 G are overdrawn (red/blue curves). QSLs with large Q values are identified by intense black traces in strong field region. All maps are scaled within 1< Log(Q)<7. QSLs of large Q-values separate the sheared/twisted core field from the surrounding less sheared field in the following bipolar region. Also higher Q-values in quiet regions are due to noisy transverse field and have no relevance to the magnetic structure of interest. Second and third rows: Co-spatiality of QSLs and flare ribbons. Contours of Log(Q)=[4,5,6] (in cyan color) on AIA 304 Å (second row) and AIA 1600 Å (third row) snapshots taken at around the peak flare time. QSLs are co-spatial with the flare ribbons including the hooked shape.
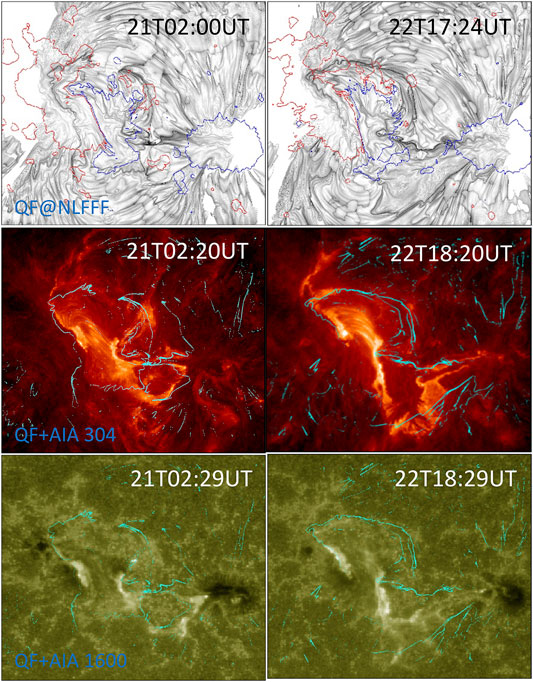
FIGURE 7. Comparison of QSLs and flare ribbons for the pre-eruptive magnetic structure of CME2 (first column) and CME3 (second column) in the AR 12371. First row: Inverse maps of Log(Q) obtained at z =1.5 Mm. Bz-contours at ±120 G are overdrawn (red/blue curves). QSLs with large Q values are identified by intense black traces in strong field region. All maps are scaled within 1< Log(Q)<7. QSLs of large Q-values separate the sheared/twisted core field from the surrounding less sheared field in the following bipolar region. Also higher Q-values in quiet regions are due to noisy transverse field and have no relevance to the magnetic structure of interest. Second and third rows: Relation between QSLs and flare ribbons. Contours of Log(Q)=[5,6] (in cyan color) on AIA 304 Å (second row) and AIA 1600 Å (third row) snapshots taken at around the peak flare time. The contours constitute two inverse-J sections, qualitatively outlining the inverse-S flare ribbons.
This picture is even clearer in the vertical cross-section map of Q obtained across the sigmoid. These are shown in Figures 8, 9. Bz-contours (±80G, red for positive, blue for negative), obtained in the same cut-plane, are over-plotted. Different from horizontal maps, the vertical Q maps are smooth with an obvious relevance with the magnetic polarities about the PIL. In these maps, the QSLs of large Q values well distinguish two closed domains belonging to largely sheared sections on either side of the PIL and the surrounding potential like arcade. Importantly the QSLs intersect the magnetic polarities at the middle in the NLFFF, whereas they cover the entire polarity region in the PF. This is clearly an indication of a sheared core being surrounded by less-sheared/potential arcade in the AR. Given the twisted flux (flux rope) at the core, the QSLs in its cross section mimics a inverse tear-drop shape as predicted by the theoretical models quoted in the Introduction. Depending on the degree of the twist, the identification of such QSLs varies due to observational and modeling difficulties (see for example Figure 8 in [48] and Figure 4 in [15]). In our NLFFF structures of the five CMEs, it is mildly visible as shown in Figures 8, 9. For a comparison with flare ribbons, the corresponding AIA 304 Å 1,600 Å observations are displayed in the second and third row panels of Figures 6, 7 respectively. On these maps, contours of Q for the corresponding event at 105, 106 levels are over-plotted in cyan-color. Note that we are comparing pre-eruptive Q-maps with the ribbons at around peak time of the flare of each eruption. Owing to noisy transverse field, and the discontinuous field distribution, the Q maps have patchy structure and we further apply a small threshold |Bz| < 15 G to remove non-relevant QSLs. In addition, irrelevant QSLs are removed by applying a mask on the computed Q-maps.

FIGURE 8. Inverse maps of Log(Q) in the vertical slice placed across the sigmoid in the AR 11429 as shown in Figure 4. Contours of Bz (±80 G, red/blue curves) are over plotted. QSLs of large Q-values (black) are boundaries of magnetic domains enclosing the twisted-sheared core about the PIL.
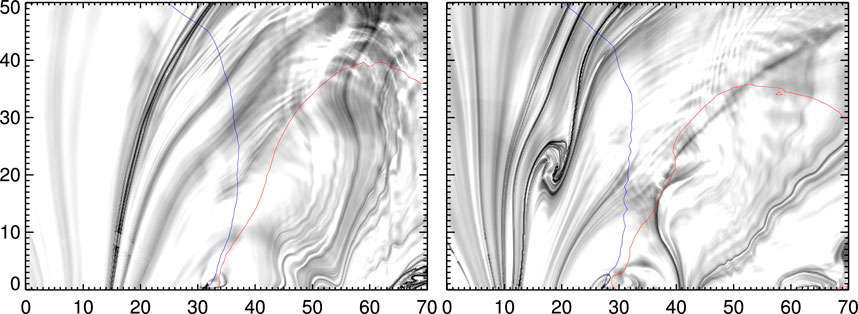
FIGURE 9. Inverse maps of Log(Q) in the vertical slice placed across the sigmoid in the AR 12371 as shown in Figure 5. Contours of Bz (±80 G, red/blue curves) are over plotted. QSLs of large Q-values (black) are boundaries of magnetic domains enclosing the twisted-flux core about the PIL.
The correspondence between the photospheric QSLs and flare ribbons has been shown in several studies. Theoretical studies predict that the flare ribbons are the photospheric foot prints of QSLs that encloses a twisted MFR [30,45]. The extremities of the ribbons are hook shaped for weakly twisted MFRs and are spiral shaped for highly twisted MFRs, as depicted in the cartoon of the 3D-model for eruptive flares in Figure 1. Moreover, the characteristic 3D shape of QSLs associated with a twisted MFR depends on the height of the horizontal cut plane [15,23,46,49]. The QSL is S-shaped if the horizontal cut plane is at HFT and the cut planes lies below HFT, the QSL will appear as 2 (inverse) J-shaped with straight parts of J parallel to each other along the PIL. From this point of view of the MFR topology, the panels in Figure 6 for the CME events from AR 11429, the QSLs are broadly spread over the flare ribbons especially the hook sections of the QSLs are in good morphological agreement. Such a remarkable match is an indication of the NLFFF models being capable of capturing hooked shape QSLs co-spatial with the observed flare ribbons, and was first reported by [15] in the topological analysis of AR 12158 employing the Grad-Rubin based NLFFF model.
From the above described MFR topology, the QSLs in the AR 12371 are also qualitatively match with the observed flare ribbons. The inverse-S ribbon exactly falls in the region outlined by QSLs of large Q-values. In fact, these QSLs can be regarded as a combination of 2 inverse-J shaped with a significant separation distance between the straight parts along PIL. We interpret the observed shape of the QSLs in the AR 12371 due to large part of sheared arcade surrounding the PIL, embedding the small-scale MFR. The sheared arcade becomes a large-scale twisted MFR only during onset of eruption by tether-cutting reconnection. The process of sheared arcade becoming large scale MFR is a dynamic process and may not be captured in vector magnetograms. Therefore, the static extrapolation results in a configuration with QSLs outlining the sheared arcade. Then the QSLs represents the boundaries of two connectivity domains separating the sheared arcade and the surrounding potential arcade.
Another factor that could also contribute to capture the observed shape of QSL is the amount of twist in the magnetic configuration [14,28]. A more twisted MFR will present a more pronounced hook such that the it appears as spiral in shape. In our cases, the separation distance between the straight parts of QSL J-sections and their hook shape are very likely due to insufficient or weak twist. Moreover, the twist of these field lines increases as a consequence of the eruption. Meeting this twist criteria, in particular during the dynamic phase of the eruption, the QSL foot prints would be co-spatial precisely with the observed flare ribbons.
5 Summary and Discussion
Topological study of magnetic connectivity gradients provides more insights on the relation of magnetic structure of the sigmoid and flare ribbons in the frame work of standard model of eruptions. We studied the pre-eruptive magnetic structure of five CMEs launched from two successively erupting ARs. The modelled magnetic structure is largely resembles an inverse-S sigmoid in good agreement with the coronal plasma tracers in EUV observations. In all the eruption cases, the QSLs of large Q values are continuous enclosing core field bipolar region in which inverse-S shaped flare ribbon is observed. These QSLs essentially represent the large connectivity gradients between the domains of twisted core flux within the inner bipolar region and the surrounding potential like arcade outside. It is consistent with the observed field structure largely with the sheared arcade.
The QSL maps in the chromosphere are compared with the flare ribbons observed at the peak time of the flares. The flare ribbons are largely with inverse-S shape morphology with their continuity of visibility is missing in the observations. For the CMEs in the AR 12371, the QSLs outline the flare ribbons as a combination of two inverse J-shape sections but their straight sections being separated at the middle of the PIL. These QSLs are typically associated with the weakly twisted flux rope topology. Similarly, for the CMEs in the AR 11429, the QSLs are co-spatial with the flare ribbons both in the middle of the PIL and in the hook sections. This overall match of the observed flare ribbons with the photospheric QSLs is an indication that the NLFFF model of optimization approach reproduces the pre-eruptive magnetic structure to a very good extent. Earlier Grad-Rubin implementation of NLFFF model was reported to capture the hook shaped QSLs co-spatial with the flare ribbons [15].
However, we can notice that the co-spatiality is not precise to the predicted extent in the theoretical models of the MFRs. In the tether-cutting scenario, the MFR forms only during eruption dynamically at which time we expect hook shaped, two inverse-J sections of QSLs that are co-spatial with the observed flare ribbons [15,30,50]. As per the view that the sheared arcades are weakly twisted MFRs in the sense that the magnetic field is dominated by the axial component [51], we can regard the observed QSL shape in the AR 12371 as the combination of two inverse-J sections with significant separation distance between the straight parts along the PIL. Therefore, the QSLs outlining the flare ribbons in the AR 12371 and less compact QSL hooks in the AR 11429 are likely due to the weakly twisted flux rope system. Additionally, difficulties related to input observations, construction of actual magnetic structure with the NLFFF modeling could also contribute to this discrepancy in the expected inverse-S (or two J-shaped ones) QSLs exactly co-spatial with the observed flare ribbons.
Data Availability Statement
Publicly available datasets were analyzed in this study. This data can be found here: http://jsoc.stanford.edu/.
Author Contributions
The author confirms being the sole contributor of this work and has approved it for publication.
Conflict of Interest
The author declares that the research was conducted in the absence of any commercial or financial relationships that could be construed as a potential conflict of interest.
Publisher’s Note
All claims expressed in this article are solely those of the authors and do not necessarily represent those of their affiliated organizations, or those of the publisher, the editors, and the reviewers. Any product that may be evaluated in this article, or claim that may be made by its manufacturer, is not guaranteed or endorsed by the publisher.
Acknowledgments
SDO is a mission of NASA’s Living With a Star Program. The NLFFF code was developed by T. Wiegelmann of Max Planck Institute for Solar System. 3D field line rendering is due to VAPOR (www.vapor.ucar.edu) software. We acknowledge an extensive usage of the multi-node, multi-processor high performance computing facility at the Indian Institute of Astrophysics. I thank the reviewers for their generous comments and suggestions which improved the clarity of the text.
Footnotes
1https://cdaw.gsfc.nasa.gov/CME_list/
References
1. Rust DM, Kumar A. Evidence for Helically Kinked Magnetic Flux Ropes in Solar Eruptions. Astrophys J Lett (1996) 464:L199–L202. doi:10.1086/310118
2. Hudson HS, Lemen JR, St. Cyr OC, Sterling AC, Webb DF. X-ray Coronal Changes during Halo CMEs. Geophys Res Lett (1998) 25:2481–4. doi:10.1029/98GL01303
3. Canfield RC, Hudson HS, McKenzie DE. Sigmoidal Morphology and Eruptive Solar Activity. Geophys Res Lett (1999) 26:627–30. doi:10.1029/1999gl900105
4. Canfield RC, Kazachenko MD, Acton LW, Mackay DH, Son J, Freeman TL. Yohkoh SXT Full-Resolution Observations of Sigmoids: Structure, Formation, and Eruption. ApJ (2007) 671:L81–L84. doi:10.1086/524729
5. Moore RL, Sterling AC, Hudson HS, Lemen JR. Onset of the Magnetic Explosion in Solar Flares and Coronal Mass Ejections. ApJ (2001) 552:833–48. doi:10.1086/320559
6. Moore RL, Sterling AC. Initiation of Coronal Mass Ejections. Solar Eruptions Energetic Particles Geophys Monogr Ser (2006) 165:43–57. doi:10.1029/165gm07
7. Moore RL, Roumeliotis G. Triggering of Eruptive Flares - Destabilization of the Preflare Magnetic Field Configuration. Eruptive Solar Flares. Proceedings of Colloquium #133 of the International Astronomical Union, Iguazu, Argentina, August 2-6, 1991. In: Z Svestka, BV Jackson, and ME Machado, editors. IAU Colloq. 133: Eruptive Solar Flares, Vol. 399. New York, NY: Berlin Springer Verlag (1992) p. 69. Lecture Notes in Physics. doi:10.1007/3-540-55246-4
8. Hood AW, Priest ER. Kink Instability of Solar Coronal Loops as the Cause of Solar Flares. Sol Phys (1979) 64:303–21. doi:10.1007/BF00151441
9. Gibson SE, Fan Y, Török T, Kliem B. The Evolving Sigmoid: Evidence for Magnetic Flux Ropes in the Corona before, during, and after CMES. Space Sci Rev (2007) 124:131–44. doi:10.1007/s11214-006-9101-2
10. Green LM, Kliem B, Török T, van Driel-Gesztelyi L, Attrill GDR. Transient Coronal Sigmoids and Rotating Erupting Flux Ropes. Sol Phys (2007) 246:365–91. doi:10.1007/s11207-007-9061-z
11. Song HQ, Chen Y, Zhang J, Cheng X, Wang B, Hu Q, et al. Evidence of the Solar EUV Hot Channel as a Magnetic Flux Rope from Remote-Sensing and In Situ Observations. ApJ (2015) 808:L15. doi:10.1088/2041-8205/808/1/L15
12. Vemareddy P, Mishra W. A Full Study on the Sun-Earth Connection of an Earth-Directed Cme Magnetic Flux Rope. ApJ (2015) 814:59. doi:10.1088/0004-637x/814/1/59
13. Song HQ, Chen Y, Qiu J, Chen CX, Zhang J, Cheng X, et al. The Acceleration Process of a Solar Quiescent Filament in the Inner Corona. ApJ (2018) 857:L21. doi:10.3847/2041-8213/aabcc3
14. Savcheva AS, Green LM, van Ballegooijen AA, DeLuca EE. Photospheric Flux Cancellation and the Build-Up of Sigmoidal Flux Ropes on the Sun. ApJ (2012) 759:105. doi:10.1088/0004-637X/759/2/105
15. Zhao J, A. Gilchrist S, Aulanier G, Schmieder B, Pariat E, Li H. Hooked Flare Ribbons and Flux-Rope-Related QSL Footprints. ApJ (2016) 823:62. doi:10.3847/0004-637X/823/1/62
16. Guo Y, Ding MD, Cheng X, Zhao J, Pariat E. Twist Accumulation and Topology Structure of a Solar Magnetic Flux Rope. ApJ (2013) 779:157. doi:10.1088/0004-637X/779/2/157
17. Vemareddy P, Cheng X, Ravindra B. Sunspot Rotation as a Driver of Major Solar Eruptions in the NOAA Active Region 12158. ApJ (2016) 829:24. doi:10.3847/0004-637X/829/1/24
18. Vemareddy P, Demóulin P. Study of Three-Dimensional Magnetic Structure and the Successive Eruptive Nature of Active Region 12371. ApJ (2018) 857:90. doi:10.3847/1538-4357/aab6b7
19. Démoulin P. Extending the Concept of Separatrices to QSLs for Magnetic Reconnection. Adv Space Res (2006) 37:1269–82. doi:10.1016/j.asr.2005.03.085
20. Démoulin P. Where Will Efficient Energy Release Occur in 3-D Magnetic Configurations?. Adv Space Res (2007) 39:1367–77. doi:10.1016/j.asr.2007.02.046
21. Titov VS, Démoulin P. Basic Topology of Twisted Magnetic Configurations in Solar Flares. Astron Astrophys (1999) 351:707–20.
22. Titov VS, Hornig G, Démoulin P. Theory of Magnetic Connectivity in the Solar corona. J Geophys Res (2002) 107:3–1. doi:10.1029/2001JA000278
23. Savcheva AS, van Ballegooijen AA, DeLuca EE. Field Topology Analysis of a Long-Lasting Coronal Sigmoid. ApJ (2012) 744:78. doi:10.1088/0004-637x/744/1/78
25. Sturrock PA. Model of the High-Energy Phase of Solar Flares. Nature (1966) 211:695–7. doi:10.1038/211695a0
26. Hirayama T. Theoretical Model of Flares and Prominences. Sol Phys (1974) 34:323–38. doi:10.1007/BF00153671
27. Kopp RA, Pneuman GW. Magnetic Reconnection in the corona and the Loop Prominence Phenomenon. Sol Phys (1976) 50:85–98. doi:10.1007/BF00206193
28. Pariat E, Démoulin P. Estimation of the Squashing Degree within a Three-Dimensional Domain. A&A (2012) 541:A78. doi:10.1051/0004-6361/201118515
29. Janvier M, Aulanier G, Pariat E, Démoulin P. The Standard Flare Model in Three Dimensions. A&A (2013) 555:A77. doi:10.1051/0004-6361/201321164
30. Janvier M, Aulanier G, Démoulin P. From Coronal Observations to MHD Simulations, the Building Blocks for 3D Models of Solar Flares (Invited Review). Sol Phys (2015) 290:3425–56. doi:10.1007/s11207-015-0710-3
31. Chen P, Su J, Guo Y, Deng Y. Where Do Flare Ribbons Stop?. Chin Sci Bull (2012) 57:1393–6. doi:10.1007/s11434-011-4829-9
32. Wiegelmann T. Optimization Code with Weighting Function for the Reconstruction of Coronal Magnetic fields. Solar Phys (2004) 219:87–108. doi:10.1023/b:sola.0000021799.39465.36
33. Lemen JR, Title AM, Akin DJ, Boerner PF, Chou C, Drake JF, et al. The Atmospheric Imaging Assembly (AIA) on the Solar Dynamics Observatory (SDO). Solar Phys (2012) 275:17–40. doi:10.1007/s11207-011-9776-8
34. Schou J, Scherrer PH, Bush RI, Wachter R, Couvidat S, Rabello-Soares MC, et al. Design and Ground Calibration of the Helioseismic and Magnetic Imager (HMI) Instrument on the Solar Dynamics Observatory (SDO). Solar Phys (2012) 275:229–59. doi:10.1007/s11207-010-9639-8
35. Bobra MG, Sun X, Hoeksema JT, Turmon M, Liu Y, Hayashi K, et al. The Helioseismic and Magnetic Imager (HMI) Vector Magnetic Field Pipeline: SHARPs - Space-Weather HMI Active Region Patches. Sol Phys (2014) 289:3549–78. doi:10.1007/s11207-014-0529-3
36. Hoeksema JT, Liu Y, Hayashi K, Sun X, Schou J, Couvidat S, et al. The Helioseismic and Magnetic Imager (HMI) Vector Magnetic Field Pipeline: Overview and Performance. Sol Phys (2014) 289:3483–530. doi:10.1007/s11207-014-0516-8
37. Nitta NV, Hudson HS. Recurrent Flare/CME Events from an Emerging Flux Region. Geophys Res Lett (2001) 28:3801–4. doi:10.1029/2001GL013261
38. Zhang J, Wang J. Are Homologous Flare-Coronal Mass Ejection Events Triggered by Moving Magnetic Features? Astrophys J Lett (2002) 566:L117–L120. doi:10.1086/339660
39. Dhakal SK, Zhang J, Vemareddy P, Karna N. Recurring Homologous Solar Eruptions in NOAA AR 11429. ApJ (2020) 901:40. doi:10.3847/1538-4357/abacbc
40. Vemareddy P. Successive Homologous Coronal Mass Ejections Driven by Shearing and Converging Motions in Solar Active Region Noaa 12371. ApJ (2017) 845:59. doi:10.3847/1538-4357/aa7ff4
41. Wheatland MS, Sturrock PA, Roumeliotis G. An Optimization Approach to Reconstructing Force‐free Fields. ApJ (2000) 540:1150–5. doi:10.1086/309355
42. Wiegelmann T, Inhester B. How to deal with Measurement Errors and Lacking Data in Nonlinear Force-free Coronal Magnetic Field Modelling?. A&A (2010) 516:A107. doi:10.1051/0004-6361/201014391
43. Wiegelmann T, Inhester B, Sakurai T. Preprocessing of Vector Magnetograph Data for a Nonlinear Force-free Magnetic Field Reconstruction. Sol Phys (2006) 233:215–32. doi:10.1007/s11207-006-2092-z
44. Duan A, Jiang C, He W, Feng X, Zou P, Cui J. A Study of Pre-flare Solar Coronal Magnetic Fields: Magnetic Flux Ropes. ApJ (2019) 884:73. doi:10.3847/1538-4357/ab3e33
45. Demoulin P, Henoux JC, Priest ER, Mandrini CH. Quasi-Separatrix Layers in Solar Flares. Method Astron Astrophys (1996) 308:643–55.
46. Titov VS. Generalized Squashing Factors for Covariant Description of Magnetic Connectivity in the Solar Corona. ApJ (2007) 660:863–73. doi:10.1086/512671
47. Liu R, Kliem B, Titov VS, Chen J, Wang Y, Wang H, et al. Structure, Stability, and Evolution of Magnetic Flux Ropes from the Perspective of Magnetic Twist. ApJ (2016) 818:148. doi:10.3847/0004-637X/818/2/148
48. Vemareddy P. Very Fast Helicity Injection Leading to Critically Stable State and Large Eruptive Activity in Solar Active Region NOAA 12673. ApJ (2019) 872:182. doi:10.3847/1538-4357/ab0200
49. Savcheva A, Pariat E, McKillop S, McCauley P, Hanson E, Su Y, et al. The Relation between Solar Eruption Topologies and Observed Flare Features. I. Flare Ribbons. ApJ (2015) 810:96. doi:10.1088/0004-637X/810/2/96
50. Savcheva A, Pariat E, van Ballegooijen A, Aulanier G, DeLuca E. Sigmoidal Active Region on the Sun: Comparison of a Magnetohydrodynamical Simulation and a Nonlinear Force-free Field Model. ApJ (2012) 750:15. doi:10.1088/0004-637x/750/1/15
Keywords: Sun: CMEs, Sun: magnetic flux ropes, Sun: magnetic fields, Sun: flares, Sun: active region
Citation: Vemareddy P (2021) Magnetic Structure in Successively Erupting Active Regions: Comparison of Flare-Ribbons With Quasi-Separatrix Layers. Front. Phys. 9:749479. doi: 10.3389/fphy.2021.749479
Received: 29 July 2021; Accepted: 27 September 2021;
Published: 15 October 2021.
Edited by:
HengQiang Feng, Luoyang Normal University, ChinaCopyright © 2021 Vemareddy. This is an open-access article distributed under the terms of the Creative Commons Attribution License (CC BY). The use, distribution or reproduction in other forums is permitted, provided the original author(s) and the copyright owner(s) are credited and that the original publication in this journal is cited, in accordance with accepted academic practice. No use, distribution or reproduction is permitted which does not comply with these terms.
*Correspondence: P. Vemareddy, dmVtYXJlZGR5QGlpYXAucmVzLmlu
 P. Vemareddy