- 1Discipline of Chemical Engineering, School of Engineering, Howard College Campus, University of KwaZulu-Natal, Durban, South Africa
- 2Scuola di Ingegneria, Università della Basilicata, Potenza, Italy
- 3ISTP, National Research Council (CNR), Bari, Italy
- 4Department of Chemical Engineering, Faculty of Engineering, Built Environment, and Information Technology, University of Pretoria, Pretoria, South Africa
A plasma discharge in a Helium gas reactor at different pressures and at low currents (0.25–0.45 A) has been investigated by Computational Fluid Dynamic modeling coupled with the Maxwell’s equations. The results show different discharge dynamics across the pressure range (0.1–8 MPa), with an arc discharge obtained at high pressure and a low current arc discharge observed at atmospheric pressure. A large density gradient at higher pressure causes a strong natural convection effect in the reactor. This density gradient affects drastically the discharge shape and the velocity field at high pressures while at atmospheric pressure, a lower density gradient was observed resulting in a low velocity magnitude. It has been observed that the velocity magnitude is not affected by the electric current. The discharge electric potential has been calculated by considering the electrical characterization of the electrodes and numerical results have been compared with experimental results. The comparison shows a good agreement between the measured and calculated discharge electric potential at lower pressures. These devices can be used as plasma sources for wastewater treatment.
Introduction
Freshwater supply is a global challenge, and it is estimated that approximately four billion people experience a water shortage once a year [1]. Pollution reduces water quality and has the effect of reducing the availability of water that can be used for potable or agricultural applications. Pollution refers to the introduction of harmful contaminants such as organic chemicals or microbes derived from human or animal waste into freshwater sources [2]. Increasing amounts of pollution have made the removal of hazardous organic pollutants in the water a critical topic in environmental research. Reactors using plasma-based technology have been proposed to remove micropollutants in wastewater. Plasma is known to contain chemically active species and charged particles, which can be used in a wastewater treatment application [3].
The treatment of wastewater has been done via a thermal [2] and non-thermal plasma technology [3, 4]. In addition, the process could be carried out indirectly (i.e., plasma discharges generated above the water), directly (i.e., plasma discharges generated in water), and using a hybrid approach. These different techniques imply that there is a need to improve the design of the plasma reactors used in wastewater treatment applications to increase its effectiveness and efficiency [2–12]. An understanding of the physical phenomena describing the plasma dynamics and the calculation of the discharge temperature are vital in order to optimize the design of reactors and consequently the plasma treatment.
References [6], [9] and [2] have shown that an atmospheric pressure plasma discharge in gas above water can produce radicals and reactive species, which have been demonstrated to rapidly and efficiently degrade many organic compounds, including phenols. The main mechanism of the reactions in the plasma-liquid interface is the reactive species transfer.
Some techniques have been reported that involves the removal of pollutants in water by designing reactors which operate at high temperature and high pressure. Among these, the use of supercritical water oxidation (SCW) in the degradation of organic pollutants such as phenol have been discussed [13–15]. These studies indicated that SCW (
Plasma technology has been profiled in the last 2 decades as a potential approach to the degradation of persistent organic pollutants in wastewater and other categories of micropollutants for which the conventional wastewater treatment plants are ineffective. While reactor design in plasma treatment of wastewater has undergone several modifications including the use of low current and nanoseconds power supply systems to reduce the previously high energy consumption, there remain issues like reactor throughput, and removal efficiency depending on the class of the pollutants. Some of these issues are still unresolved because of inadequate information of plasma dynamics and plasma-liquid interactions. Even though there are no studies dedicated to the use of high-pressure plasma in wastewater treatment, the understanding of the stability and dynamics using an inert gas would be beneficial to the scientific community especially when mineralization of highly concentrated wastewater like the pharmaceutical and hospital wastewater is considered along with landfill leachates.
Our research group has previously used Computational Fluid Dynamics (CFD) to investigate a Local Thermodynamic Equilibrium (LTE) plasma discharge in a Helium atmosphere reactor, operating at 8 MPa pressure. The aim of this research is to investigate the stability and the discharge dynamics across the pressure range 0.1–8 MPa, in which typically the LTE model is valid. The originality of our research is based on two premises:
1) the high-pressure conditions, 0.1–8 MPa, which is usually studied at high current (
2) the low-current conditions, at which the current is between the upper limit of the glow (10–1 A and the start of the low-pressure arc at current of 1 A).
The generation of an arc discharge at current lower than 1 A and pressures higher than 1 MPa is technically challenging due to the constraints of the Paschen law over a wide range of the product of the pressure (
Furthermore, this paper will help to identify the velocity and temperature fields as the operating pressure increases, and how this could be key to the optimization of the process with a view to redesigning the reactor for plasma wastewater treatment. The numerical results will provide information’s about the discharge characteristics, which will be used in the next phase of the research in which a plasma discharge above a liquid medium is considered.
Mathematical Model of this paper discusses the governing Maxwell equations to describe the electromagnetic behavior of the Helium gas, the simulation setup, and the boundary conditions. In Results of the paper, the results when 1) the pressure is varied from 2–8 MPa and the electric current is fixed at 0.35 A, and 2) atmospheric pressure (0.1 MPa) and varying electric current (0.25–0.45 A) are presented. Finally, in Discussion of the paper, conclusions are drawn based on the outcome and discussion of the results.
Mathematical Model
Assumptions
The time-dependent mathematical model is based on the following main assumptions:
• The Helium plasma is considered as a single continuous fluid.
• The plasma is optically thin and modelled using the Local Thermodynamic Equilibrium (LTE) model. The thermodynamic properties and transport coefficients are based on those provided by EquilTheTA [19–24].
• The gravitational force is included and acts in the negative x direction as per the coordinate system in Figure 1.
• The Helium gas flow is turbulent.
Governing Equations
The fundamental laws which govern the mechanics of fluids are the continuity, momentum, and energy equations. When integrated over a finite control volume, the continuity, momentum, and energy equations are given by Equations 1–3 respectively.
The fundamental laws which describe the electromagnetic behavior of a material are Maxwell’s equations and the conservation of electric charge. Maxwell’s equations are given by Eqs 4–7 while the continuity equation for the charge within a control volume is given by Eq. 8.
The relationship between the electric current density
Magnetohydrodynamics (MHD) describes the interaction between electrically conducting fluids (such as plasma) and electromagnetic fields. The plasma experiences a body force per unit volume known as the Lorentz force (fL) and is described by Eq. 10.
Computational Domain and Mesh
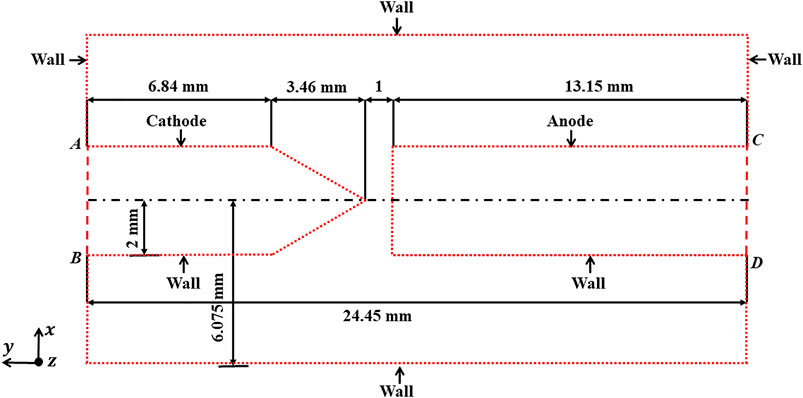
The computational domain is based on the geometry investigated by Ref. [25]. An annotated two-dimensional view of the computational domain is shown in Figure 1.
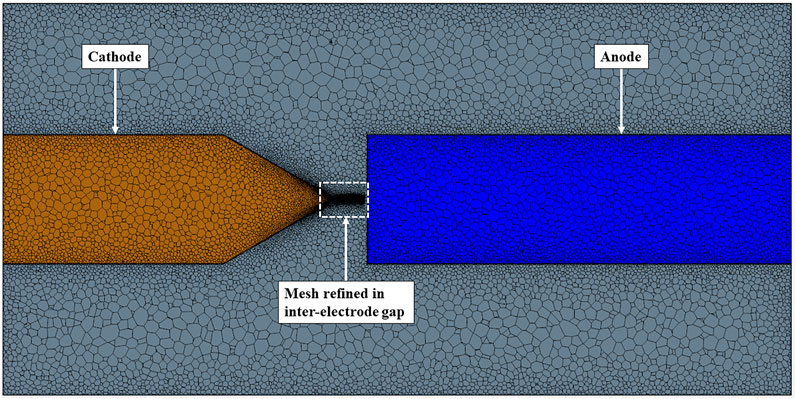
The mesh is refined in the inter-electrode gap since this is the physical space where the plasma arc is initially ignited, which shall result in high spatial gradients. The volume mesh was generated using polyhedral cells. Prism layers were generated next to wall surfaces and boundary conditions. The prism layers can capture near wall flow accurately, which is critical for determining the forces and heat transfer on walls.
A cell base size of 0.1 mm was used for the bulk Helium gas region. A volumetric control in the form of a cylinder was used in the inter-electrode gap to achieve a smaller cell base size in this region. The cylinder was created with a diameter of 2 mm and length of 1 mm. The volumetric control contained a cell size corresponding to 10% of the base size. The prism layers consisted of two layers with a total thickness corresponding to 10% of the cell base size. The volume mesh contained a total of 1763280 cells and can be viewed in Figure 2.
Simulation Setup and Boundary Conditions
In plasma arc simulations, the Ohmic heating represents a source term in the energy equation. However, modelling an electric current through an isolated gas at room temperature causes numerical instability due to the large scale of Ohmic heating and a low initial electrical conductivity. To overcome this obstacle, an artificial electrical conductivity (AEC) channel in the Helium region was defined. This channel allowed for the electrical conductivity to be artificially raised by specifying a minimum electrical conductivity which allowed for the ignition of an electrical spark. Similar approaches to ignite the arc have also been used by Refs. [25–29].
The AEC channel is defined as a cylinder with a diameter of 0.2 mm and length of 3 mm and is positioned in the inter-electrode region. The AEC is defined using a field function and states that
The arc is further stabilized during the initial iterations by specifying an initial hot channel (IHC) as an initial condition for the Helium gas. The IHC is positioned in the inter-electrode region. A field function was used to define the initial temperature which states that
These AEC and IHC conditions are specific to the
The time step is set to 0.25 μs for the first 2 ms of the simulation. Thereafter the time step is set to 1 μs up to a physical time of 50 ms [25].
Net Emission Coefficients (NEC) are widely used in CFD simulations and are based on the assumption of Local Thermodynamic Equilibrium [30]. The use of NEC allows the simulation to pre-compute the energy balance within the arc among emitted, self-absorbed, and radiated energy. Therefore, it provides an estimation of the net radiation lost by the arc, by assuming a simple shape and current-dependent size for the arc. Refs. [31–33] have shown that the NEC is a good approximation to be used in numerical modelling in order to characterize the radiation losses in hot regions while taking into consideration the absorption. The data for the NEC values used in all the simulations are provided at atmospheric pressure [34].
The Lorentz force was specified as a user-defined momentum source. A field function was used to define the Lorentz force as specified in Eq. 10.
Reference [35] showed that an arc discharge can be split into three main domains: the near-cathode zone, the positive arc column and the near-anode zone. The plasma increasingly deviates from equilibrium conditions closer to the near-cathode and near-anode zones. The result is a strong difference in electrical behaviour between these zones.
The discharge voltage
An empirical formula proposed by Ref. [36] was used to define the near-cathode and near-anode voltage drop. The empirical formula is given in Eq. 12, where a, d are coefficients for a gas at atmospheric pressure.
All boundaries have been defined as walls. A wall boundary represents an impermeable surface which confines the solid (electrodes) and fluid (Helium plasma) regions. The cathode and anode boundaries were split as defined by AB and CD as shown in Figure 1. The boundary conditions for the simulation are given in Table 1.
A negative polarity was specified for the cathode and the electric current was imposed in the region of 0.25–0.45 A. At each time step (n), the cathode electric potential is fitted to maintain the target electric current.
Results
A parametric study has been performed to determine the effect of pressure. This study was performed in the pressure range of 2–8 MPa with the electric current fixed at 0.35 A. Thereafter, the simulation results at atmospheric pressure (
Influence of Pressure When Electric Current Is Fixed (I = 0.35 A)
The pressure was varied between 2 and 8 MPa to determine the influence of pressure on electric potential
The temperature and density variation in the x axis direction at the center of the inter-electrode gap is given in Figure 3 and Figure 4 respectively. There is a small deviation between maximum and minimum temperatures for all cases. The high temperature in the discharge region as opposed to the lower temperature at the walls of the reactor can be clearly observed.
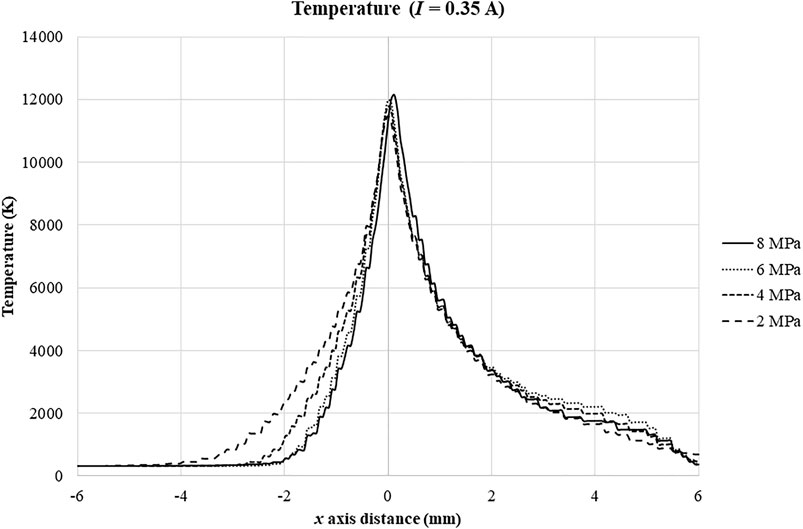
FIGURE 3. Temperature in the x axis direction at the center of the inter-electrode gap (
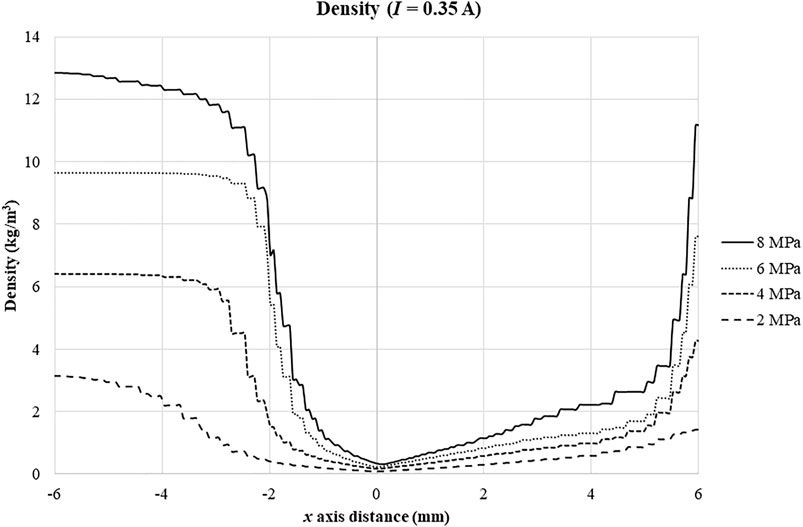
FIGURE 4. Density in the x axis direction at the center of the inter-electrode gap (
This variation in temperature results in high density gradients as can be seen in Figure 4. The density variation at the cooler regions of the reactor (i.e., −6 and +6 mm distance) is much larger at 8 MPa when compared to 2 MPa. At +6 mm distance, the increase in density between 2 and 8 MPa is 311%.
The large density gradient in the x axis direction, combined with the gravitational force acting in the negative x direction as per Figure 1, becomes the driving force of the natural convection in the reactor at higher pressures. The result of the increased natural convection effect at higher pressure can be seen in the velocity magnitude variation (Figure 5). A larger velocity magnitude variation is observed at higher pressures.
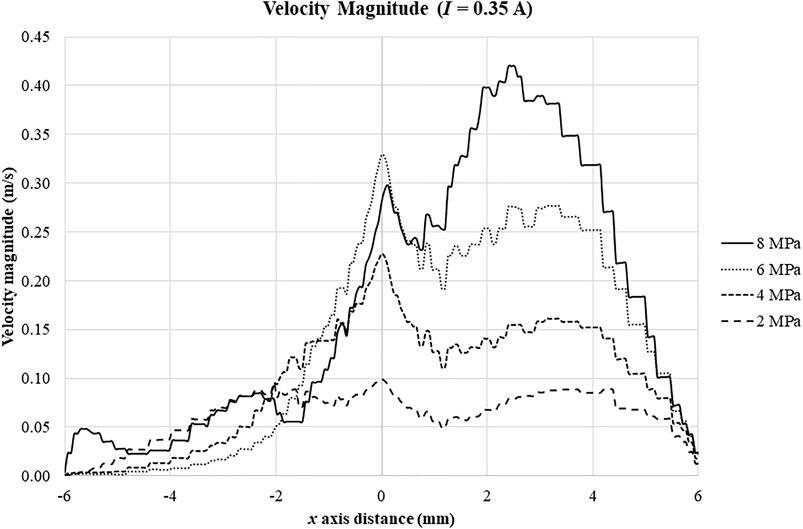
FIGURE 5. Velocity magnitude in the x axis direction at the center of the inter-electrode gap (
The electric current density variation in the x axis direction at the center of the inter-electrode gap is shown in Figure 6. A higher pressure causes a displacement of the arc core and anode arc root towards the top of the reactor. This is due to a higher pressure causing an increased natural convection effect.
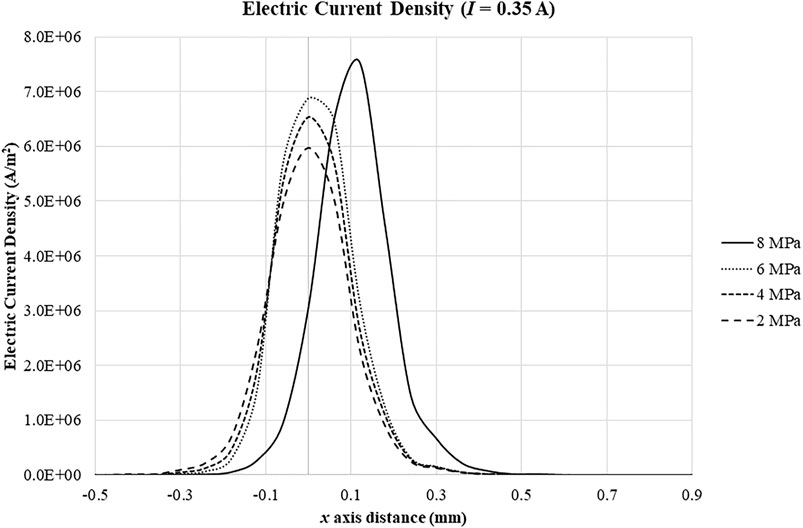
FIGURE 6. Electric current density in the x axis direction at the center of the inter-electrode gap (
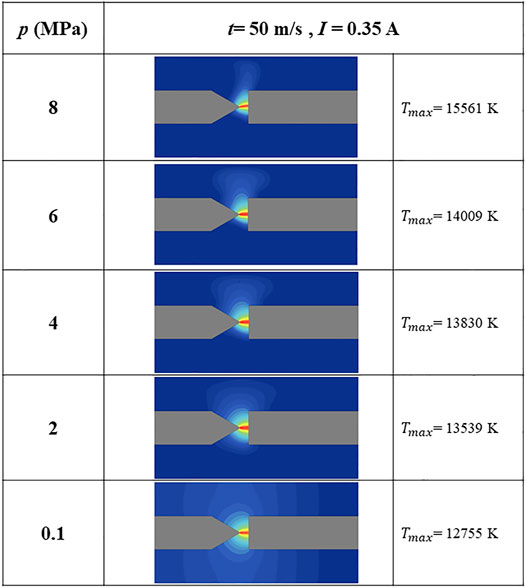
Figures 7, 8 compares the velocity magnitude and temperature profiles respectively, across the entire pressure range. In the 8 MPa case, the natural convection effect causes the Helium gas with the highest velocity magnitude to move towards the top of the reactor. The movement of the gas towards the top of the reactor becomes less pronounced as the pressure decreases. In the 0.1 MPa case, recirculation zones form alongside the cathode. The natural convection effect is greatly reduced, and the maximum velocity magnitude is 66% lower than the 8 MPa case.
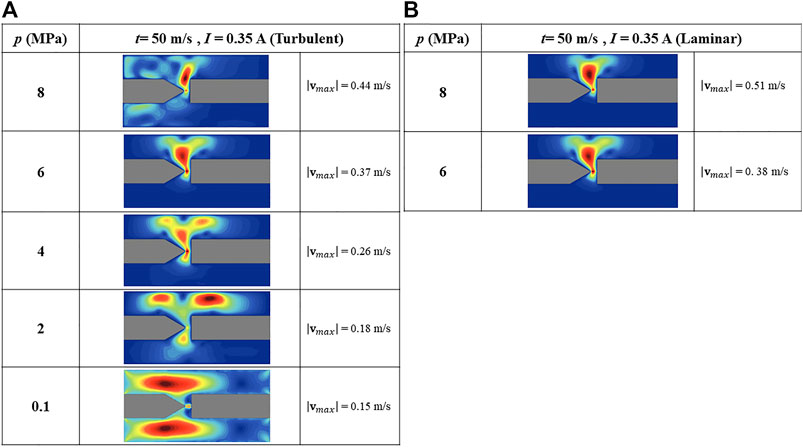
FIGURE 7. Velocity magnitude comparison (
The velocity profiles from the 8 and 6 MPa simulations considering a laminar flow model are shown alongside the turbulent results in Figure 7. This comparison was performed to evaluate the effect of turbulent and laminar viscous regimes on the Helium gas velocity field in the reactor. A similar velocity field in the reactor is observed for both the turbulent and laminar models at a physical time of 50 ms. The velocity magnitude calculated by the turbulent model is 14% lower than that from the laminar flow model for the 8 MPa case, while there are no appreciable differences for the 6 MPa case.
The natural convection effect causes a slight bending of the discharge as seen in the 8 MPa temperature profile. A decrease in pressure causes the bending effect to diminish, and a low current arc type of discharge is observed at lower pressures.
Atmospheric Pressure Discharge (p = 0.1 MPa)
Plasma discharges in contact with liquids are often investigated at atmospheric pressure (
The Experimental Setup and the Evolution of the Electric Potential
The reactor used in the experiment and the one simulated in this study have the following similarities: the dimensions are equivalent and therefore the cylindrical discharge chamber is approximately 2.5 cm3, the reactor is aligned in the horizontal direction, the cathode has a conical tip and is connected to the high voltage port of the power generator which is operated under negative polarity and DC voltage, the reactor operates with Helium, and the inter-electrode gap is 1 mm and the operating pressure is 0.1 MPa, while varying the electric current. The experimental electrical characterization was conducted in a tip-to-plane electrode configuration in a reactor chamber with capability of up to 20 MPa. The reactor is equipped with a K-type thermocouple to measure the temperature in the reactor and a water-cooling jacket. The reactor is powered by a Technix high voltage power supply, which is current controlled and set at an ignition voltage of 9 kV. The operating current is set on the power supply unit and can be measured using a Chauvin hall effect current clamp, while the voltage can be measured using an Elditest 30-kV high voltage probe, connected to the Wave Jet 3540 A digital oscilloscope via BNC connect cables from the current and voltage probes. The Helium gas is filled into the reactor from the Helium baseline 5.0 cylinder to achieve the operating pressure. The Helium gas cylinder was purchased from Afrox, with a minimum purity of 99.999%.
In the experiment, the two electrodes are initially in contact, and the discharge chamber was filled with Helium at atmospheric pressure. A voltmeter was also connected in parallel to verify the consistency of the recorded voltage. The same procedure was repeated for the range of electric currents investigated.
The experimental results are compared with the simulation results in Figure 9. Both the simulation results and experiment measurements show a general trend of the electric potential decreasing as the electric current increased. The experimental and simulation results are in closer agreement at lower electric currents.
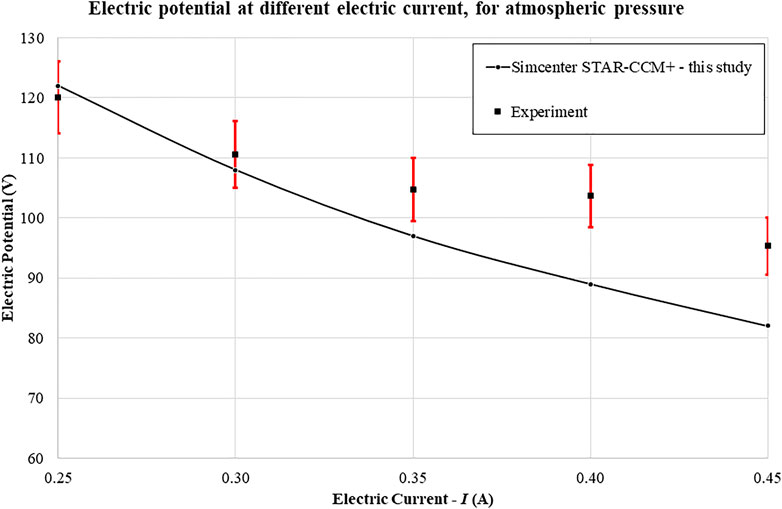
FIGURE 9. Comparison of electric potential as a function of electric current. The experimental results contain a 5% error margin.
Discharge Behavior at Fixed Conditions (
The temperature, density variation and velocity magnitude in the x axis direction at the center of the inter-electrode gap for the atmospheric pressure discharge when
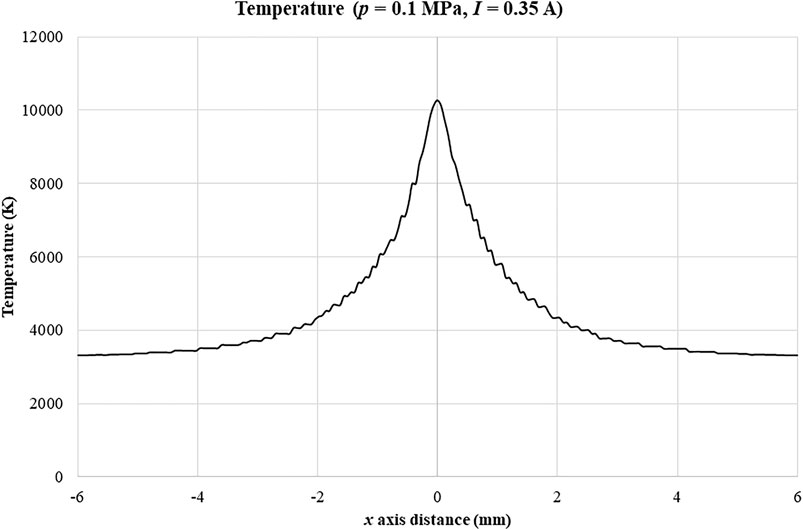
FIGURE 10. Temperature in the x axis direction at the center of the inter-electrode gap (
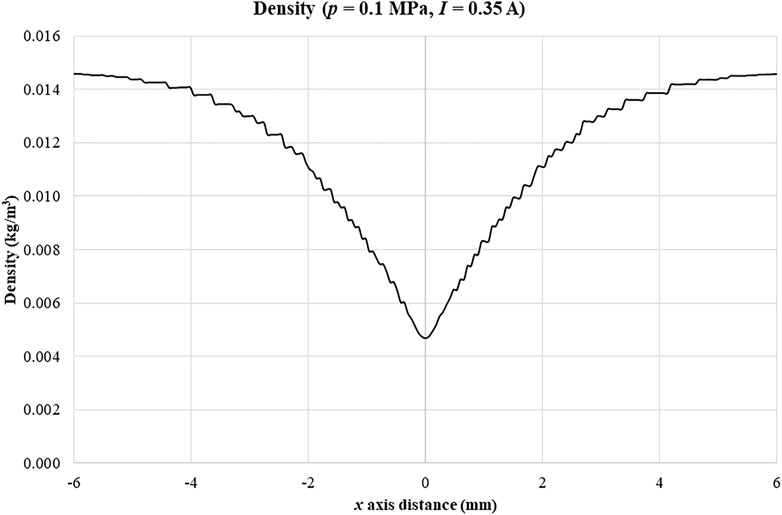
FIGURE 11. Density in the x axis direction at the center of the inter-electrode gap (
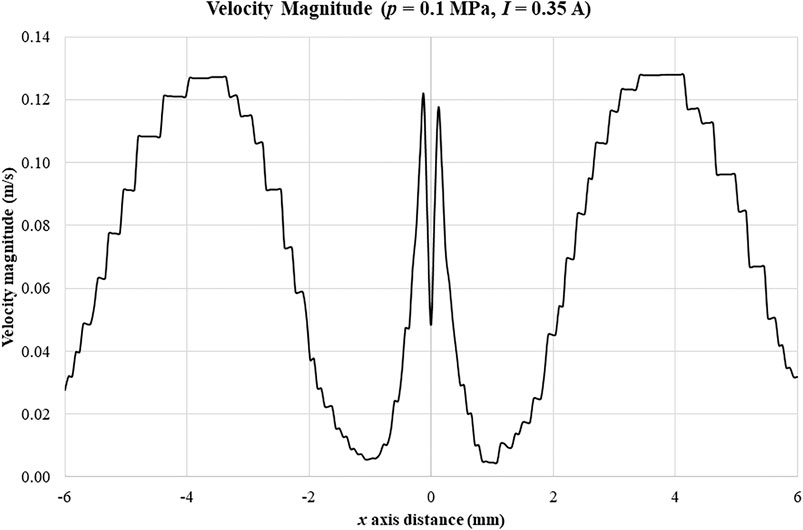
FIGURE 12. Velocity magnitude in the x axis direction at the center of the inter-electrode gap (
The density variation between maximum and minimum values for the atmospheric pressure discharge is not as large as that observed for higher pressures (see Figure 4). This observation indicates that the natural convection effect will not be as dominant as is the case with higher pressures. These plots for the atmospheric pressure discharge show a symmetric shape around the 0 mm point which is expected from a low current arc type discharge.
Discharge Behavior Under Varying Electric Current (
The temperature in the x axis direction at the center of the inter-electrode gap for the atmospheric pressure discharge for varying electric current is given in Figure 13. Panel (a) shows a general trend of increasing temperature with increasing electric current. Panel (b) shows that an almost identical discharge shape is obtained for the electric currents in the range considered.
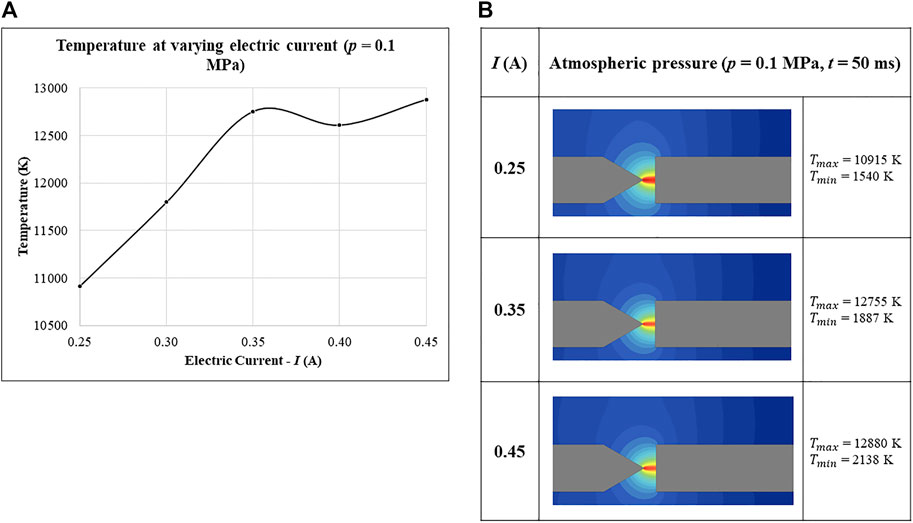
FIGURE 13. (A) Temperature in the x axis direction at the center of the inter-electrode gap for varying current, (B) Images of the arc discharge temperature at varying current; (
The electric current density in the x axis direction at the center of the inter-electrode gap at atmospheric pressure discharge for different electric currents is given in Figure 14. The trend shown in panel (a) is similar to the temperature plot (see Figure 13) showing that the electric current density tends to increase with electric current. As the electric current increases, the ions bombarding the cathode also increase, inducing an increase in electric current density. Panel (b) shows that an almost identical electric current density profile is obtained across the electric current range which was investigated.
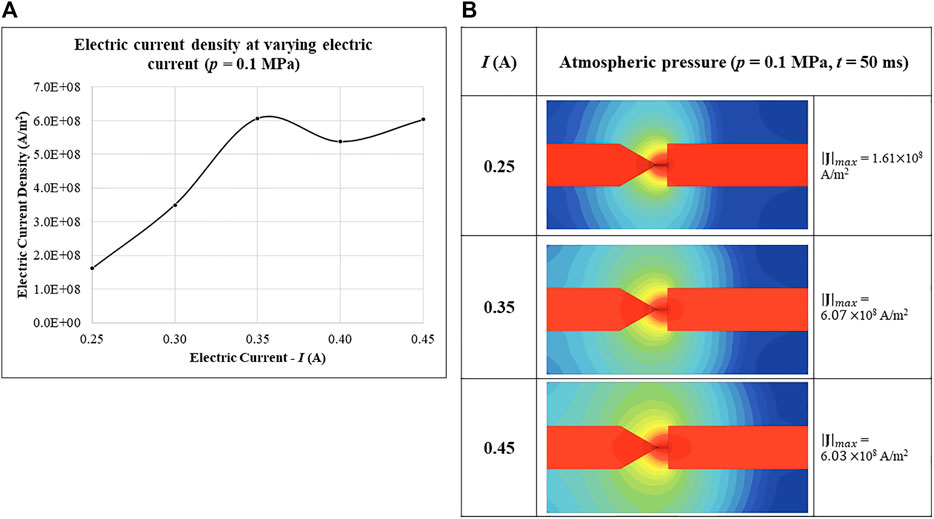
FIGURE 14. (A) Electric current density in the x axis direction at the center of the inter-electrode gap for varying current (
The velocity magnitude in the x axis direction at the center of the inter-electrode gap for the atmospheric pressure discharge for varying electric current is given in Figure 15. The trend in panel (a) shows a very slight fluctuation in velocity magnitude as the electric current is varied. This observation shows that electric current does not have a large impact on velocity magnitude. Panel (b) again shows that an almost identical velocity magnitude profile is obtained across the electric current range which was investigated.
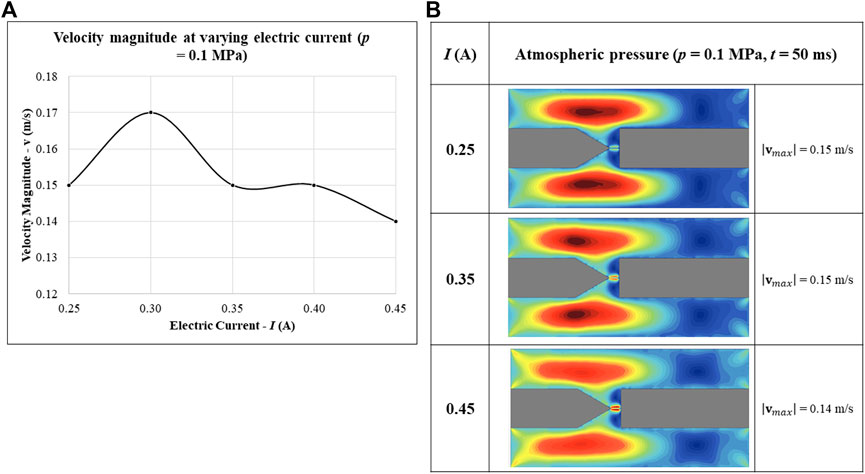
FIGURE 15. (A) Velocity magnitude in the x axis direction at the center of the inter-electrode gap for varying current (
Discussion
It is important to mention that given the operating conditions of the experiment (high pressure
At a relatively low current (less than a microampere), the electric field strength is not sufficiently large enough to generate a self-sustained discharge. The glow discharge is categorized into two types: the normal glow, and the abnormal glow. As the voltage and current continue to increase, a glow-to-arc discharge transition begins to occur due to cathode ions bombarding which eventually leads to an arc discharge generated at current <1 A.
The main highlight in this research is the fact that according to Ref. [18], arc discharges are characterized by high current (
Values of pressure higher than, 1 MPa are considered as very high pressure, while for arc generated at
Conclusion
The pressure was varied between 2 and 8 MPa to determine the influence of pressure on discharge parameters. The large density gradient in the x axis direction is present at higher pressure and has a strong influence on the velocity magnitude in the reactor.
The simulation and experimental results at atmospheric pressure showed the general trend of decreasing electric potential values as the current increased. Both sets of results were in closer agreement at the lower range of electric current. Any discrepancy between the experimental and simulated electric potential is mainly due to the electrode characterization, a phenomenon which is not fully understood within the context of low current and high pressure as supported by Ref. [42].
The natural convection effect is not dominant at atmospheric pressure. This can be observed in the symmetry of the temperature, density and velocity magnitude plots which were generated at an electric current of 0.35 A.
At atmospheric pressure, a larger temperature value is calculated as the electric current increases. An almost identical low current arc discharge shape was observed across the electric current range which was investigated. An increase in electric current resulted in the calculation of larger electric current density values. This was expected as more energy is being added to the reactor system.
Increasing electric current does not have a large impact on velocity magnitude at atmospheric pressure. A lower velocity magnitude was observed at atmospheric pressure compared to a high pressure. The velocity plot at atmospheric pressure is different to that at high pressure due to the less pronounced natural convection effect.
The study has shown that the CFD results can provide useful trends to design a high pressure, low current plasma reactor. This data will be used to influence the design of a reactor. Future works will investigate the interaction of the plasma discharge with a liquid at atmospheric pressure for applications of wastewater treatment.
Future developments can include investigation on streamers and ionization waves [43]. Such a simulation can present the challenges of low pressures and super short timescales.
Data Availability Statement
The original contributions presented in the study are included in the article, further inquiries can be directed to the corresponding author.
Author Contributions
AM was the main author and responsible for the first draft of the manuscript. All authors provided review and comment on the subsequent versions of the manuscript. AM was responsible for CFD simulations; experimental measurements; analysis and interpretation of results. AD and GC provided suggestions to improve the mathematical model and the manuscript. They also performed the calculation of thermodynamic and transport properties of Helium plasma at different temperature and pressures using the EquilTheTA tool. SI was the main academic and research supervisor. He has provided support with the experimental measurements, model setup, analysis, and interpretation of results. He also provided input, review and editing towards the manuscript. All authors read and approved the final manuscript.
Funding
The corresponding author, SI, is funded by the Royal Society as a FLAIR Fellow (FLR\R1\201683).
Conflict of Interest
The authors declare that the research was conducted in the absence of any commercial or financial relationships that could be construed as a potential conflict of interest.
Publisher’s Note
All claims expressed in this article are solely those of the authors and do not necessarily represent those of their affiliated organizations, or those of the publisher, the editors and the reviewers. Any product that may be evaluated in this article, or claim that may be made by its manufacturer, is not guaranteed or endorsed by the publisher.
Acknowledgments
This work was supported by South Africa's Centre for High Performance Computing (CHPC).
References
1. Vollmer D, Shaad K, Souter NJ, Farrell T, Dudgeon D, Sullivan CA, et al. Integrating the Social, Hydrological and Ecological Dimensions of Freshwater Health: The Freshwater Health Index. Sci Total Environ. (2018) 627:304–13. doi:10.1016/j.scitotenv.2018.01.040
2. Foster J. Plasma-based Water Purification: Challenges and Prospects for the Future. Phys Plasmas. (2017) 24(5). doi:10.1063/1.4977921
3. Cheng H, Chen S, Wu Y, Ho D. Non-Thermal Plasma Technology for Degradation of Organic Compounds in Wastewater Control: A Critical Review. J Environ Eng Manage. (2007) 17(6):427–33.
4. Chandana L, Sangeetha CJ, Shashidhar T, Subrahmanyam C. Non-thermal Atmospheric Pressure Plasma Jet for the Bacterial Inactivation in an Aqueous Medium. Sci Total Environ. (2018) 640-641:493–500. doi:10.1016/j.scitotenv.2018.05.342
5. Muhammad Arif M, Abdul G, Salman Akbar M. Water Purification by Electrical Discharges. Plasma Sourc Sci Techn. (2001) 10(1):82. doi:10.1088/0963-0252/10/1/311
6. Montazersadgh F. Computational Studies of Plasma-Liquid Interactions. Loughborough, Leicestershire, England: Loughborough University (2020).
7. Wang X, Zhao D, Tan X, Chen Y, Chen Z, Xiao H. Discharge Characteristics of Plasma Induced by Water Drop and its Potential for Water Treatment. Chem Eng J. (2017) 328:708–16. doi:10.1016/j.cej.2017.07.082
8. Barillas L. Design of a Prototype of Water Purification by Plasma Technology as the Foundation for an Industrial Wastewater Plant. J Phys Conf Ser. (2015) 591:012057. doi:10.1088/1742-6596/591/1/012057
9. Locke BR, Sato M, Sunka P, Hoffmann MR, Chang J-S. Electrohydraulic Discharge and Nonthermal Plasma for Water Treatment. Ind Eng Chem Res. (2006) 45(3):882–905. doi:10.1021/ie050981u
10. Bruggeman P, Schram DC. On OH Production in Water Containing Atmospheric Pressure Plasmas. Plasma Sourc Sci. Technol. (2010) 19(4):045025. doi:10.1088/0963-0252/19/4/045025
11. Fouad F, Mouffok Redouane G, Smaïl B, Guyon C, Ognier S, Addou A. Conception of a Novel spray tower Plasma-Reactor in a Spatial post-discharge Configuration: Pollutants Remote Treatment. J Hazard Mater. (2017) 321:661–71. doi:10.1016/j.jhazmat.2016.09.052
12. Kondeti VSSK, Bruggeman P. The Interaction of an Atmospheric Pressure Plasma Jet with Liquid Water: Dimple Dynamics and its Impact on crystal Violet Decomposition. J Phys D Appl Phys. (2020) 54. doi:10.1088/1361-6463/abbeb5
13. Kritzer P, Dinjus E. An Assessment of Supercritical Water Oxidation (SCWO). Chem Eng J. (2001) 83(3):207–14. doi:10.1016/s1385-8947(00)00255-2
14. Brunner G. Near and Supercritical Water. Part II: Oxidative Processes. J Supercrit Fluids. (2009) 47:382–90. doi:10.1016/j.supflu.2008.09.001
15. Xu D, Wang S, Zhang J, Tang X, Guo Y, Huang C. Supercritical Water Oxidation of a Pesticide Wastewater. Chem Eng Res Des. (2015) 94:396–406. doi:10.1016/j.cherd.2014.08.016
16. Kolaczkowski ST, Plucinski P, Beltran FJ, Rivas FJ, McLurgh DB. Wet Air Oxidation: a Review of Process Technologies and Aspects in Reactor Design. Chem Eng J. (1999) 73(2):143–60. doi:10.1016/s1385-8947(99)00022-4
17. Zhang Y. Wet Oxidation Technology Based on Organic Wastewater Treatment. J Phys Conf Ser. (2020) 1549:022040. doi:10.1088/1742-6596/1549/2/022040
19. D'Angola A, Colonna G, Gorse C, Capitelli M. Thermodynamic and Transport Properties in Equilibrium Air Plasmas in a Wide Pressure and Temperature Range. Eur Phys J D. (2008) 46(1):129–50. doi:10.1140/epjd/e2007-00305-4
20. D'Angola A, Colonna G, Gorse C, Capitelli M. Thermodynamic Properties of High Temperature Air in Local Thermodynamic Equilibrium: II Accurate Analytical Expression for Electron Molar Fractions. The Eur Phys J D (2011) 65:453–7. doi:10.1140/epjd/e2011-20424-5
21. Colonna G, D’Angola A, Pietanza LD, Capitelli M, Pirani F, Stevanato E, et al. Thermodynamic and Transport Properties of Plasmas Including Silicon-Based Compounds. Plasma Sourc Sci. Technol. (2018) 27(1):015007. doi:10.1088/1361-6595/aa9f9b
22. Colonna G, D’Angola A, Laricchiuta A, Bruno D, Capitelli M. Analytical Expressions of Thermodynamic and Transport Properties of the Martian Atmosphere in a Wide Temperature and Pressure Range. Plasma Chem Plasma Process. (2013) 33:401–31. doi:10.1007/s11090-012-9418-4
23. D'Angola A, Colonna G, Bonomo A, Bruno D, Laricchiuta A, Capitelli M. A Phenomenological Approach for the Transport Properties of Air Plasmas. Eur Phys J D. (2012) 66:205. doi:10.1140/epjd/e2012-30147-8
24. Colonna G, D'Angola A. A Hierarchical Approach for Fast and Accurate Equilibrium Calculation. Comput Phys Commun. (2004) 163(3):177–90. doi:10.1016/j.cpc.2004.08.004
25. Lebouvier A, Iwarere SA, Ramjugernath D, Fulcheri L. 3D Magnetohydrodynamic Modelling of a Dc Low-Current Plasma Arc Batch Reactor at Very High Pressure in Helium. J Phys D: Appl Phys. (2013) 46(14):145203. doi:10.1088/0022-3727/46/14/145203
28. Bernardi D, Colombo V, Coppa GGM, D'Angola A. Simulation of the Ignition Transient in RF Inductively-Coupled Plasma Torches. Eur Phys J D. (2001) 14:337–48. doi:10.1007/s100530170201
29.R Fuchs, M Murmann, and H Nordborg, editors. Towards an Efficient Arc Simulation Framework (2017).
30. Aubrecht V, Bartlova M, Coufal O. Radiative Emission from Air thermal Plasmas with Vapour of Cu or W. J Phys D: Appl Phys. (2010) 43(43):434007. doi:10.1088/0022-3727/43/43/434007
31. Lowke JJ. Predictions of Arc Temperature Profiles Using Approximate Emission Coefficients for Radiation Losses. J Quantitative Spectrosc Radiative Transfer. (1974) 14(2):111–22. doi:10.1016/0022-4073(74)90004-1
32. Billoux T, Cressault Y, Teulet P, Gleizes A. Calculation of the Net Emission Coefficient of an Air thermal Plasma at Very High Pressure. J Phys Conf Ser. (2012) 406:012010. doi:10.1088/1742-6596/406/1/012010
33. Bartlova M, Aubrecht V, Coufal O. Net Emission Coefficients of Radiation in Thermal Plasmas of Air with Carbon Admixture. Belgrade, SerbiaPublications de l'Observatoire Astronomique de Beograd (2010).
34. Cressault Y, Rouffet ME, Gleizes A, Meillot E. Net Emission of Ar-H2-He thermal Plasmas at Atmospheric Pressure. J Phys D: Appl Phys. (2010) 43(33):335204. doi:10.1088/0022-3727/43/33/335204
35. Fulcheri L, Rohani V, Fabry F, Traisnel N. Experimental Electrical Characterization of a Low-Current Tip-Tip Arc Discharge in Helium Atmosphere at Very High Pressure. Plasma Sourc Sci. Technol. (2010) 19(4):045010. doi:10.1088/0963-0252/19/4/045010
36. Rümpler C. Lichtbogensimulation für Niederspannungsschaltgeräte [PhD]. Ilmenau, Germany. Germany: Techn. Univers. Ilmenau (2009).
37. Bruggeman P, Leys C. Non-thermal Plasmas in and in Contact with Liquids. J Phys D: Appl Phys. (2009) 42(5):053001. doi:10.1088/0022-3727/42/5/053001
38. Adamovich I, Baalrud SD, Bogaerts A, Bruggeman PJ, Cappelli M, Colombo V, et al. The 2017 Plasma Roadmap: Low Temperature Plasma Science and Technology. J Phys D: Appl Phys. (2017) 50(32):323001. doi:10.1088/1361-6463/aa76f5
39. Bruggeman PJ, Kushner MJ, Locke BR, Gardeniers JGE, Graham WG, Graves DB, et al. Plasma-liquid Interactions: a Review and Roadmap. Plasma Sourc Sci. Technol. (2016) 25(5):053002. doi:10.1088/0963-0252/25/5/053002
41. Iwarere SA. Synthesis of Hydrocarbons and Fluorocarbons in a Tip-Tip Arc Discharge Reactor at High Presure. Durban, South Africa: University of KwaZulu-Natal (2013).
42. Benilov MS. Modeling the Physics of Interaction of High-Pressure Arcs with Their Electrodes: Advances and Challenges. J Phys D: Appl Phys. (2019) 53(1):013002. doi:10.1088/1361-6463/ab47be
43. Lu X, Ostrikov K. Guided Ionization Waves: The Physics of Repeatability. Appl Phys Rev. (2018) 5:031102. doi:10.1063/1.5031445
Nomenclature
Symbols
Greek alphabet
English alphabet
Keywords: plasma discharges, atmospheric pressure, high pressure, helium gas, low current
Citation: Maharaj A, D’Angola A, Colonna G and Iwarere SA (2021) Modeling and Simulation of Low Current Atmospheric and High-Pressure Helium Plasma Discharges. Front. Phys. 9:748113. doi: 10.3389/fphy.2021.748113
Received: 27 July 2021; Accepted: 14 October 2021;
Published: 08 November 2021.
Edited by:
Ashild Fredriksen, Arctic University of Norway, NorwayReviewed by:
Dmitry Levko, Esgee Technologies (United States), United StatesXinPei Lu, Huazhong University of Science and Technology, China
Copyright © 2021 Maharaj, D’Angola, Colonna and Iwarere. This is an open-access article distributed under the terms of the Creative Commons Attribution License (CC BY). The use, distribution or reproduction in other forums is permitted, provided the original author(s) and the copyright owner(s) are credited and that the original publication in this journal is cited, in accordance with accepted academic practice. No use, distribution or reproduction is permitted which does not comply with these terms.
*Correspondence: Samuel A. Iwarere, c2FtdWVsLml3YXJlcmVAdXAuYWMuemE=
 Avinash Maharaj
 Antonio D’Angola
 Gianpiero Colonna
 Samuel A. Iwarere