
95% of researchers rate our articles as excellent or good
Learn more about the work of our research integrity team to safeguard the quality of each article we publish.
Find out more
ORIGINAL RESEARCH article
Front. Phys. , 16 September 2021
Sec. Optics and Photonics
Volume 9 - 2021 | https://doi.org/10.3389/fphy.2021.746915
This article is part of the Research Topic Optical Fiber-based Plasmonics Biosensors for Biomedical Applications View all 18 articles
 Xiaofeng Wang1
 Qinglin Wang1*
 Tianru Qin2
 Guozhao Zhang1*
 Haiwa Zhang1
 Dandan Sang1
 Cong Wang3
 Jianfu Li4
 Xiaoli Wang4*
 Cailong Liu1
In situ impedance measurements, Raman measurements and theoretical calculations were performed to investigate the electrical transport and vibrational properties of polycrystalline phenanthrene. Two phase transitions were observed in the Raman spectra at 2.3 and 5.9 GPa, while phenanthrene transformed into an amorphous phase above 12.1 GPa. Three discontinuous changes in bulk and grain boundary resistance and relaxation frequency with pressure were attributed to the structural phase transitions. Grain boundaries were found to play a dominant role in the carrier transport process of phenanthrene. The dielectric performance of phenanthrene was effectively improved by pressure. A significant mismatch between Z″ and M″ peaks was observed, which was attributed to the localized electronic conduction in phenanthrene. Theoretical calculations showed that the intramolecular interactions were enhanced under compression. This study offers new insight into the electrical properties as well as grain boundary effect in organic semiconductors at high pressure.
Organic semiconductors have captured much attention due to their outstanding electronic properties and high mechanical flexibility, which enable improved performance of OLEDs, organic field-effect transistors, or organic solar cells [1–4]. Polycyclic aromatic hydrocarbons (PAHs), as the important class of organic semiconductors, are applied in many areas, such as optoelectronics, electronics, and optical technology [5–7].
Pressure has a significant effect on the structure and properties of PAHs [8–11]. For example, naphthalene is partially oligomerized above 15 GPa at room temperature, and this can be promoted by reducing intermolecular distance with the action of pressure [12]; pressure can effectively reduce the bandgap of oligoacenes, which would affect their electron transport performance [13].
Phenanthrene (C14H10) is one of the PAHs and has the simplest flat molecule structure composed of three benzene rings with an armchair configuration. Structure evolution and vibrational features of phenanthrene under high pressure were investigated by x-ray diffraction (XRD) and Raman spectroscopy. Huang et al. [14] have reported three phase transitions of phenanthrene under non-hydrostatic conditions with the space group P21 for phase I (0–2.2 GPa), P2/m for phase II (2.2–5.6 GPa), and P2/m + Pmmm for phase III (5.6–11.4 GPa), whereas the structure has been indexed to the pure Pmmm phase from 11.4 to 20 GPa. Above 20 GPa, it further changed to hydrogenated amorphous carbon structure. Capitani et al. [15] have studied the influence of hydrostatic pressure on the structure of phenanthrene by XRD experiment with helium as pressure transmitting medium. They have observed that a phase transition from P21 to a new phase P1 occurred around 8 GPa. Moreover, P21 and P1 phases coexisted from 8 to 13 GPa, then phenanthrene fully transformed to P1 phase above 13 GPa. When pressure exceeded 20 GPa, the appearance of amorphization could be detected. Hence, there is an evident influence of non-hydrostatic environment on the phase transition path in phenanthrene.
Transformations in the crystal structure caused by pressure inevitably affect the carrier transport behavior and grain boundary effect in polycrystalline. For example, Li et al. [16] have reported the grain boundary effect on the electrical transport properties of β-boron at high pressure. Qin et al. [17] have investigated the dielectric behavior of polycrystalline CaMoO4, and they found that the grain boundaries played a key role in carrier transport process. Zhang et al. [18] have studied the correlation between structural phase transition and electrical transport properties of ZnFe2O4 nanoparticles under high pressure, which concluded that the grain boundary effect was related to the capacity of the charge bounding.
The charge carriers transport in phenanthrene relies on the molecular structure and the form of the molecular packing. Previous studies have clarified the structure and the vibration modes of phenanthrene both at non-hydrostatic/hydrostatic pressure environments. Nevertheless, it remains unclear how pressure regulates the electrical transport behavior of phenanthrene, which limits the design of new phenanthrene-based applications. Meanwhile, another important factor that affects the charge transport processes in polycrystalline phenanthrene is the grain boundary, at which the carrier scattering effect is usually strengthened. However, the studies on the transport properties as well as the grain boundary effect of phenanthrene at high pressure were scarcely tackled. In this work, we investigated the electrical transport behavior of phenanthrene at high pressure by in-situ alternating current (AC) impedance measurements. Raman measurements and density-functional theory (DFT) calculations were also conducted. The contributions of bulk and grain boundaries to the electrical transport properties were evaluated. The influence of pressure on resistance, relaxation frequency, activation energy, permittivity, and dielectric loss factor of phenanthrene pressure were discussed.
Polycrystalline phenanthrene powders with 99.5% purity were purchased from Sigma-Aldrich. High pressure was generated by a diamond anvil cell (DAC) with anvil culet diameter of 300 μm. The parallel-plate electrodes configuration was used for impedance measurements. The detailed electrode fabrication procedures were described in our previous works [19–21]. T301 stainless steel was pre-indented to a thickness of 60 μm. The mixture of cubic boron nitride powder and epoxy was used as the insulating layer. Pressure was calibrated with the R1 fluorescence peak of the ruby [22].
In situ high-pressure AC impedance measurements were carried out by a Solartron 1260 impedance analyzer with a 1296 dielectric interface in the frequency range of 10−2∼106 Hz, and the voltage amplitude was 0.1 V. Impedance measurements were performed at pressures up to 30.3 GPa. In order to avoid the induction of unnecessary additional impedance, pressure transmitting medium was not applied. Raman spectra of phenanthrene were collected during the process from ambient pressure to 31.2 GPa. The excitation source is a laser emitting at 532 nm by a Horiba LabRAM HR Evolution. No pressure medium was used for the Raman measurements to maintain consistency with the impedance experiments.
The calculations for local structural relaxations and electronic properties were performed in the framework of density functional theory within the Perdew-Burke-Ernzerhof generalized gradient approximation (GGA-PBE) [23] and frozen-core all-electron projector-augmented wave (PAW) method [24, 25] as implemented in Vienna ab initio simulation package (VASP) [26], the pseudopotentials were taken from the VASP library, in which 2s22p2 and 1s1 were treated as the valence electrons for C and H atoms, respectively. Cutoff energy of 700 eV and appropriate Monkhorst-Pack [27] k-mesh with k-points density 0.03 Å-1 were chosen to ensure that all the enthalpy calculations were well converged to less than 1 meV/atom. The electron localization function (ELF) was used to describe the charge redistribution and the bonding feature of molecules and solid materials.
The selected Raman spectra in the frequency region of 50–1800 cm−1 were shown in Figures 1A,B. With increasing pressure, all the Raman peaks shift to higher frequencies. The vibrational modes can be divided into intermolecular modes (L1, L2) and intramolecular modes, as in Ref. 14. The pressure dependence of all the vibrational modes was displayed in Figure 1C. The previous results from Ref. 14 were also drawn together by dashed lines. It can be seen that the phase transitions occurred at 2.3 and 5.9 GPa, which are consistent with the results of Ref. 14. The difference of phase transition paths with Capitani et al.15 was caused by nonhydrostatic/hydrostatic pressure environment. With increasing pressure, the C-C-C bending mode (ν1) and intermolecular modes (L1) were split, the intramolecular vibration mode (ν3) disappeared, suggesting that the sample undergoes its first phase transition around 2.3 GPa. Up to 5.9 GPa, the CCC bending mode (ν4) and the C-C stretching mode (ν11) were split, several intramolecular vibration modes (ν12, ν13, ν14, ν19, ν20) disappeared, along with discontinous change in the slope of frequency of the intermolecular modes (L1, L2) around 6.0 GPa (as shown in Supplementary Figure S1), which indicates that the sample transforms from phase II to phase III around 5.9 GPa. The stretching vibration of the C-H bond in the high frequency region under different pressures was shown in the Supplementary Figure S2). Furthermore, the Raman peak of the intermolecular modes had a large blue shift which was attributed to the reduction of the intermolecular distance and the enhancement of the intermolecular interaction [28]. Above 12.1 GPa, phenanthrene transformed to an amorphous state.
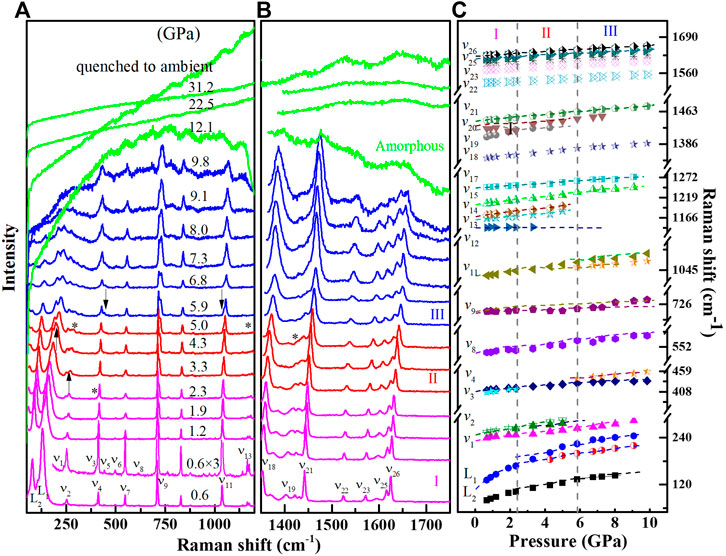
FIGURE 1. High pressure Raman spectra of phenanthrene up to 31.2 GPa. (A) Selective Raman spectra in the frequency range of 50–1200 cm₋1. (B) Selective Raman spectra in the frequency range of 1350–1750 cm₋1. (C) Pressure dependence of the Raman shift for the observed modes. The dashed lines are results from Ref. 14. Dashed vertical lines represent phase boundaries, and phases are assigned with Roman numbers. The upper arrows and asterisks denote the new appearance and the disappearance of peaks, respectively.
Impedance spectroscopy method can distinguish the contribution of bulk and grain boundaries to electrical transport properties. The impedance spectra of phenanthrene at different pressures were shown in Figure 2. There was a big deviation from the ideal semicircle in the Nyquist plots (Z″∼ Z′), which was due to the dispersion effect in the process of electron transportation [29]. In Nyquist plots, bulk and grain boundaries had a large difference in frequency responses. Below 8.6 GPa, Z″ slowly approached Z′ axis in the low-frequency region, and a relatively complete semicircle arc of the grain boundary was shown in Figures 2A,B. However, from 8.6 to 30.3 GPa, the grain boundary resistance increased significantly with pressure, so incomplete arcs appeared in the low-frequency region, as shown in Figures 2C,D. Nyquist plots of phenanthrene indicated that the contributions of bulk and grain boundaries to the electrical transport properties were significantly different, whereas the grain boundary effect played a dominant role. The relaxation frequency which corresponds to the imaginary impedance peak is equal to the reciprocal of the relaxation time constant. As shown in Figures 2E,H the relaxation peaks of the grain boundaries shifted towards lower frequencies with pressure. This indicates that the grain boundary and associated lattice scattering effect on carriers were improved by pressure, which was also convinced by Raman measurements results. Take the ν21 vibration mode (1442 cm−1) for example, as shown in Figure 3, the FWHM increased with increasing pressure, the crystallinity of the sample was weakened, the defects were increased, and the disorder was increased, indicating that the grain boundary effect enhanced lattice scattering on carriers.
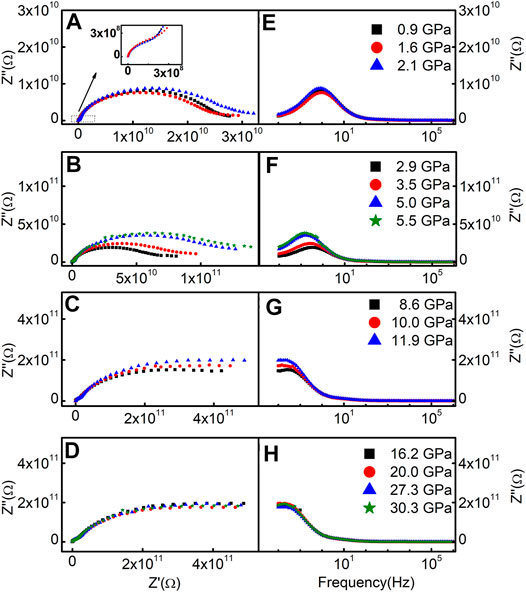
FIGURE 2. Nyquist (Z″-Z′) plots (A–D) and Z″-f plots (E–H) of the impedance data of phenanthrene under different pressures. Inset: the enlargement of the left arc.
However, due to the large difference in the contribution of bulks and grain boundaries, the bulk relaxation peak was not obvious in the Bode plots (Z″∼f). The separation between bulk and grain boundary relaxation process will be clearly illustrated through the modulus representation later.
Since there was a big difference between the frequency responses from bulk and grain boundaries of phenanthrene, the representation as reported by Abrantes et al. was adopted to process the data [30]. The plots of selected impedance data in the Z′- (Z″/f) representation were shown in Figure 4. Three distinct segments were observed in each plot corresponding to different frequency regions. In the high frequency region,
In the moderate frequency region, (fgb<<f<fb),
In the low frequency region (f<<fgb),
where Rb, Rgb, fb, fgb represent the resistance and the relaxation frequency of the bulk and grain boundary respectively, and fel corresponds to the electrode relaxation frequency. From Eq. 1, Eq. 2 and Eq. 3), the electrical parameters (Rt= Rb + Rgb, Rb, Rgb, fb, fgb) of phenanthrene were obtained by fitting the experimental data, as shown in Figure 5.
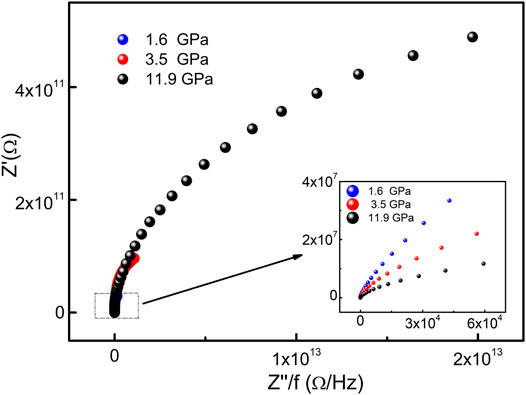
FIGURE 4. Z′- Z″/f plots of phenanthrene at different pressures. Inset: the enlargement of the left arc.
For each parameter versus pressure, three discontinuous changes can be found at 2.9, 7.5, and 13.8 GPa, respectively, which was attributed to the pressure-induced structural phase transitions [14]. Below 13.8 GPa, both bulk and grain boundary resistances increased with pressure. The increase in grain boundary resistance probably resulted from the higher grain boundary density under pressure, which consequently generated additional dangling bonds. This statement was consistent with the decreased grain boundary relaxation frequency with pressure, as shown in Figure 5E. Above 13.8 GPa, there was no obvious variation in resistance in Phase IV, which was related to the emergence of the amorphous structure. This conclusion was consistent with the Raman results. With the increasing of disorder, the electronic states of the system became more localized [31].
Both bulk and grain boundary relaxation frequencies of phenanthrene decreased significantly with pressure in Phases I and II. Above 7.5 GPa, the relaxation frequency was almost constant as the pressure increases in Phases III and IV. The variation of the relaxation frequencies in both bulk and grain boundary regions below 7.5 GPa indicated that the relaxation time of phenanthrene increased with pressure. The electrical transport parameters (Rt, Rb, Rgb, fb, and fgb) of Phase III changed slowly with increasing pressure. The electrical transport mechanism of phenanthrene was modulated by pressure, the electrons transport channels became narrower under compression and were finally fully closed in Phase IV (amorphous state).
In order to analyze the relaxation process of phenanthrene under compression, the pressure dependence of the relaxation activation energy was evaluated. According to the Arrhenius equation, the relationship between the relaxation frequency and the activation energy can be depicted as:
where H represents activation energy, kB is the Boltzmann constant, and T is the temperature. Assume f and H are only the function of pressure, and f0 remains a constant, we have
By linear fitting to the curve lnf-P, the pressure dependence of the activation energy was shown in Table 1.
Below 13.8 GPa, the dH/dP was positive indicating that the required energy for carriers to reach the equilibrium increased with pressure. Therefore, the activation energy increased with increasing pressure. However, in Phase IV, dH/dP of phenanthrene turned to be negative (−0.43 meV/GPa). The decreased activation energy indicated that pressure promotes electrical conductivity [32].
To obtain a deep insight into the carrier transport process of phenanthrene, the dielectric behavior was investigated. The bulk relative permittivity (ɛr) of phenanthrene can be obtained from:
where d is the thickness of a sample, ε0 is the vacuum permittivity, S is the area of the electrode, and fb is the bulk relaxation frequency.
As displayed in Figure 6A, three discontinuous changes at 2.9, 7.5, and 13.8 GPa were observed in the relative permittivity ɛr of phenanthrene at different pressures. ɛr decreased with increasing pressure, which was caused by the decreased dipole moment in alternating electric fields under high pressure. The frequency dependence of both real (ε′) and imaginary (ε″) parts of the complex dielectric permittivity of phenanthrene under high pressure was shown in Figures 6B,C. The value of ε′ implies the energy storage and polarization ability [33], whereas the imaginary part (ε″) reflects the dielectric loss. Below 105 Hz, ε′ decreased with increasing frequency at each pressure. However, when the frequency exceeded 105 Hz, ε′ showed gradually reduction with frequency. In high-frequency region, the electric field alternates too fast to affect the rotation of the dipole. Therefore, the polarization of orientation weakened, and the inflection point moved to lower frequencies, while the real and imaginary parts decreased.

FIGURE 6. (A) Variation of the relative permittivity ɛr with pressure. (B–D) Frequency dependencies of, ε′, ε″ and tanδ of phenanthrene under different pressures. Inset shows the dielectric loss factor (tanδ) at 0.9 GPa during compression and at 0.4 GPa after decompression.
At high frequency, the electric field changes so rapidly that there is a time delay (relaxation) between the space charge polarization and the applied electric field, which resulted in the dielectric loss [34]. The frequency-dependent dielectric loss factor (tanδ) at different pressures was illustrated in Figure 6D. Moreover, when pressure was released to 0.4 GPa, as shown in the inset of Figure 6D, the dielectric loss factor in the low-frequency region became much lower than that at 0.9 GPa under compression. Therefore, the dielectric performance of phenanthrene was effectively improved after a pressure cycle.
The analysis of complex modulus plots (M* = jωC0Z*) can help us have a further understanding of the dielectric behavior of phenanthrene. Two representative Z″ and M″ plots are complementary, the former emphasizes phenomena with large resistance, while the latter shows electrical responses with small capacitance [35, 36]. Two semicircle arcs corresponding to the bulk and grain boundary regions of phenanthrene were shown in Figure 7A. The real part M′ as a function of frequency at different pressures was displayed in Figure 7B. The M′ started to increase with increasing frequency, but then kept a constant value in the high-frequency region. The imaginary part M″ as a function of frequency was shown in Figure 7C. Two peaks in the M″-f plots indicated two types of electrical response mechanisms existing in phenanthrene that represent change from long-range to short-range carrier mobility with increasing frequency [17].
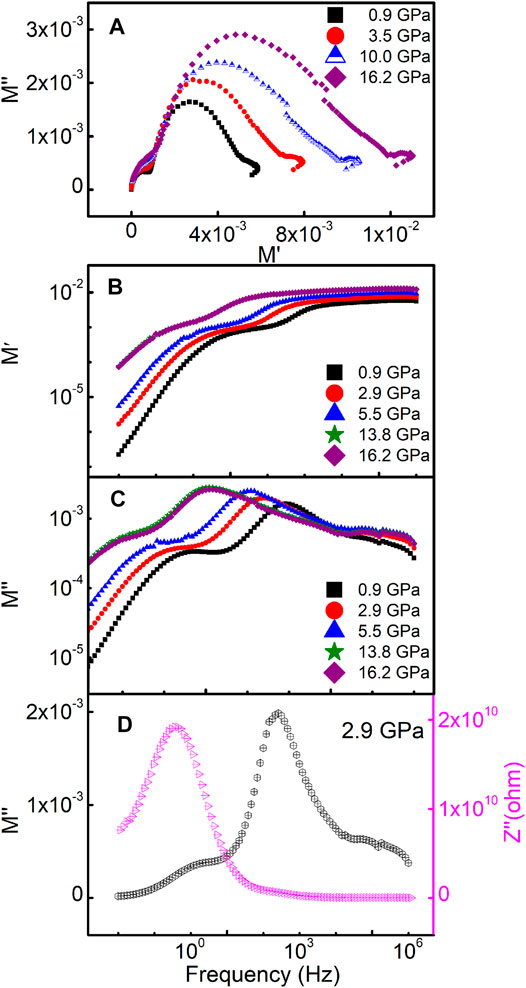
FIGURE 7. (A) Complex modulus plots (M″ ∼ M′) at different pressures; (B, C) variations of M′ and M″ with frequency at different pressures; (D) frequency dependencies of M″ and Z″ in phenanthrene at 2.9 GPa.
The frequency variation of Z″ and M″ of phenanthrene at 2.9 GPa was shown in Figure 7D. High-frequency peak reflects the dipole relaxation at the bulk, whereas the low-frequency peak corresponds to the grain boundary. For an ideal Debye relaxation, the Z″and M″peaks of a particular Resistance-Capacitance component should be coincident on the frequency scale [37]. However, a significant mismatch between Z″and M″peaks was observed, which can be attributed to the localized electronic conduction in phenanthrene [38].
To obtain a deeper insight into the mechanism of the electrical properties of phenanthrene, DFT theoretical calculations were performed. The electron localization functions (ELF), energy band structure, and densities of states of phenanthrene at different pressures were shown in Figure 8. The electron localization function was used to describe the charge redistribution and bonding feature of molecules. Figures 8A,B suggested that the bonds in the C6 ring were covalent bonds, whereas intermolecular H atoms formed lone pairs of Phase I and Phase II at 0.5 and 4 GPa. The bandgap of phenanthrene decreased from 2.98 eV (0 GPa in Phase I) to 1.50 eV (4 GPa in Phase II) under compression. Because density functional calculations usually lead to a considerable underestimation of the energy gap, the actual band gaps are expected to be much larger, but we can conclude that the bandgap of phenanthrene decreased significantly with pressure. The decreased bandgap improves the transport of electrons at LUMO to HOMO, giving rise to the holes transfer integral in both directions [39]. According to Marcus theory [40], the hopping process is the exchange of electrons and holes between neighboring molecules and the charge transfer rate between two molecules depends on the recombination energy and charge transfer integral. Thus, the calculated decreased bandgap of phenanthrene was caused by increased charge transfer integral and/or by decreased recombination energy. Compared with the experimental results, the increased bulk resistance with pressure could be due to the increased grain boundary density and/or the pressure-induced disordering, which results in the enhancement of lattice scattering with increasing pressure.
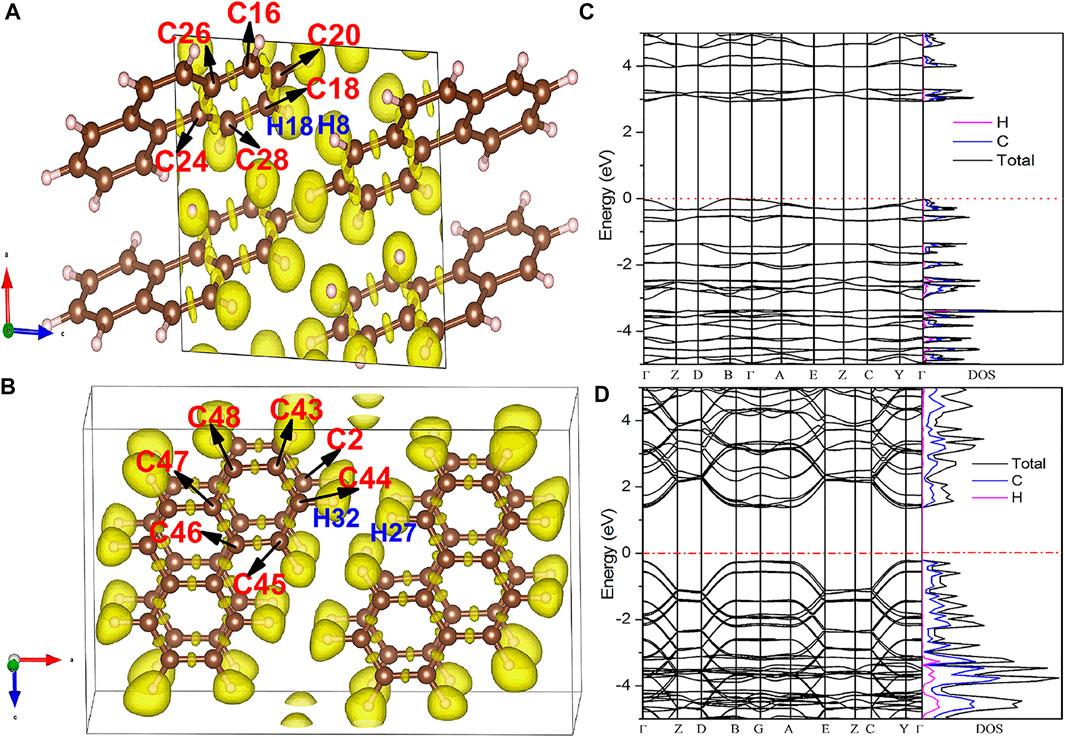
FIGURE 8. Electronic properties of Phase I and Phase II in phenanthrene at 0.5 and 4 GPa. Electron localization function (ELF) (A, B), band structure (left), and Partial DOSs (right)(C, D).
The arrangement of molecules in the crystal structure is mainly determined by molecular conformation and intramolecular interactions. Due to the non-hydrostatic environment, the intramolecular interactions of phenanthrene demonstrated anisotropic changes with pressure. As shown in Figure 9, the intramolecular and intermolecular distances of phenanthrene decreased with pressure, leading to enhanced intramolecular interaction. This can provide an explanation for both increased bulk resistance and reduced relaxation frequency. The pressure dependence of intramolecular and intermolecular bond distance was shown in Supplementary Table S1. It can be seen that the intermolecular C-C and H-H interaction was more sensitive with pressure than the intramolecular C-C ones.
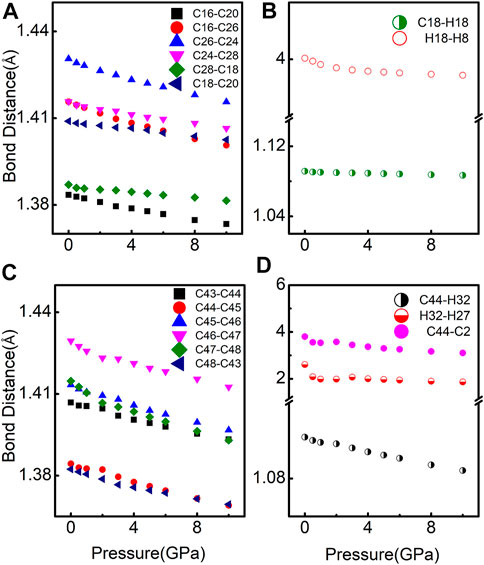
FIGURE 9. (A, C) Intramolecular C-C distances; (B, D) intermolecular bond distances of phenanthrene under different pressures at phases I and II.
In summary, the vibrational and electrical properties of phenanthrene were investigated by high-pressure in situ impedance spectra measurements, Raman measurements and DFT calculations. Two phase transitions occurred at 2.3 and 5.9 GPa, and then transformed to an amorphous state above 12.1 GPa. Below 13.8 GPa, both bulk and grain boundary resistance increased with pressure. The dielectric performance of phenanthrene was effectively improved after a pressure cycle. A significant mismatch between Z″and M″peaks was observed, which can be attributed to the localized electronic conduction in phenanthrene. The calculated decreased bandgap of phenanthrene was caused by increased charge transfer integral and/or by decreased recombination energy. Our results provide a better understanding of the correlation between structural modification and electrical transport properties in phenanthrene and establish general guidelines for optimization of the applications of new organic semiconductors.
The original contributions presented in the study are included in the article/Supplementary Material, further inquiries can be directed to the corresponding authors.
QW and GZ designed and supervised this study. X-F W and QW performed the experiments. X-L W and JL were responsible for the theoretical calculations. X-F W, TQ and QW analyzed the data and wrote the manuscript. HZ, DS, CW and CL contributed to manuscript revision. All authors interpreted data and provided critical insights, while read and approved the content of the manuscript.
This work was supported by the National Natural Science Foundation of China (Grant Nos. 11604133, 62104090, 11874174, 11974154, and 11674144), the Natural Science Foundation of Shandong Province (Grant Nos. ZR2017QA013, 2019GGX103023, ZR2018JL003, and ZR2018MA038), the Science and Technology Plan of Youth Innovation Team for Universities of Shandong Province (Grant No. 2019KJJ019), the Introduction and Cultivation Plan of Youth Innovation Talents for Universities of Shandong Province, the Heilongjiang Provincial Education Department Project Subsidy (Project No. 1354MSYQN022), the Open Project of State Key Laboratory of Superhard Materials (Jilin University, Grant Nos. 201503 and 201612), the Open Project of Shandong Key Laboratory of Optical Communication Science and Technology (Liaocheng University, SDOC 201902), Fundamental Research Funds for the Central Universities (buctrc 202122) and the Research Funding of Liaocheng University (Grant Nos. 318012016, 318051610, and 318051612).
The authors declare that the research was conducted in the absence of any commercial or financial relationships that could be construed as a potential conflict of interest.
The reviewer (FK) declared a past co-authorship with one of the authors (DS) to the handling editor.
All claims expressed in this article are solely those of the authors and do not necessarily represent those of their affiliated organizations, or those of the publisher, the editors and the reviewers. Any product that may be evaluated in this article, or claim that may be made by its manufacturer, is not guaranteed or endorsed by the publisher.
The Supplementary Material for this article can be found online at: https://www.frontiersin.org/articles/10.3389/fphy.2021.746915/full#supplementary-material
1. Xu C, Liu Z, lee E-C. Stability and efficiency improved perovskite solar cells through tuning the hydrophobicity of the hole transport layer with an organic semiconductor. J Mater Chem C (2021) 9(2):679–86. doi:10.1039/d0tc05113f
2. Tzschoppe M, Huck C, Butkevich A, Günther B, Ulrich C, Rose JN, et al. Interface properties and dopability of an organic semiconductor: TAPP-Br variable as molecule but inert in the condensed phase. J Mater Chem C (2020) 8(29):9898–908. doi:10.1039/d0tc01555e
3. Shinar J, Shinar R. Organic light-emitting devices (oleds) and oled-based chemical and biological sensors: an overview. J Phys D: Appl Phys (2008) 41(13):133001. doi:10.1088/0022-3727/41/13/133001
4. Fang AW, Park H, Kuo Y, Jones R, Cohen O, Liang D, et al. Hybrid silicon evanescent devices Mater Today (2007) 10(7-8):28–35. doi:10.1016/s1369-7021(07)70177-3
5. Babolghani FM, Mohammadi-Manesh E. Simulation and experimental study of fet biosensor to detect polycyclic aromatic hydrocarbons. Appl Surf Sci (2019) 488:662–70. doi:10.1016/j.apsusc.2019.05.202
6. Cebrián C. Ullazine-based materials: towards novel opportunities in organic electronics. J Mater Chem C (2018) 6(44):11943–50.
7. Pazzagli S, Lombardi P, Martella D, Colautti A, Tiribilli B, Cataliotti FS, et al. Self-assembled nanocrystals of polycyclic aromatic hydrocarbons show photostable single-photon emission. ACS Nano (2018) 12:4295–303. doi:10.1039/c8tc03573c
8. Farina L, Syassen K, Brillante A, Della Valle RG, Venuti E, Karl N. Pentacene at high pressure. High Pressure Res. (2003) 23(3):349–54. doi:10.1080/0895795031000139145
9. Fanetti S, Citroni M, Malavasi L, Artioli GA, Postorino P, Bini R. High-pressure optical properties and chemical stability of picene. J Phys Chem C (2013) 117(10):5343–51. doi:10.1021/jp4006789
10. Dreger ZA, Balasubramaniam E, Gupta YM, Joly AG. High-Pressure Effects on the Electronic Structure of Anthracene Single Crystals: Role of Nonhydrostaticity. J Phys Chem A (2009) 113(8):1489–96. doi:10.1021/jp808247k
11. Dreger ZA, Lucas H, Gupta YM. High-Pressure effects on fluorescence of anthracene crystals. J Phys Chem B (2003) 107(35):9268–74. doi:10.1021/jp030505m
12. Shinozaki A, Mimura K, Nishida T, Inoue T, Nakano S, Kagi H. Stability and partial oligomerization of naphthalene under high pressure at room temperature. Chem Phys Lett (2016) 662:263–7. doi:10.1016/j.cplett.2016.09.042
13. Schatschneider B, Monaco S, Tkatchenko A, Liang J-J. Understanding the structure and electronic properties of molecular crystals under pressure: application of dispersion corrected DFT to oligoacenes. J Phys Chem A (2013) 117(34):8323–31. doi:10.1021/jp406573n
14. Huang Q-W, Zhang J, Berlie A, Qin Z-X, Zhao X-M, Zhang J-B, et al. Structural and vibrational properties of phenanthrene under pressure. J Chem Phys (2013) 139(10):104302. doi:10.1063/1.4820359
15. Capitani F, Höppner M, Malavasi L, Marini C, Artioli GA, Hanfland M, et al. Structural evolution of solid phenanthrene at high pressures. J Phys Chem C (2016) 120(26):14310–6. doi:10.1021/acs.jpcc.6b04326
16. Li M, Yang J, Snoussi K, Li L, Wang H, Gao C. Grain boundary effect on the β-boron electrical transport properties at high pressure. Appl Phys Lett (2010) 97(17):174101. doi:10.1063/1.3505751
17. Qin T, Wang Q, Yue D, Shen W, Yan Y, Han Y, et al. High-pressure dielectric behavior of polycrystalline CaMoO4: The role of grain boundaries. J Alloys Comp (2018) 730:1–6. doi:10.1016/j.jallcom.2017.09.286
18. Zhang J, Zhang Y, Wu X, Ma Y, Chien S-Y, Guan R, et al. Correlation between Structural Changes and Electrical Transport Properties of Spinel ZnFe2O4 Nanoparticles under High Pressure. ACS Appl Mater Inter (2018) 10(49):42856–64. doi:10.1021/acsami.8b15259
19. Wang Q, Sang D, Guo S, Wang X, Wang W, Zhang B, et al. Dielectric properties and the role of grain boundaries in polycrystalline tetracene at high pressures. CrystEngComm (2019) 21(30):4507–12. doi:10.1039/c9ce00961b
20. Zhang X, Wang X, Wang Q, Ma X, Liu C, Li P, et al. Hydride ion (H⁻) transport behavior in barium hydride under high pressure. Phys Chem Chem Phys (2018) 20(13):8917–23. doi:10.1039/c7cp08386f
21. Wang Q, Liu C, Gao Y, Ma Y, Han Y, Gao C. Mixed conduction and grain boundary effect in lithium niobate under high pressure. Appl Phys Lett (2015) 106(13):132902. doi:10.1063/1.4916828
22. Piermarini GJ, Block S, Barnett JD, Forman RA. Calibration of the pressure dependence of theR1ruby fluorescence line to 195 kbar. J Appl Phys (1975) 46(6):2774–80. doi:10.1063/1.321957
23. Perdew JP, Burke K, Ernzerhof M. Generalized gradient approximation made simple. Phys Rev Lett (1996) 77(18):3865–8. doi:10.1103/physrevlett.77.3865
24. Blöchl PE. Projector augmented-wave method. Phys Rev B (1994) 50(24):17953–79. doi:10.1103/physrevb.50.17953
25. Kresse G, Joubert D. From ultrasoft pseudopotentials to the projector augmented-wave method. Phys Rev B (1999) 59(3):1758–75. doi:10.1103/physrevb.59.1758
26. Kresse G, Furthmüller J. Efficient iterative schemes for ab initiototal-energy calculations using a plane-wave basis set. Phys Rev B (1996) 54(16):11169–86. doi:10.1103/physrevb.54.11169
27. Monkhorst HJ, Pack JD. Special points for Brillouin-zone integrations. Phys Rev B (1976) 13(12):5188–92. doi:10.1103/physrevb.13.5188
28. Goncharov AF, Manaa MR, Zaug JM, Gee RH, Fried LE, Montgomery WB. Polymerization of formic acid under high pressure. Phys Rev Lett (2005) 94(6):065505. doi:10.1103/PhysRevLett.94.065505
29. Schmidt R, Wu J, Leighton C, Terry I. Dielectric response to the low-temperature magnetic defect structure and spin state transition in polycrystalline LaCoO3. Phys Rev B (2009) 79:125105. doi:10.1103/physrevb.79.125105
30. Abrantes JCC, Labrincha JA, Frade JR. An alternative representation of impedance spectra of ceramics. Mater Res Bull (2000) 35(5):727–40. doi:10.1016/s0025-5408(00)00269-5
31. Anderson PW. Absence of diffusion in certain random lattices. Phys Rev (1958) 109(5):1492–505. doi:10.1103/physrev.109.1492
32. Wang Q, Liu C, Ma B, Gao Y, Fitzpatrick M, Li Y, et al. High pressure study of B12As2: Electrical transport behavior and the role of grain boundaries. J Appl Phys (2015) 117(4):045302. doi:10.1063/1.4906462
33. Zhang Y, Gao S, Xing H, Li H. In situ carbon nanotubes encapsulated metal nickel as high-performance microwave absorber from Ni-Zn metal-organic framework derivative. J Alloys Comp (2019) 801:609–18. doi:10.1016/j.jallcom.2019.06.164
34. Chahar D, Taneja S, Thakur P, Thakur A. Remarkable resistivity and improved dielectric properties of Co-Zn nanoferrites for high frequency applications. J Alloys Comp (2020) 843:155681. doi:10.1016/j.jallcom.2020.155681
35. Kagdi AR, Pullar RC, Meena SS, Jotania RB, Mujasam Batoo K. Studies of structural, magnetic and dielectric properties of X-type Barium Zinc hexaferrite Ba2Zn2Fe28O46 powder prepared by combustion treatment method using ginger root extract as a green reducing agent. J Alloys Comp (2020) 842:155120. doi:10.1016/j.jallcom.2020.155120
36. Bhowmik RN, Panneer Muthuselvam I. Dielectric properties of magnetic grains in CoFe1.95Ho0.05O4 spinel ferrite. J Magnetism Magn Mater (2013) 335:64–74. doi:10.1016/j.jmmm.2013.01.041
37. Sinclair DC, West AR. Impedance and modulus spectroscopy of semiconducting BaTiO3 showing positive temperature coefficient of resistance. J Appl Phys (1989) 66(8):3850–6. doi:10.1063/1.344049
38. Li W, Schwartz RW. Maxwell-Wagner relaxations and their contributions to the high permittivity of calcium copper titanate ceramics. Phys Rev B (2007) 75(1):012104. doi:10.1103/physrevb.75.012104
39. Nguyen TP, Shim JH. Hydrostatic pressure effect on charge transport properties of phenacene organic semiconductors. Phys Chem Chem Phys (2016) 18(20):13888–96. doi:10.1039/c6cp00127k
Keywords: phenanthrene, high pressure, dielectric, grain boundary, phase transition
Citation: Wang X, Wang Q, Qin T, Zhang G, Zhang H, Sang D, Wang C, Li J, Wang X and Liu C (2021) Improved Dielectric Properties and Grain Boundary Effect of Phenanthrene Under High Pressure. Front. Phys. 9:746915. doi: 10.3389/fphy.2021.746915
Received: 25 July 2021; Accepted: 03 September 2021;
Published: 16 September 2021.
Edited by:
Venugopal Rao Soma, University of Hyderabad, IndiaReviewed by:
Ganapathy Vaitheeswaran, University of Hyderabad, IndiaCopyright © 2021 Wang, Wang, Qin, Zhang, Zhang, Sang, Wang, Li, Wang and Liu. This is an open-access article distributed under the terms of the Creative Commons Attribution License (CC BY). The use, distribution or reproduction in other forums is permitted, provided the original author(s) and the copyright owner(s) are credited and that the original publication in this journal is cited, in accordance with accepted academic practice. No use, distribution or reproduction is permitted which does not comply with these terms.
*Correspondence: Qinglin Wang, d2FuZ3FpbmdsaW5AbGN1LmVkdS5jbg==; Guozhao Zhang, WjIwMTJHWkAxNjMuY29t; Xiaoli Wang, eGx3YW5nQHl0dS5lZHUuY24=
Disclaimer: All claims expressed in this article are solely those of the authors and do not necessarily represent those of their affiliated organizations, or those of the publisher, the editors and the reviewers. Any product that may be evaluated in this article or claim that may be made by its manufacturer is not guaranteed or endorsed by the publisher.
Research integrity at Frontiers

Learn more about the work of our research integrity team to safeguard the quality of each article we publish.