- 1Department of Applied Mathematics and Theoretical Physics, Centre for Mathematical Sciences, University of Cambridge, Cambridge, United Kingdom
- 2School of Mathematics, Statistics and Physics, Newcastle University, Newcastle Upon Tyne, United Kingdom
The light environment controls the swimming of microalgae through a light-seeking and avoiding behaviour, which is known as phototaxis. In this work, we exploit phototaxis to control the migration and concentration of populations of the soil microalga Chlamydomonas reinhardtii. By imaging a suspension of these microalgae in a cuvette illuminated from above by blue light, we study how phototaxis changes the stability of the suspension and demonstrate how a thin, porous layer at the top of the cuvette prevents phototaxing microalgae from sinking, leading to the up-concentration of the microalgae in the region above the porous layer. We discuss the potential implications of our findings for microalgae in biotechnological applications and the natural environment.
1 Introduction
Environmental stimuli, such as chemical gradients, gravity, light and flow shear, bias the motion of swimming microorganisms [1–3]. At the level of a population, these biases cause the formation of spectacular, often macroscopic, patterns. Inasmuch as they cause cells to congregate and interact, these patterns can be considered a form of social behaviour. Paradigmatic examples of pattern formation in swimming microbes are the waves exhibited by bacteria [4, 5] and slime mold [6] sensing chemical gradients (chemotaxis), or the bioconvection patterns formed by ciliates and microalgae [7], responding to a combination of gravity and flow shear (gyrotaxis). More specifically, the latter is a bias resulting from the combination of a torque on a swimmer due to shear in the flow and one due to gravity, caused by asymmetry in body shape, mass distribution and/or between body and flagella [8].
Recent decades have seen a marked increase in the mechanistic understanding of how biases act at the individual swimmer level and how this affects macroscopic patterns. For example, mathematical models of flowing and dispersing gyrotactic suspensions of microalgae [9–12] have been compared with measurements of algae in an uniformly rotating flow [12], sheared bioconvection patterns [13], populations of microalgae dispersing in pipe flow [14], and laboratory versions of oceanic thin layers [15]. For comprehensive summaries of current work, we refer the reader to reviews covering recent progress in the physics of swimming microbes [16, 17] and bioconvection [7]. This area of research is also closely related to active matter [18] comprising biological swimmers, as we have just described, but also synthetic [19] and biohybrid ones [20–22].
In this study, we focus on how light can be used to control and concentrate a suspension of Chlamydomonas reinhardtii microalgae. The bias of swimming by light is known as phototaxis and is an adaptation that allows C. reinhardtii and other photosynthetic microorganisms to find optimal levels of light needed to grow [23, 24]. Recent studies have demonstrated how exposing a suspension of microalgae to light can dramatically alter the patterns they form, and even generate new ones [25]. In the absence of phototactic stimulation, bioconvection patterns form in shallow layer suspensions, e.g., a thin layer of fluid in a Petri dish, as a result of the tendency of microalgae to swim upwards (gravitaxis) and form a dense layer of cells (denser than the fluid they are suspended in) at the top of the suspension [7]. This is unstable and results in sinking “plumes,” which drive a bioconvective pattern, reinforced by the cells’ response to the flow (gyrotaxis), which enhances the instability by driving cells towards downwelling plumes. Bees and Williams investigated how white light from above and below a suspension of the microalga Chlamydomonas augustae in a Petri dish alters the stability of bioconvection patterns, quantified by measuring the dominant initial pattern wavelength [26]. As well as changes to existing bioconvection patterns, recent investigations have also explored how shining light into a suspension can stimulate patterns that would not otherwise be there. For example, bioconvection patterns for the microalga Euglena gracilis were induced by illuminating a Hele-Shaw cell from below [27]. In the absence of light, the patterns vanished. A study by Arrieta et al. also demonstrated how quickly bioconvective structures can be created, and even reconfigured by light, using it to generate “blinking plumes”; the study also provided a model of this (ignoring gyrotactic effects), and reported good agreement with the experimental observations [28].
Aside from some of the studies above, several investigations in the literature have provided theoretical analyses of bioconvection in the presence of phototaxis. These have recently been reviewed comprehensively [7, 25]. We will discuss briefly here only the model by Williams and Bees [26], which includes phototactic and gyrotactic effects, and encompasses several simpler models that have been recently proposed. The model equations, summarized in Supplementary Appendix SA, describe the coupled dynamics of fluid flow, described by a Navier-Stokes equation, and a population of swimmers, described by a continuity equation. The probability density function (PDF) for the swimmer orientation obeys a Fokker-Planck equation, with a deterministic bias due to the combined action of flow, gravity and light. Taking moments of this PDF provides the mean swimming velocity and diffusivity in the continuity equation. Williams and Bees considered three alternative models to describe the effect of phototaxis on the swimmers [26]. In model A, the speed of the cells is dependent on light intensity (photokinesis), while gravitaxis and gyrotaxis are not affected. In model B, light causes a change in the bottom-heaviness of the cells, inducing an effective gravi/gyrotactic torque. In model C, cells respond directly to an effective torque due to light, dependent either of the light direction or the gradient of its intensity (the latter was also used by [23, 28]). Williams and Bees used their model to predict the stability of bioconvection patterns for a suspension illuminated from above and below, in qualitative agreement with the experiments with C. augustae microalgae in a Petri dish mentioned above [29].
Our study combines a photogyrotactic suspension with porous media, materials with voids through which microbes can swim. In the environment, these can occur as the spaces between particles in soils [30]; in the laboratory they can be patterned using microfluidics, or assembled using gels or beads. There has been much recent interest in the behaviour of swimming microorganisms, such as bacteria, in porous media [31]. A few recent studies have also considered how the transport of microalgae is altered in porous chambers [32] and microfluidic arrays [33], including the deflection of negatively phototactic swimmers through obstacle arrays [34].
Thus, it is known how porous media change the transport of microswimmers and it is well established that light perturbs, and drives instabilities in, suspensions of phototactic microalgae, visibly causing the concentration of cells. However, the systematic concentration of microalgae at a given location exploiting photogyrotaxis, which was suggested by Kessler as early as 1982 [35], has hitherto not been demonstrated. In this study, we aim to show that a unique combination of phototaxis and porous media permits the concentration of microalgae at a given location in a container. We report the first “milliliter-scale” experiments demonstrating how photogyrotactic microalgae can be concentrated above a porous layer of beads overlaid onto a metal mesh. We also observe interesting photogyrotactic instabilities and accumulations in the suspension, which have not been previously reported. An “essential” model to qualitatively account for the temporal evolution of the average concentration of cells above the porous layer and for their initial spatial distribution is also developed, leaving a full theoretical analysis of the photogyrotactic dynamics leading to this concentration for future work. Finally, we discuss how, a scaled-up version of our set-up could provide the basis for a new and efficient method to harvest swimming microalgae industrially. This is desirable since harvesting microalgae industrially is expensive (up to 20–30% of the total production costs [36]), and represents a bottleneck in the production of bioproducts from microalgae.
2 Materials and Methods
2.1 Experimental Methods
We used the wild-type algal strain Chlamydomonas reinhardtii (CC125) for our studies. Single colonies of these algae were picked from slant cultures and inoculated into Tris-minimal growth media (Supplemental Material Section S1). These media are based on the standard TAP medium [37], but omit acetic acid and
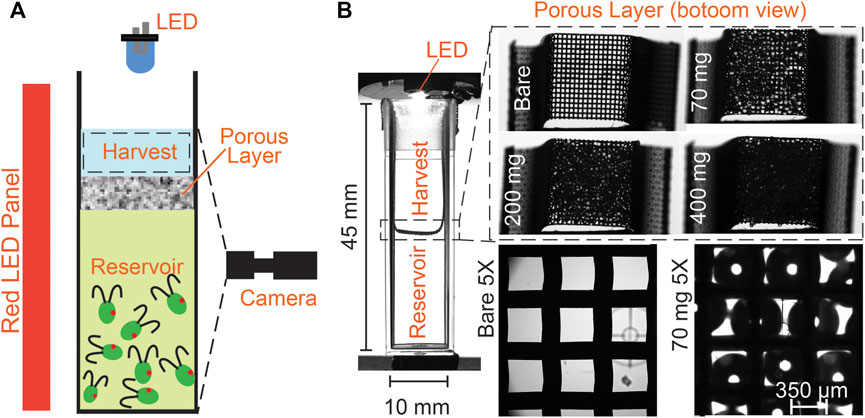
FIGURE 1. Schematic showing lower reservoir and upper harvest regions, separated by a wire mesh overlaid with beads: the porous layer. (A) A blue LED is mounted on the top of the cuvette to create a phototactic bias. For imaging the suspension and concentration calibration, a deep red LED illuminates the cuvette from the side (deep red light does not elicit phototaxis [3]). (B) Glass beads of diameter
For the phototaxis experiments, a blue LED (Thorlabs M470L2, nominal wavelength 470 nm) is mounted above the cuvette at a distance of
2.2 Essential Model of Concentration
We present here the details of a simplified model of the concentration of swimming microalgae into the upper “harvest” region by light. The model describes the case of a suspension of microalgae with a porous layer near the top (mesh + beads), as shown in Figure 1, and we shall also apply it below to consider the case of a bare mesh. For the mesh + beads case, the suspension of microalgae is divided into three regions, an upper harvest region (u), a porous layer region (p) and a lower “reservoir” region (l). Photogyrotactic migration delivers microalgae to the upper region from the lower region through the porous region. As evident from our results and discussion (see Section 3.4, 4 below), the dynamics underpinning the concentration are complex; the challenge of describing them with a full photogyrotactic model is beyond the scope of this paper. Instead, we seek here to formulate a model to capture the essential features of the concentration process into the upper harvest region. We make the reasonable simplifying assumption that: 1) the average concentrations in the upper, porous and lower regions evolve slowly compared to the observed photogyrotactic dynamics; we consider here spatial and temporal variations separately, and assume a steady state for the fast dynamics in the upper region. We further assume that 2) phototactic migration is the dominant process and brings cells to from the lower region to the porous region, with swimmers migrating straight upwards toward the light (there is no dependence on light gradients, only light direction) at the maximum phototactic speed, equal to the mean swimming speed of the population, Vs. In the lower region, we assume that 3) the mean concentration is representative of the concentration of cells swimming into the porous layer. In the porous layer region, we assume that: 4) the speed of the swimmers is slowed down by collisions with the porous medium, but the swimming direction continues on average to be upwardly directed by phototaxis. In the upper harvest region, as well as the average concentration dynamics, we also consider a 0th order spatial model of phototactic concentration. To set this up, as assumed above, we posit that there is a separation of timescales between the migration of cells from the lower region (slow) and the redistribution of cells in the upper region (fast). We further assume that: 5) the effect of flow is negligible prior to the formation of the plume from the upper surface (see Figure 4B); 6) upward phototactic swimming at the maximum speed Vs and diffusion dominate the fast suspension dynamics (gyrotactic effects are negligible); 7) diffusion is assumed approximately isotropic; 8) the meniscus at the top of the suspension is flat (any effects of curvature are neglected).
With the assumptions above, denoting by
Equation 1a describes the loss of cells from the lower region due to the phototactic flux of cells, of concentration
where
where we have defined the upswimming rate constants
where we have defined the long-time concentration in the upper region as
and where, recalling the definitions of the constants
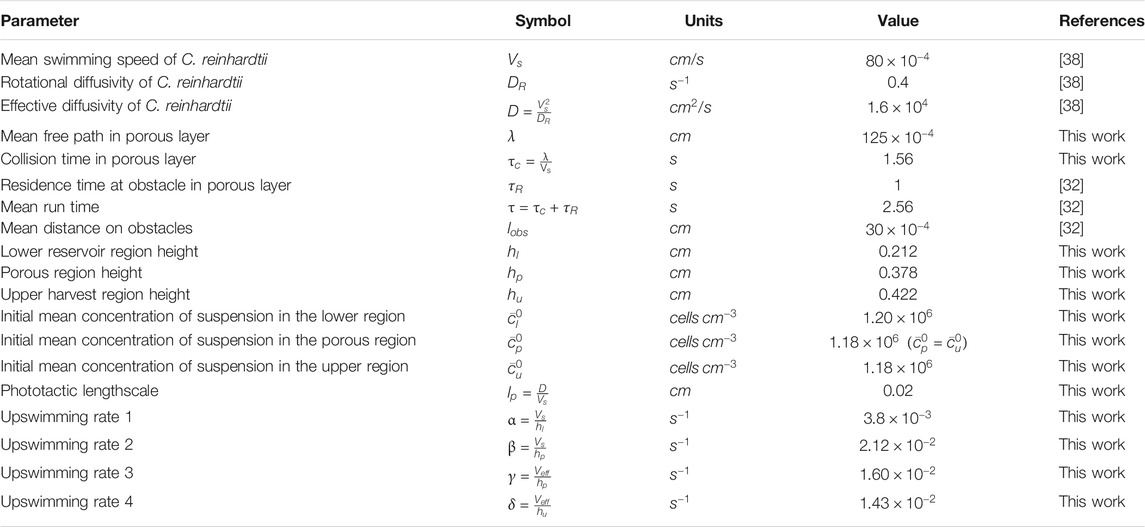
TABLE 1. Essential model parameters for the mesh + beads case. Values were obtained from direct measurements of our experimental system or literature values for the swimming parameter of C. reinhardtii grown under identical conditions.
We also consider the “mesh-only” case (without a porous layer of beads). The derivation, shown in Supplementary Appendix SB, is similar and provides the temporal evolution of the mean concentrations as
where the superscript ‘m’ denotes concentrations in the mesh-only case, and we have defined the rate constants
This corresponds to the concentration in the upper region occurring when all microalgae have swum into it from the lower region.
In the upper region we observe that cells accumulate strongly at the surface. To describe this, we can use a simplification of the Williams and Bees model [26]. By virtue of assumptions 5)–8) above, as shown in Supplementary Appendix SA, the full swimmer conservation equation in the Williams and Bees model simplifies to:
where
where
which integrates to
where we have defined a characteristic phototactic accumulation lengthscale
where that the mean concentration as a function of time,
3 Results
3.1 Initial Condition for the Lower Region
Prior to considering the effect of light on a suspension of C. reinhardtii placed in the cuvette, we will consider the initial condition of the suspension in the lower reservoir region, which will be the same starting point for all subsequent experiments. With the blue LED light off, microalgae were mixed into the cuvette and the suspension was allowed to stabilize in the presence of only red illumination from the side (see Figure 1A), which does not elicit a phototactic response (Supplementary Video S1) [3, 40]. The suspension images and profiles are shown as a time-series in Figure 2: over a few minutes, the suspension (initial concentration
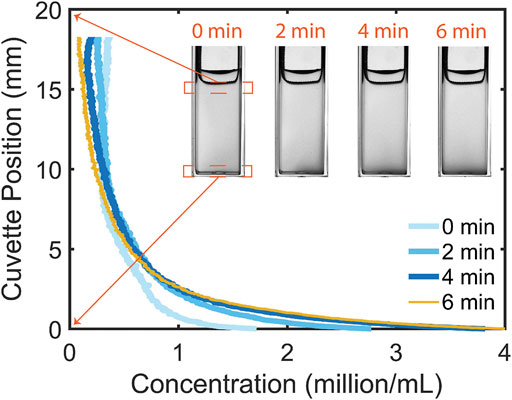
FIGURE 2. In the absence of phototactic illumination from above microalgae redistribute over the height of the cuvette. A steady distribution can be seen to arise after 4 min.
3.2 Free Surface: Bulk Photogyrotactic Instabilities
We consider here the effect of light on a suspension of microalgae in a cuvette when the surface of the suspension is free (the metal mesh applied in the next section has been raised above the surface). This experimental scenario can be seen in Supplementary Video S2, stills of which are shown as the sequence in Figure 3. Initially the blue LED illumination is switched off and the suspension is distributed with the majority of cells at the bottom, as described in the previous section. Then the LED is switched on, and the cells in suspension phototactically respond to the light, migrating upwards toward the surface (Figure 3,

FIGURE 3. Free surface: photogyrotactic dynamics of a suspension of C. reinhardtii microalgae in a cuvette illuminated from the top by a blue LED, and dynamics when the LED is switched off (last three stills).
3.3 Mesh: New Phototactic Structures
In this section we consider the case of a metal mesh immersed at the top of the microalgal suspension. As described in the methods, the pore size of the mesh is
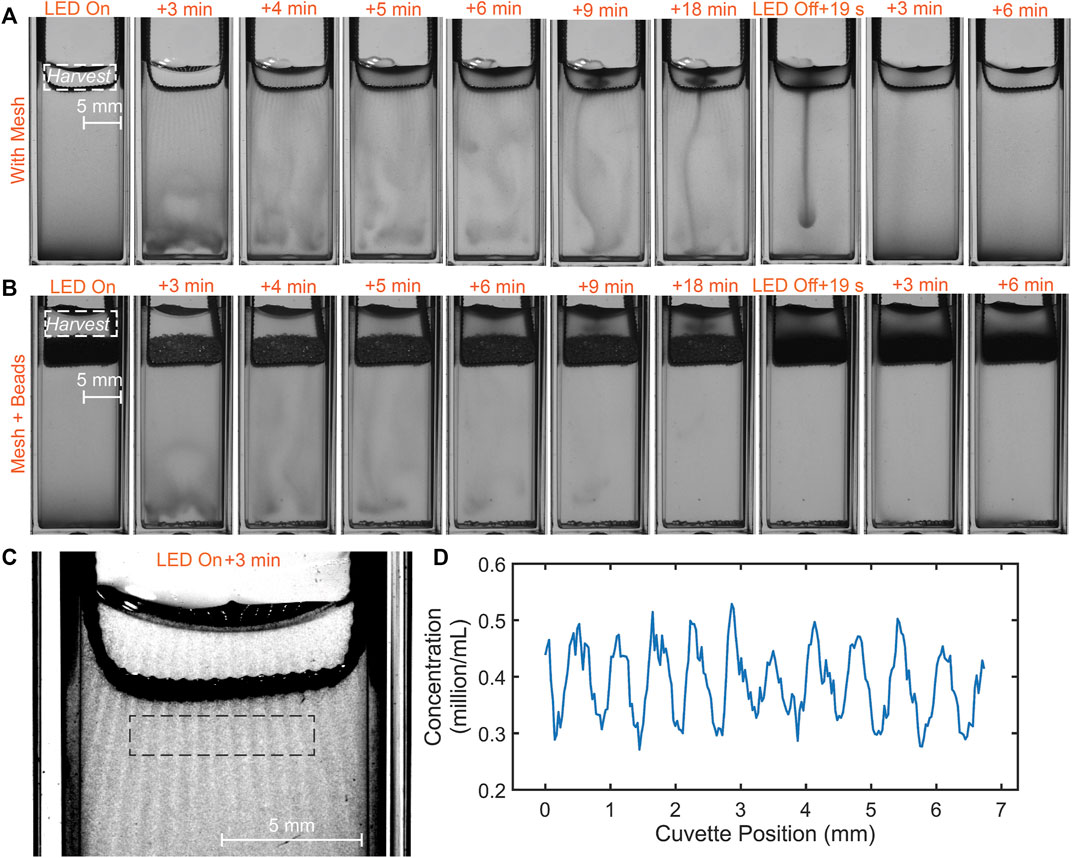
FIGURE 4. Microalgal suspension dynamics for the case of: (A) a mesh; (B) mesh + beads (400 mg) placed at the top of the suspension. The dynamics is similar, but there are important differences. Significantly a cloud-like plume is completely trapped between the porous layer and top surface, while in the case of the mesh, it can leak as a thin plume to the suspension below. (C) Phototactic “curtain” pattern formed by the accumulation of cells in response to the light and shadow pattern generated by illumination falling on the mesh. (D) Curve showing the concentration of algae across the phototactic curtains (mean feature
3.4 Porous Layers: Stabilization of Phototactic Structures and Concentration Gain
We next turn to the case where a porous layer is placed on top of the suspension. As described in the Methods, the porous layer consists of glass beads overlaid onto a metal mesh (the same as was used in the previous section). The beads are around
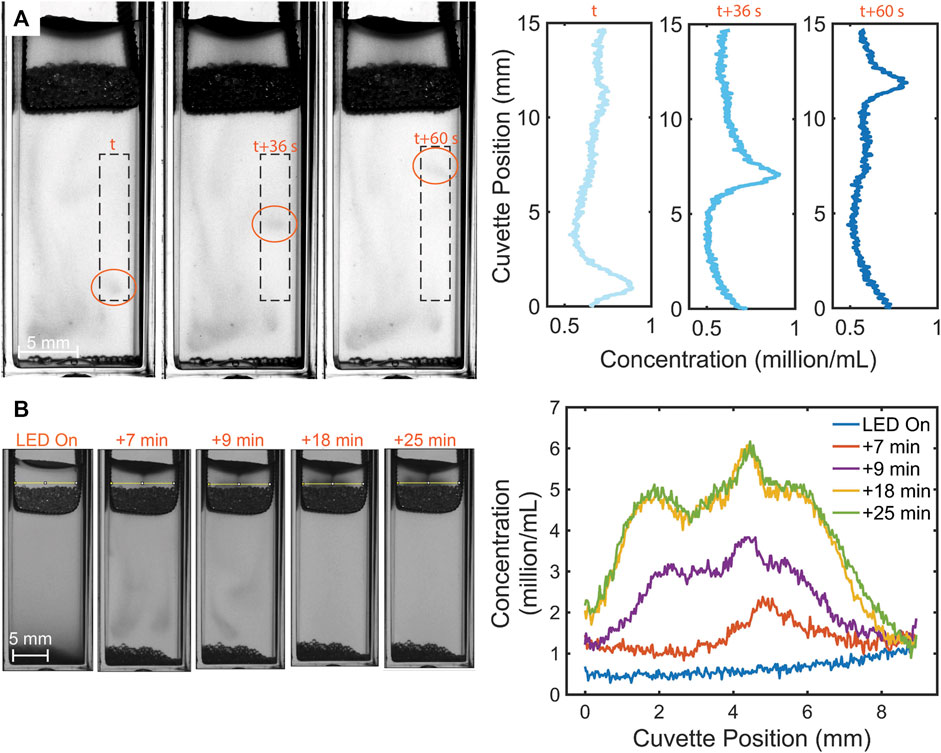
FIGURE 5. Photogyrotactic dynamics of swimming algae in the mesh + beads case. (A) Stills of the algal clusters in the lower region moving upwards as waves with speed
In view of quantifying microalgal concentration in the upper harvest region above the mesh or the mesh + beads porous layer, it is instructive to chart the evolution of the average concentration of the suspension in this region (Supplementary Figure S2). To identify a porous layer thickness that would not leak into the suspension below, we considered layers of several weights in trial experiments presented in Supplementary Figure S5. We found a general qualitative trend that was similar for all cases: the concentration grows as the light is switched on, and then saturates to a constant value. We focus here quantitatively on the mesh-only case and the “minimally-leaky” mesh + beads (
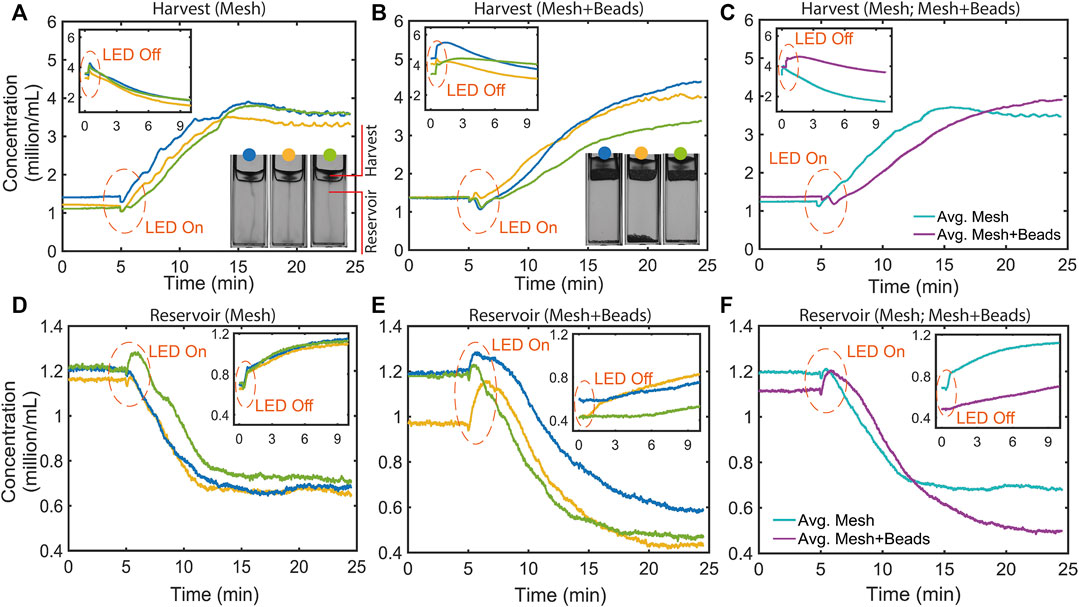
FIGURE 6. Temporal concentration profiles in the upper harvest region above a mesh or mesh + beads, after the LED is switched on and off (insets), as indicated. (A) Three repeats for microalgae phototactically concentrating above the bare mesh. Inset: concentration rise and decay after the LED is switched off. (B) As in (A), but for the mesh + beads (400 mg) case. (C) Time point average of the concentration profiles shown in (A, B). The concentration for the mesh-only case saturates ∼10 min after the LED is switched on, whereas it keeps on increasing towards a higher saturation concentration in the mesh + beads case. When the LED is switched off, the concentration initially increases and then decays, for the reasons discussed in the text. (D) Three repeats for profiles in the lower region for the mesh only case. Inset: concentration rise after the LED is switched off. (E) As in (D) but for the mesh + beads case. (F) Time point average of the concentration profiles shown in (D, E). For the mesh-only case the profile decays to a constant value sooner than mesh + beads. The inset shows how the concentrations for both cases rise in the lower region after the LED is switched off, with a greater rise for the more leaky mesh-only case.
Also shown in Figure 6 are profiles charting the temporal evolution of concentration in the lower reservoir region. As for the upper region, we have measured triplicate repeat profiles for the mesh (Figure 6D) and mesh + beads (Figure 6E), and also evaluated averaged profiles (Figure 6F). We see that, after the LED is switched on, the concentration for the mesh and mesh + beads falls, as phototactic swimming into the upper regions depletes the lower region of cells. However, the depletion appears to saturate, and to a higher concentration in the case of mesh-only, reflecting the greater leakiness of the mesh, as discussed below. Insets in Figures 6D–F display how, with the LED off, the concentration in the lower region rises due the influx of cells sinking from the upper regions.
3.5 Essential Model Predictions
We have developed a simple model to capture the essential features of the phototactic concentration dynamics, and evaluate it here using parameters for C. reinhartii concentrated using a mesh + beads setup, as shown in Table 1. In Figure 7A, the model prediction using Equation 4c for the average concentration of cells
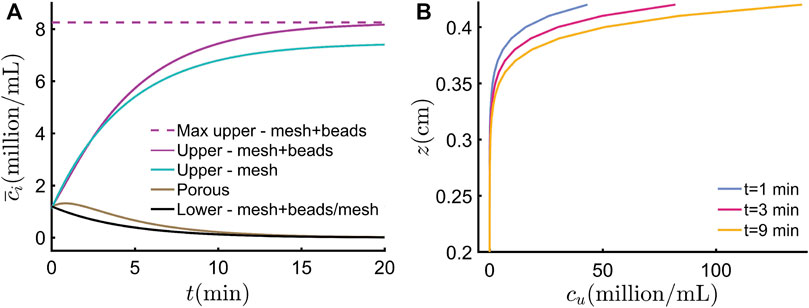
FIGURE 7. Predictions of the essential model. (A) Average concentrations as a function of time since ‘LED on’ at t = 0 in the upper, porous, and lower regions for the mesh + beads case, and upper and lower regions for the mesh-only case. For both cases, phototactic concentration causes the lower region to evacuate and the upper region to fill up with swimmers, up to a maximum limit, as discussed in the text. For clarity, this limit, shown as a dotted line for the mesh + beads case, is not shown for the mesh-only case. (B) Spatial swimmer concentration profiles in the upper region at different times, as shown. The suspension becomes increasingly top-heavy. The plot starts at z = 0.2 cm to make the profiles more evident (the concentration predicted below this level is 0 cells/ml).
Assuming phototaxis and diffusion processes are dominant in the upper region, and that these occur faster than the accumulation from the porous region, we can also use the spatial extension of the essential model to chart the distribution of swimming algae in the upper region, which is provided by Equation 12. We note that, since this model does not fully account for photogyrotaxis, the predictions are only strictly valid prior to the formation of the plume off the upper surface, which we know from experiment occurs
4 Discussion
We have shown how light from above can trigger instabilities and upwards migration in an initially quiescent suspension of C. reinhardtii microalgae within a rectangular cuvette. By imaging, we qualitatively and quantitatively studied for the first time this migration in the following cases: when a permeable metal mesh is placed at the top of the suspension; when porous layers of beads are overlaid onto the mesh; in the absence of any mesh or layer on the surface. In the latter case, light was seen to drive photogyroactic instabilities in the bulk of the suspension and upwards migration of the cells to the surface, from which, eventually, a plume structure was seen to arise. A similar phenomenology was observed when a mesh was present, except in this case the plume from the surface was partially trapped by the mesh, later giving rise to a secondary plume. By trapping the plume, the mesh allows the concentration of cells in the upper region of the cuvette (also termed “harvest region”), but this is a leaky process. However, when a porous layer of glass beads is overlaid onto the mesh, it is possible to stably concentrate the suspension in the upper harvest region while the light is switched on: the plume from the surface is trapped with minimal leakage. We have charted how the mean concentration in the harvest region varies with time for the case of a mesh with a layer of beads of different weights (thicknesses), showing that a
We can discuss our findings in terms of what is known about the phototactic and photogyrotactic behaviour of microalgal suspensions. When the LED is switched on, the suspension responds visibly in seconds, similarly to what has been measured for populations responding to light from an optical fibre [23], and corresponding to the time scale for C. reinhardtii to perceive light and turn to swim towards it by controlling their flagellar beat [24]. Subsequent to this initial response, the suspension displays instabilities in cell concentration and flow. Some groups of cells rise, moving as waves drifting at the swimming speed of the algae or above, probably advected by upwelling flow; others form stretching plumes; others still sink. This complex behaviour is the result of the interplay of the phototaxis and gyrotaxis of the population, coupled with the fluid dynamics of a negatively buoyant suspension. In the absence of a full photogyrotactic model, whose development is beyond the scope of this paper, it is not possible to account for these observed patterns quantitatively. A lower bound estimate of the timescale for accumulation to the surface leading to the formation of a plume there can, however, be obtained by considering the time for cells to swim straight up to the surface at the maximum phototactic speed. For the mesh + beads (400 mg) case, the mean swimming speed of the microalgae in the lower and upper regions, with heights
Our essential model provides a qualitative picture of how the average concentration changes in the upper, porous and lower regions, and gives concentration values which agree in order of magnitude with what we have measured. Comparison with experiment, however, reveals that the model fails to quantitatively describe the saturation of the upper and lower concentrations. This in part because our measurements in the upper region underestimate the concentration (missing cells accumulated at the surface). However, as evidenced by the failure of the model to predict saturation in the lower region (compare Figures 6D, 7A), it is likely that quantitative agreement is not possible because critical processes have not been modelled, such as diffusive exchanges between reservoirs and/or shading effects of the cell concentration in the upper region on the phototactic speed. For the upper region, the model was applied to predict a top-heavy distribution of cells, as is observed in our image sequences. The model, however, does not reproduce the concentration of cells visible in the bottom part of the upper region, probably due to a neglect of losses from the surface accumulation at the edge of the cuvette. The model is further limited to the description of the phototactic concentration prior to the formation of the plume-cloud, whose quantitative dynamics require a fully photogyrotactic description. Future studies should develop such a description using continuum models coupling the suspension cell and flow dynamics in response to gravity, flow and light, as has been done by Williams and Bees to describe bioconvection patterns [26]. This will present some challenges. For example, it is as yet unclear which model of the phototactic response of a population agrees quantitatively with experiment. Williams and Bees did not test their model C against experiment [29], and other studies using a similar description to model C did not include gyrotaxis [23, 28]. Alternatively, the adaptive, microscopic model of photoaxis presented in [24] could be used as the basis of an agent-based model (ABM) of the population response, and integrated with known gyrotactic responses implemented in ABMs [41], and coupled to the fluid dynamics (another challenge for ABMs). Numerical and analytical predictions from such models will predict the spatio-temporal patterns in the suspension, including the meandering photogyrotactic plumes, the formation of propagating waves of cells and their concentration in the phototactic curtain structures we have observed. To describe the latter, accounting for the observed width of the curtain pattern, it will be necessary to develop a model coupling the local light profile (optical shadows from the mesh) to the photogyrotactic dynamics. Photogyrotactic models should be developed for the lower, porous and upper regions combined, and should be able predict the characteristic timescales we have observed, such as the time required for plumes to form off the upper surface (Supplementary Figure S4). Such models will also describe how the plume-cloud in the harvest region grows with time, accounting for the curvature in the meniscus (neglected in our essential model) and how this affects the plume formation. Observation indicates that the plume forms in the lowest point of the meniscus, likely because cells accumulate there. Advanced modelling should also predict how long the mesh or porous layer is able to support the plume against sinking when the LED is on, and how long it takes to sink through the layer when the LED is switched off.
A full account of photogyrotactic dynamics will permit inclusion of processes (such as diffusion and light shading affecting phototactic speed) not included in our essential model. Predictions from these improved photogyrotactic models for the concentration in the upper, porous and lower regions, should provide better agreement with the results shown in Figure 6. In particular, it will be interesting to use these refined models to establish the parameters that determine optimal conditions for harvesting microalgae in the upper region. From a practical perspective it is desirable to obtain the largest possible volume of suspension with the highest concentration gain for a given initial mean concentration and critical parameters, such as the height of the lower, porous and upper harvest regions, and the total duration of the concentration process. In addition, it will be desirable to know how strong the light intensity should be for optimal phototactic concentration. This is a parameter which was held fixed in the present study.
Harvesting contributes a significant amount (about 20–30% [36]) of the cost for processing microalgae and bioproducts derived from them. New methods are required to reduces this cost and replace energy-intensive solutions such as centrifugation. In many applications, a concentration factor of 100 upon harvesting is desirable to remove water and allow further bioprocessing of microalgae [36]. Investigations following our study should determine if such a concentration gain, improving on the four-fold gain we have demonstrated, can be achieved using photogyrotaxis alone. Alternatively, photogyrotactic concentration could already be viable as a preliminary concentration step, as is currently done by membrane filtration [42], reducing the time spent on more costly concentration methods, such as centrifugation. Following a demonstration at the milliliter (‘cuvette’) scale, it is worth investigating if photogyrotactic concentration can be scaled up, and if it can be an energy-efficient (using inexpensive LED or natural light, and exploiting natural swimming energy for concentration), and convenient method of value in industrial microalgal bioprocessing and harvesting. Indeed, for industrially-valuable swimming microalgae, exploiting swimming in response to light, as we have here explored, has not been considered as the basis for an efficient new harvesting method. Dunaliella salina, a marine relative of C. reinhardtii, is cultured in ponds that are maximum 20 cm deep to allow light penetration for growth [43]. It is known that this microalga can be concentrated when a layer of freshwater is produced, artificially or by rain, at the surface of the pond [43]. The freshwater generates a gradient in the density of the suspension medium, which acts similarly to the porous layer in our study and causes the microalgae to become trapped in the freshwater layer at the surface [44]. The role of photogyrotaxis in this industrially well-known concentration process [43] has not yet been investigated. However, taking into consideration the concentration physics we have uncovered in this study, it could be optimized to produce better microalgal yields from culture ponds. Density gradients cannot be exploited for freshwater microalgae (an aqueous suspending medium less dense than water is not easily found), which require a porous layer to be concentrated by upswimming. In this case, the use of glass beads for the porous layer, as in this study, represents an improvement over Kessler’s original suggestion of a fibrous porous layer [35], which, from experience with gravitactic concentration using cotton wool [13, 14, 45], is known to be liable to irreversible cell loss to the fibers (biofouling).
Finally, it is worth remembering that C. reinhardtii is a soil-dwelling microalga. Little is known about its ecology within soils [46], but we can speculate that in saturated soils C. reinhardtii may migrate across porous layers in response to daylight. Thus, the phenomenology we have uncovered in this work and the methods we have developed can be adapted to better understand the behaviour of C. reinhardtii and similar species in their natural environments. It will be very interesting in future studies to investigate the phototactic movements of C. reinhardtii in laboratory soil-like porous media, and how this social behaviour affects its photosynthetic growth in topsoil, as well as more “traditional” social behaviours, such as sex [46] and interactions with other soil microbes [47, 48].
Data Availability Statement
The datasets presented in this study can be found in online repositories. The names of the repository/repositories and accession number(s) can be found below: https://doi.org/10.5281/zenodo.5113916.
Author Contributions
PP carried out the experiments. OC developed the modelling. PP and OC designed the experiments, analysed the data, and wrote the paper.
Conflict of Interest
The authors declare that the research was conducted in the absence of any commercial or financial relationships that could be construed as a potential conflict of interest.
Publisher’s Note
All claims expressed in this article are solely those of the authors and do not necessarily represent those of their affiliated organizations or those of the publisher, the editors, and the reviewers. Any product that may be evaluated in this article, or claim that may be made by its manufacturer, is not guaranteed or endorsed by the publisher.
Acknowledgments
We thank K. Leptos for providing the C. reinhardtii CC125, M. Bees for a critical reading of the manuscript, and H. Laeverenz Schlogelhofer for the laboratory training provided to PP. OC acknowledges financial support from the Winton Programme for the Physics of Sustainability. PP and OC acknowledge financial support from the British Council through the Newton Bhabha Fellowship Scheme.
Supplementary Material
The Supplementary Material for this article can be found online at: https://www.frontiersin.org/articles/10.3389/fphy.2021.744428/full#supplementary-material
References
1. Wadhams GH, Armitage JP. Making Sense of it All: Bacterial Chemotaxis. Nat Rev Mol Cel Biol (2004) 5:1024–37. doi:10.1038/nrm1524
2. Pedley TJ, Kessler JO. Hydrodynamic Phenomena in Suspensions of Swimming Microorganisms. Annu Rev Fluid Mech (1992) 24:313–58. doi:10.1146/annurev.fl.24.010192.001525
3. Foster KW, Smyth RD. Light Antennas in Phototactic Algae. Microbiol Rev (1980) 44:572–630. doi:10.1128/mr.44.4.572-630.1980
5. Bhattacharjee T, Amchin DB, Alert R, Ott JA, Datta SS. Chemotactic Smoothing of Collective Migration. arXiv (2021). Available from: http://arxiv.org/abs/2101.04576 (Accessed April 26, 2021).
6. Bretschneider T, Othmer HG, Weijer CJ. Progress and Perspectives in Signal Transduction, Actin Dynamics, and Movement at the Cell and Tissue Level: Lessons from Dictyostelium. Interf Focus. (2016) 6:20160047. doi:10.1098/rsfs.2016.0047
7. Bees MA. Advances in Bioconvection. Annu Rev Fluid Mech (2020) 52:449–76. doi:10.1146/annurev-fluid-010518-040558
8. O’Malley S, Bees MA. The Orientation of Swimming Biflagellates in Shear Flows. Bull Math Biol (2012) 74:232–55. doi:10.1007/s11538-011-9673-1
9. Bees MA, Croze OA. Dispersion of Biased Swimming Micro-organisms in a Fluid Flowing through a Tube. Proc R Soc A (2010) 466:2057–77. doi:10.1098/rspa.2009.0606
10. Bearon RN, Bees MA, Croze OA. Biased Swimming Cells Do Not Disperse in Pipes as Tracers: A Population Model Based on Microscale Behaviour. Phys Fluids (2012) 24:121902. doi:10.1063/1.4772189
11. Hwang Y, Pedley TJ. Bioconvection under Uniform Shear: Linear Stability Analysis. J Fluid Mech (2014) 738:522–62. doi:10.1017/jfm.2013.604
12. Cencini M, Franchino M, Santamaria F, Boffetta G. Centripetal Focusing of Gyrotactic Phytoplankton. J Theor Biol (2016) 399:62–70. doi:10.1016/j.jtbi.2016.03.037
13. Croze OA, Ashraf EE, Bees MA. Sheared Bioconvection in a Horizontal Tube. Phys Biol (2010) 7:046001. doi:10.1088/1478-3975/7/4/046001
14. Croze OA, Bearon RN, Bees MA. Gyrotactic Swimmer Dispersion in Pipe Flow: Testing the Theory. J Fluid Mech (2017) 816:481–506. doi:10.1017/jfm.2017.90
15. Durham WM, Kessler JO, Stocker R. Disruption of Vertical Motility by Shear Triggers Formation of Thin Phytoplankton Layers. Science (2009) 80323:1067–70. doi:10.1126/science.1167334
16. Elgeti J, Winkler RG, Gompper G. Physics of Microswimmers-Single Particle Motion and Collective Behavior: a Review. Rep Prog Phys (2015) 78:056601. doi:10.1088/0034-4885/78/5/056601
17. Rusconi R, Stocker R. Microbes in Flow. Curr Opin Microbiol (2015) 25:1–8. doi:10.1016/j.mib.2015.03.003
18. Marchetti MC, Joanny JF, Ramaswamy S, Liverpool TB, Prost J, Rao M, et al. Hydrodynamics of Soft Active Matter. Rev Mod Phys (2013) 85:1143–89. doi:10.1103/RevModPhys.85.1143
19. Elgeti J, Winkler RG, Gompper G. Physics of Microswimmers-Ssingle Particle Motion and Collective Behavior: a Review. Rep Prog Phys (2015) 78:056601. doi:10.1088/0034-4885/78/5/056601
20. Bastos-Arrieta J, Revilla-Guarinos A, Uspal WE, Simmchen J. Bacterial Biohybrid Microswimmers. Front Robot AI (2018) 5:97. doi:10.3389/frobt.2018.00097
21. Prakash P, Abdulla AZ, Singh V, Varma M. Tuning the Torque-Speed Characteristics of the Bacterial Flagellar Motor to Enhance Swimming Speed. Phys Rev E (2019) 100:062609. doi:10.1103/PhysRevE.100.062609
22. Prakash P, Abdulla AZ, Singh V, Varma M. Swimming Statistics of Cargo-Loaded Single Bacteria. Soft Matter (2020) 16:9499–505. doi:10.1039/d0sm01066a
23. Arrieta J, Barreira A, Chioccioli M, Polin M, Tuval I. Phototaxis beyond Turning: Persistent Accumulation and Response Acclimation of the Microalga Chlamydomonas Reinhardtii. Sci Rep (2017) 7:1–7. doi:10.1038/s41598-017-03618-8
24. Leptos KC, Chioccioli M, Furlan S, Pesci AI, Goldstein RE. An Adaptive Flagellar Photoresponse Determines the Dynamics of Accurate Phototactic Steering in Chlamydomonas bioRxiv (2018). p. 254714. doi:10.1101/254714
25. Javadi A, Arrieta J, Tuval I, Polin M. Photo-bioconvection: towards Light Control of Flows in Active Suspensions. Phil Trans R Soc A (2020) 378:20190523. doi:10.1098/rsta.2019.0523
26. Williams CR, Bees MA. Photo-gyrotactic Bioconvection. J Fluid Mech (2011) 678:41–86. doi:10.1017/jfm.2011.100
27. Ogawa T, Shoji E, Suematsu NJ, Nishimori H, Izumi S, Awazu A, et al. The Flux of Euglena Gracilis Cells Depends on the Gradient of Light Intensity. PLoS One (2016) 11:e0168114. doi:10.1371/journal.pone.0168114
28. Arrieta J, Polin M, Saleta-Piersanti R, Tuval I. Light Control of Localized Photobioconvection. Phys Rev Lett (2019) 123:158101. doi:10.1103/PhysRevLett.123.158101
29. Williams CR, Bees MA. A Tale of Three Taxes: Photo-Gyro-Gravitactic Bioconvection. J Exp Biol (2011) 214:2398–408. doi:10.1242/jeb.051094
30. Marshall TJ, Holmes JW, Rose CW. Soil Physics. Cambridge University Press (1996). doi:10.1017/CBO9781139170673
31. Martínez-Calvo A, Trenado-Yuste C, Datta SS. Active Transport in Complex Environments. arXiv (2021). Available from: https://arxiv.org/abs/2108.07011 (Accessed September 16, 2021).
32. Théry A, Wang Y, Dvoriashyna M, Eloy C, Elias F, Lauga E. Rebound and Scattering of Motile Chlamydomonas Algae in Confined chambers. Soft Matter (2021) 17:4857–73. doi:10.1039/D0SM02207A
33. Brun-Cosme-Bruny M, Bertin E, Coasne B, Peyla P, Rafaï S. Effective Diffusivity of Microswimmers in a Crowded Environment. J Chem Phys (2019) 150:104901. doi:10.1063/1.5081507
34. Brun-Cosme-Bruny M, Förtsch A, Zimmermann W, Bertin E, Peyla P, Rafaï S. Deflection of Phototactic Microswimmers through Obstacle Arrays. Phys Rev Fluids (2020) 5:093302. doi:10.1103/PhysRevFluids.5.093302
35.Kessler JO Algal Cell Harvesting US4324067A. Available at: https://patents.google.com/patent/US4324067A/en?oq=U.S.+Patent+No.+4324.067 (Accessed April 26, 2021)
36. Fasaei F, Bitter JH, Slegers PM, van Boxtel AJB. Techno-economic Evaluation of Microalgae Harvesting and Dewatering Systems. Algal Res (2018) 31:347–62. doi:10.1016/j.algal.2017.11.038
37. Gorman DS, Levine RP. Cytochrome F and Plastocyanin: Their Sequence in the Photosynthetic Electron Transport Chain of Chlamydomonas Reinhardi. Proc Natl Acad Sci (1965) 54:1665–9. doi:10.1073/pnas.54.6.1665
38. Jin D, Kotar J, Silvester E, Leptos KC, Croze OA. Diurnal Variations in the Motility of Populations of Biflagellate Microalgae. Biophysical J (2020) 119:2055–62. doi:10.1016/j.bpj.2020.10.006
39. Jakuszeit T, Croze OA, Bell S. Diffusion of Active Particles in a Complex Environment: Role of Surface Scattering. Phys Rev E (2019) 99:012610. doi:10.1103/PhysRevE.99.012610
40. Goldstein RE, Polin M, Tuval I. Emergence of Synchronized Beating during the Regrowth of Eukaryotic Flagella. Phys Rev Lett (2011) 107:148103. doi:10.1103/PhysRevLett.107.148103
41. Croze OA, Sardina G, Ahmed M, Bees MA, Brandt L. Dispersion of Swimming Algae in Laminar and Turbulent Channel Flows: Consequences for Photobioreactors. J R Soc Interf (2013) 10:20121041. doi:10.1098/RSIF.2012.1041
42. Monte J, Sá M, Galinha CF, Costa L, Hoekstra H, Brazinha C, et al. Harvesting of Dunaliella salina by Membrane Filtration at Pilot Scale. Sep Purif Techn (2018) 190:252–60. doi:10.1016/J.SEPPUR.2017.08.019
43. Borowitzka LJ, Borowitzka MA. Commercial Production of β-carotene by Dunaliella salina in Open Ponds. Bull Mar Sci (1990) 47:244–52.
44. Bearon RN, Grünbaum D. Bioconvection in a Stratified Environment: Experiments and Theory. Phys Fluids (2006) 18:127102. doi:10.1063/1.2402490
45. Kessler JO. The External Dynamics of Swimming Micro-organisms. Prog Phycological Res (1986) 4:257–307.
46. Sasso S, Stibor H, Mittag M, Grossman AR. From Molecular Manipulation of Domesticated Chlamydomonas Reinhardtii to Survival in Nature. Elife (2018) 7:e39233. doi:10.7554/eLife.39233
47. Teplitski M, Rajamani S. Signal and Nutrient Exchange in the Interactions between Soil Algae and Bacteria, 23. Springer Berlin Heidelberg (2010). p. 413–26. doi:10.1007/978-3-642-14512-4_16
Keywords: microswimmers, microalgae, phototaxis, light environment, porous media, biotechnology
Citation: Prakash P and Croze OA (2021) Photogyrotactic Concentration of a Population of Swimming Microalgae Across a Porous Layer. Front. Phys. 9:744428. doi: 10.3389/fphy.2021.744428
Received: 20 July 2021; Accepted: 11 October 2021;
Published: 06 December 2021.
Edited by:
Natasha Mhatre, Western University, CanadaReviewed by:
Yongyun Hwang, Imperial College London, United KingdomAzusa Kage, Gakushuin University, Japan
Copyright © 2021 Prakash and Croze. This is an open-access article distributed under the terms of the Creative Commons Attribution License (CC BY). The use, distribution or reproduction in other forums is permitted, provided the original author(s) and the copyright owner(s) are credited and that the original publication in this journal is cited, in accordance with accepted academic practice. No use, distribution or reproduction is permitted which does not comply with these terms.
*Correspondence: Ottavio A. Croze, b3R0aS5jcm96ZUBuZXdjYXN0bGUuYWMudWs=
 Praneet Prakash
 Ottavio A. Croze