 Wei Wang1,2
 Qingxin Wang1,2,3Mengyu Jia3Zhongqiu Wang1Chengwen Yang1,2Daguang Zhang1,2Shujing Wen2Delong Hou2Ningbo Liu1,2Ping Wang1,2*Jun Wang1,2*
- 1Department of Radiation Oncology, Tianjin Medical University Cancer Institute and Hospital, National Clinical Research Center for Cancer, Key Laboratory of Cancer Prevention and Therapy, Tianjin's Clinical Research Center for Cancer, Tianjin, China
- 2Department of Radiation Oncology, Tianjin Cancer Hospital Airport Hospital, Tianjin, China
- 3School of Precision Instruments and Optoelectronics Engineering, Tianjin University, Tianjin, China
Purpose: A novel deep learning model, Siamese Ensemble Boundary Network (SEB-Net) was developed to improve the accuracy of automatic organs-at-risk (OARs) segmentation in CT images for head and neck (HaN) as well as small organs, which was verified for use in radiation oncology practice and is therefore proposed.
Methods: SEB-Net was designed to transfer CT slices into probability maps for the HaN OARs segmentation purpose. Dual key contributions were made to the network design to improve the accuracy and reliability of automatic segmentation toward the specific organs (e.g., relatively tiny or irregularly shaped) without sacrificing the field of view. The first implements an ensemble of learning strategies with shared weights that aggregates the pixel-probability transfer at three orthogonal CT planes to ameliorate 3D information integrity; the second exploits the boundary loss that takes the form of a distance metric on the space of contours to mitigate the challenges of conventional region-based regularization, when applied to highly unbalanced segmentation scenarios. By combining the two techniques, enhanced segmentation could be expected by comprehensively maximizing inter- and intra-CT slice information. In total, 188 patients with HaN cancer were included in the study, of which 133 patients were randomly selected for training and 55 for validation. An additional 50 untreated cases were used for clinical evaluation.
Results: With the proposed method, the average volumetric Dice similarity coefficient (DSC) of HaN OARs (and small organs) was 0.871 (0.900), which was significantly higher than the results from Ua-Net, Anatomy-Net, and SRM by 4.94% (26.05%), 7.80% (24.65%), and 12.97% (40.19%), respectively. By contrast, the average 95% Hausdorff distance (95% HD) of HaN OARs (and small organs) was 2.87 mm (0.81 mm), which improves the other three methods by 50.94% (75.45%), 88.41% (79.07%), and 5.59% (67.98%), respectively. After delineation by SEB-Net, 81.92% of all organs in 50 HaN cancer untreated cases did not require modification for clinical evaluation.
Conclusions: In comparison to several cutting-edge methods, including Ua-Net, Anatomy-Net, and SRM, the proposed method is capable of substantially improving segmentation accuracy for HaN and small organs from CT imaging in terms of efficiency, feasibility, and applicability.
1 Introduction
Radiation therapy (RT) is a critical solution for head and neck (HaN) cancer treatment [1]. Owing to the complex anatomical structures and dense distribution of vital organs in the HaN region, irradiation may cause damage to normal organs, which are referred to as organs at risk (OARs). Modern radiotherapy techniques, such as intensity-modulated radiation therapy (IMRT), volumetric modulated arc therapy (VMAT), and tomotherapy, are capable of delivering highly conformal dose distribution to the tumor target area, which reduces radiation-induced toxicity by sparing the OARs [2–5]. Consequently, the accurate delineation of OARs is clinically imperative and crucial to guarantee a safe and effective treatment, particularly for the HaN region. The delineation of critical organ tasks are usually performed manually by radiation oncologists on computed tomography (CT) scans. In addition to the potential inconsistency and uncertainties, the extensive number of OARs involved, for example, more than 20 OARs in typical nasopharyngeal cancer, demand substantial time, and labor to process. Moreover, for small organs (e.g., lens) and elongated organs (e.g., optic nerve), accurate segmentation remains challenging, due to their limited fraction on the entire image, in-homogeneity, and variation in size, shape, and appearance among different subjects.
With the advancement of deep learning techniques [6–12], learning-based segmentation, which relies on either 2D or 3D models, has achieved state-of-the-art performance in HaN OAR contouring based on various benchmark public datasets [13–17]. Typical deep neural networks with a U-Net backbone import a medical image and export a set of probabilities for the entire image [18]. The input image is processed sequentially by the network blocks, with each block comprised of a convolutional layer coupled with a max-pooling layer to increase the field of view, while decreasing the resolution. Zhu et al. [19] proposed a 3D U-Net based approach, Anatomy-Net, to automate brain organ segmentation. Due to the graphic processing unit (GPU) memory constraints, Anatomy-Net was designed with only one down-sampling layer to account for the trade-off between GPU memory usage and network learning capacity. Tang et al. [20] proposed a two-stage network that first identifies the region of each OAR, and then performs the segmentation of that region.
Challenges to these tasks can be found in the dual aspects described below: 1) limited inter-slice representation. In deep-learning–augmented medical image analysis, there was a trade-off between the information integrity in 3D space and the field of view based on the computation resource, for example, the memory of GPU [13]; 2) limited intra-slice representation. In the scenario of highly unbalanced segmentation, for example, the size of the target foreground region is of several orders of magnitude less than the background size, and the standard regional losses that contain foreground and background data with values that differ considerably may result in inferior contouring as well as degraded final performance and training stability [21, 22].
To circumvent the challenges above and further improve the accuracy of automatic OARs segmentation on CT images for HaN, a robust and clinically reliable segmentation strategy that relies on a novel deep learning framework, Siamese Ensemble Boundary Net (SEB-Net) was proposed. The SEB-Net integrates an ensemble learning strategy with shared network weights and a boundary loss to enhance the extraction of inter- and intra-slice information, respectively. Concretely, the former technique involves a set of learners that implement pixel-probability transfers from three orthogonal views to maintain 3D information integrity without sacrificing the field of view, and the latter uses integrals over the boundary or interface among tissues to mitigate the challenges related to regional loss in highly unbalanced segmentation problems. In total, 188 cases with 24 HaN OARs were included in the collection of the training data, which were carefully annotated by a senior radiation oncologist. An additional 50 undelineated CT images were collected to validate the clinical feasibility and effectiveness of SEB-Net for delineating HaN OARs in radiation oncology practice.
2 Materials and Methods
2.1 Siamese Ensemble Boundary Network
Figure 1 provides an overview of the architecture of the proposed SEB-Net for automatic segmentation of OARs in HaN CT images. As its name suggests, the SEB-Net leverages dual techniques, i.e., the model ensemble strategy with shared network weights and the boundary loss, improve the consistency of inter-slice segmentation and the representation accuracy of the OAR boundaries, respectively.
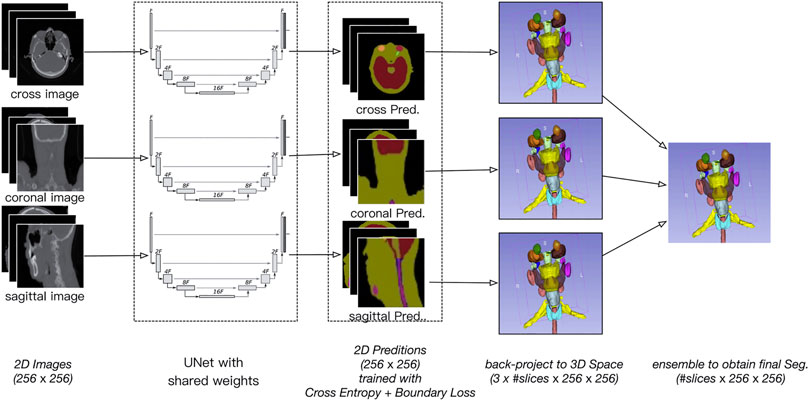
FIGURE 1. Overview of the proposed SEB-Net, which inputs the three plane 2D images (i.e., coronal, sagittal, and transverse) and outputs the corresponding 2D probability maps of OARs. The 2D probability maps are backprojected to the 3D space and then aggregated to exploit the three plane representations. A novel feature of the boundary loss is proposed to train the network so that the organ boundaries are well-predicted.
2.1.1 Model Ensemble Strategy With Shared Network Weights
A 3D CT volume generally yields smaller pixel spacing in the anterior–posterior (AP) and left-right (LR) directions than the superior–inferior (SI) direction, which may lead to a limited representation of the small HaN organs (e.g., lens) at the cross plane. Moreover, elongated OARs (e.g., optic nerve) are naturally more readable and interpretable when viewed from the sagittal and transverse planes. We proposed an ensemble of model strategy utilizing shared network weights that exploits three-plane information to improve contouring accuracy and inter-slice consistency. In essence, this strategy follows a similar approach that is used by a physician in radiology practice.
The specific process of the model ensemble is shown in Figure 2. First, we cut out the 3D volume data (slice × 512 × 512) within the skin, and then, we projected the 3D volume data onto three 2D plane images (coronal, sagittal, and cross-sectional plane) which were 256 × 256. The coordinate position of each 2D plane in the 3D volume data during projection was recorded, to enable the later recovery of 3D volume data from the 2D plane. Then, the existing deep convolutional neural network (U-Net) was used to predict a 2D auto-delineation of the three views in 256 × 256. According to the coordinate position recorded in advance, the 2D predictions were backprojected in 3D. For each view, similar operations were performed, and three 3D predictions corresponding to the three views were obtained. As a result, for each OAR voxel, three predicted values were available. The predicted value was between [0,1], thus denoting the probability of a voxel belonging to an OAR. Finally, we averaged these three values to obtain the integrated probability. If the average probability was greater than 0.5, the voxel was considered to correspond to a certain organ, so this voxel was attributed to this organ.
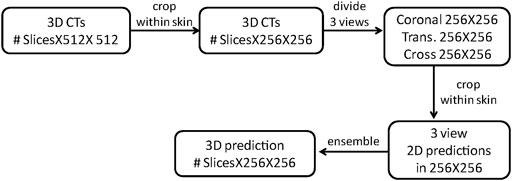
FIGURE 2. Illustration of model ensemble strategy with shared network weights.
We used shared weights for the U-Net. The resulting network was similar to the Siamese network which is different from the network studied in other works [23]. Typically, an ensemble model with different weights is better than one with same weights. However, it is well known that a high-capacity network such as U-Net requires a large dataset to avoid overfitting. The Siamese strategy allows us to train a single U-Net with triple data.
2.1.2 Boundary Loss
The convolutional neural network (CNN)-based segmentation methods could outperform traditional methods in terms of adaptability, robustness, and computational efficiency, which, however, generally suffer from limited high-texture representations in highly unbalanced segmentations. As such, we proposed a boundary loss that takes the form of a distance metric on the space of contours rather than regions. Thus, the imbalance may be resolved by using an integral over the interface instead of the region. In reality, the enhanced representation in boundary or interface regions may complement the regional data [24].
The main idea is to increase the penalty for the erroneously predicted boundary points. To this end, a boundary penalty term
where
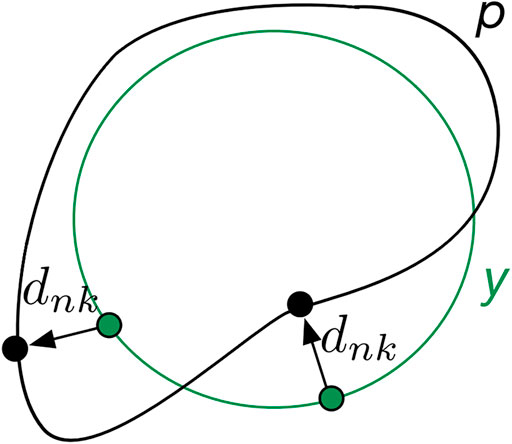
FIGURE 3. Mechanisms of boundary loss. The boundary prediction (p) is supervised via its distance (
2.1.3 Ablation Studies
In addition, we designed various ablation experiments to investigate the effectiveness of the proposed components of our SEB-Net by removing its two components: shared U-Net weights and boundary loss. We also compared the proposed boundary loss against the other work using the boundary-distance-based loss function [25].
2.2 Implementation Details
This SEB-Net relies on a conventional U-net backbone. U-Net is considered to be one of the standard CNN architectures for image segmentation. U-Net was used for model training. The network architecture is illustrated in Figure 4. It consists of a contracting path (left side) and an expansive path (right side). The contracting path follows the typical architecture of a convolutional network. It consists of the repeated application of two 3 × 3 convolutions (unpadded convolutions), each followed by a rectified linear unit (ReLU) and a 2 × 2 max pooling operation with stride 2 for downsampling. At each downsampling step, the feature channels double. Every step in the expansive path consists of an upsampling of the feature map followed by a 2 × 2 convolution (up-convolution) that halves the number of feature channels, a concatenation with the corresponding feature map cropped from the contracting path, and two 3 × 3 convolutions, each followed by a ReLU. Cropping is necessary because of the loss of border pixels with every convolution. We rescaled the CT values to the range of [0, 1] before feeding into the network. The whole framework was built on PyTorch with one NVIDIA TITAN XP GPU [26].
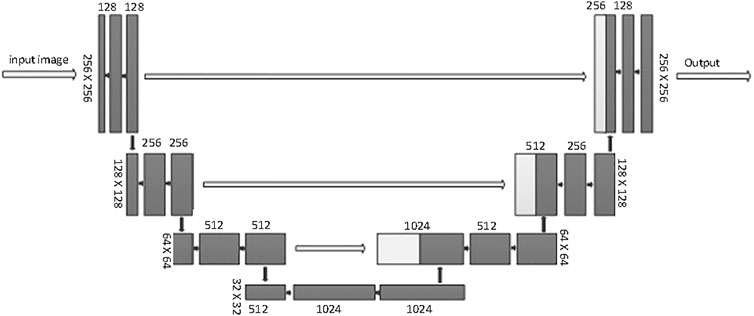
FIGURE 4. Illustration of the U-Net architectures used.
2.3 Dataset and Experimental Setting
We collected CT images (including OARs involved in radiotherapy) from 188 patients with HaN cancer for model training and testing in this study. They received radiotherapy from June 6, 2016 to January 31, 2020, at Tianjin Medical University Cancer Hospital. All structures of the dataset were modified and verified by a senior radiation oncologist, following the guidelines of Ref. [27].
An additional 50 HaN cases were collected for clinical evaluation. They were admitted to Tianjin Medical University Cancer Hospital from April 4, 2020 to June 30, 2020. These datasets included CT images that were not delineated by oncologists and were used to assess the extent to which SEB-Net can assist oncologists with clinical contouring.
Table 1 provides statistics on the number, categories, and mean organ volumes of the OARs in the dataset. The 24 HaN OARs included the brain, brain stem, spinal cord, spinal cord cavity, eyes (left and right), lens (left and right), optical nerves (left and right), optic chiasma, pituitary, parotid glands, oral cavity, mandible, temporomandibular joint left (TMJ L), temporomandibular joint right (TMJ R), temporal lobes (left and right), larynx, pharynx, trachea, and thyroid.
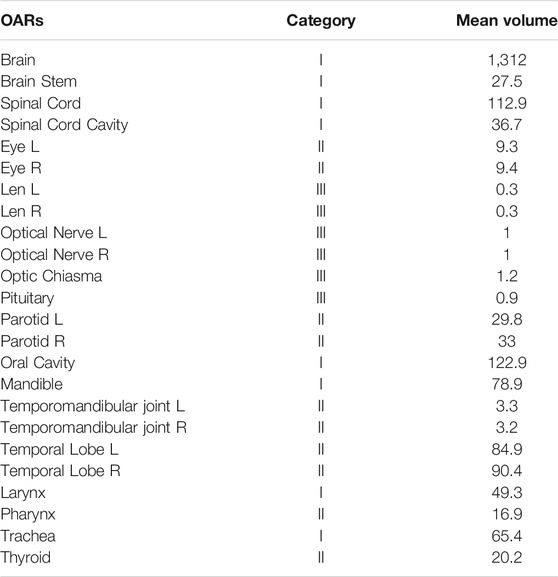
TABLE 1. Statistical table of organs at risk (volume unit: cm3).
The organs were divided into three categories according to their volume and complexity:
1) volume >30 cc and little difference between each slice of CT delineation, automatic contouring can reduce the repetitive work of manual delineation by oncologists;
2) 3 cc ≤ volume ≤30 cc, or significant difference between each layer of CT delineation;
3) volume < 3 cc, for small organs, there are only a few layers of CT images.
It is worth noting that although the temporal lobe has a volume of 80 cc, there is a significant variation between each layer of CT images. The coronal images were classified as Class II due to their importance in accurate delineation by the oncologist.
From the 188 groups of patient CT images, we randomly selected 133 groups to test adjustments to the parameters of the deep learning network, and the remaining 55 groups were selected to evaluate the performance of the proposed network. We used the NVIDIA TITAN XP GPU and the PyTorch deep learning framework. The parameters of the deep learning neural networks were adjusted using the random gradient descent method, and the initial learning rate was set to 0.0001, with a total of 50,000 adjustments, and the learning rate is reduced to 1/10 of the original value after 10,000 iterations.
2.4 Evaluation Metrics
The volumetric Dice similarity coefficient (DSC) and the 95% Hausdorff distance (HD) [28] were used to quantitatively evaluate the accuracy of delineation coverage and the delineated edge, respectively. The time spent on contouring and added path length (APL) [11, 29] were used to evaluate the clinical application of the proposed method. DSC and HD can be formulated as
and
Here, A represents the ground truth, B denotes the auto-segmented structure, and A∩B is the intersection of A and B.
3 Results
3.1 Qualitative Evaluations
Figure 5 shows a vivid 3D representation of 24 OARs in HaN region based on SEB-NET predictions. Figure 6 displays a visual comparison of the segmentation of HaN OARs on three CT plane images (coronal, sagittal, and cross-sectional planes) using our method with contouring by the senior radiation oncologist. As shown in the cross-section result, except for a slight difference in the posterior horn of the right parotid gland, there were few differences among the other organs (oral cavity, mandible, pharynx, spinal cord, spinal cord cavity, and left parotid gland). In the coronal plane, with the exception of the right parotid gland and the TMJ R, there is little difference in other organs (the brain, temporal lobe, TMJ L, left parotid gland, pharynx, trachea, and thyroid). In the sagittal plane, there was a slight difference at the optic chiasma and oral start slices, and little difference in the other OARs. Figure 7 details the differences between the two methods regarding the small organs (lens, optic chiasma, optic nerve, and pituitary). As shown in Figure 6, the difference between the two methods was minimal.
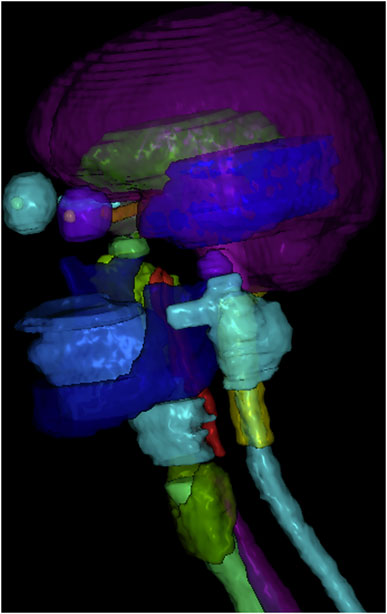
FIGURE 5. 3-D display of SEB-Net-based auto-contouring for HaN OARs.
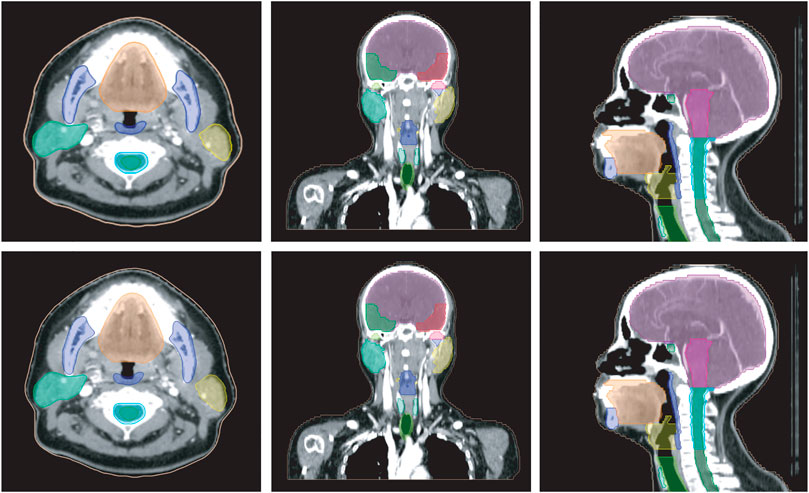
FIGURE 6. Comparison of HaN OARs segmentation using EB-Net-based auto-contouring (upper) and the physician manual delineation (lower).
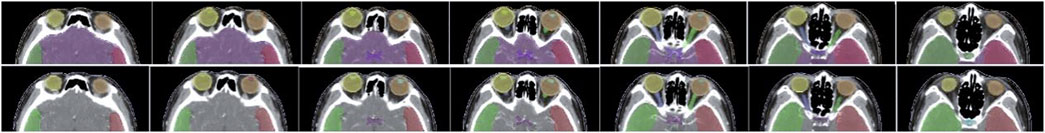
FIGURE 7. Comparison of segmentation of small organs using EB-Net-based auto-contouring (upper) with the physician manual delineation (lower).
3.2 Quantitative Evaluations
Ua-Net [20], Anatomy-Net [19] methods, and SRM [30] were used to compare and analyze the quality of SEB-Net contours with the current level. The Ua-Net, which was introduced in Nature Machine Intelligence in 2019, is one of the best current deep learning automatic segmentation methods. The Anatomy-Net, which was first described in Medical Physics in 2019, is a deep learning automatic segmentation method that is dedicated to the delineation of HaN OARs. The SRM, which was also published in Medical Physics in 2018, is a novel automated HaN OARs segmentation method that combines a fully convolutional neural network (FCNN) with a shape representation model (SRM). The delineated quality indexes for DSC of the four methods are reported in Table 2. As shown in the table, SEB-Net outperformed the other two methods for most of the endangered organ predictions. The average DSC of the three means on OARs was 0.871, 0.830, 0.808, and 0.771, respectively. The SEB-Net improved the DSC by 4.94% over Ua-Net, 7.80% over Anatomy-Net, and 12.97% over SRM.
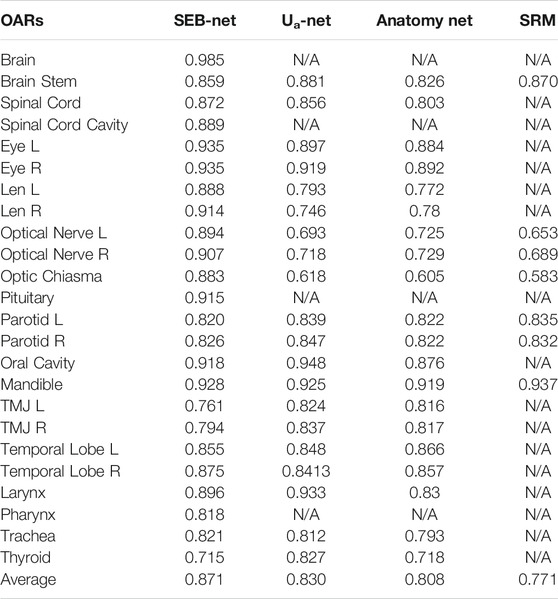
TABLE 2. Average DSC comparison on the test.
As shown in Table 3, SEB-Net was significantly better than the other three methods for the prediction of class Ⅲ small organs (lens, optic chiasma, optical nerves, and pituitary). The average DSC for the prediction of small volume organs by the four methods were 0.900, 0.714, 0.722, and 0.642 respectively. The SEB-Net improved prediction by 26.05% over Ua-Net, 24.65% over Anatomy-Net, and 40.19% over SRM.
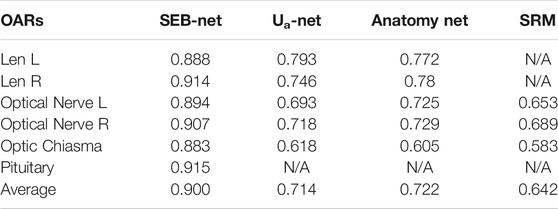
TABLE 3. Average DSC comparison for small organs on the test.
Table 4 shows comparisons among the 95% HD of the four methods. The mean 95% HD values of EB-Net, Ua-Net, Anatomy-Net, and SRM were 2.87 mm, 5.85 mm, 24.76 mm, and 3.04mm, respectively. 95% HD was used to evaluate the accuracy of delineating edges, and EB-Net significantly outperformed the other three methods in terms of edge prediction accuracy, improving by 50.94, 88.41, and 5.59%, respectively. As shown in Table 5, SEB-Net performed 95% HD significantly better than the other three methods for small organs. The average 95% HD of the four methods were 0.81, 3.30, 3.87, and 2.53 mm, respectively.
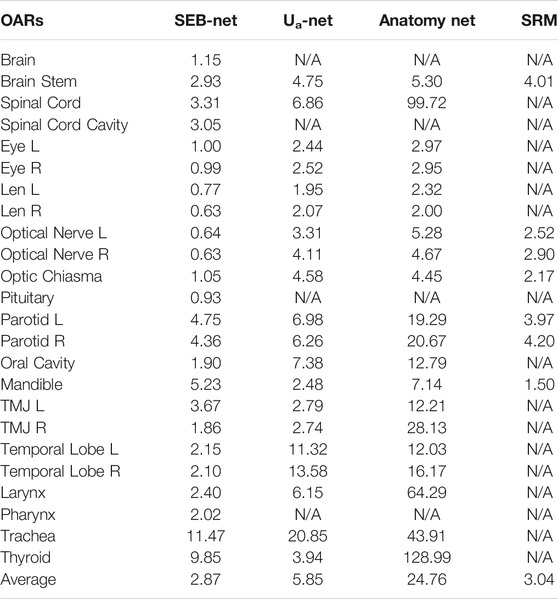
TABLE 4. Average 95% HD comparison on the test (unit: mm).
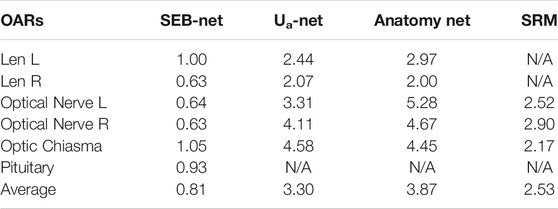
TABLE 5. Average 95% HD comparison for small organs on the test (unit: mm).
Table 6 reports the results in DSC and 95% HD of ablation studies. We found that sharing network weights improved DSC from 0.81 to 0.84, and 95% HD from 3.47 to 3.32 mm. By using the cross-entropy term with the proposed boundary loss term, we observed a 15.6% improvement in 95% HD and 3.5% improvement in DSC. Compared to another method using similar boundary-distance loss [25], our method achieved a significantly higher DSC, but a comparable 95% HD values.

TABLE 6. Ablation studies.
3.3 Clinical Application of SEB-Net
To further verify the extent to which the automatic delineating based SEB-Net was helpful to oncologists during clinical delineation, an additional 50 undelineated CT images were used. First, a junior oncologist performed SEB-Net-based contouring and manual-contouring, then a senior oncologist rated the quality of the delineation as needing no revisions, needing minor revisions, or needing major revisions for use in dose–volume–histogram (DVH)-based planning [11, 31].
Table 7 shows the mean time required to complete an initial delineation of a HaN cancer case by SEB-Net, and manual methods for junior oncologists were 0.87 and 45 min, respectively. The mean time required for senior oncologists to modify the initial delineation was 8.28 and 4.1 min, respectively. SEB-Net-based automatic delineation saved 81.36% of the time used to perform manual contouring. The APL for senior oncologists to modify the initial delineation by SEB-Net, and manual methods was 132 and 66 mm, respectively.

TABLE 7. Comparison of meantime and added path length required by different methods to delineate a HaN tumor case at different stages.
Table 8 presents the statistics for different OAR modifications by the senior oncologist in 50 cases after automatic delineation by the SEB-Net. Among the 50 cases, 81.92% of all organs did not need modification, 13.17% of all organs required minor revisions and only the remaining 4.91% of the organs required major revisions for clinical use.
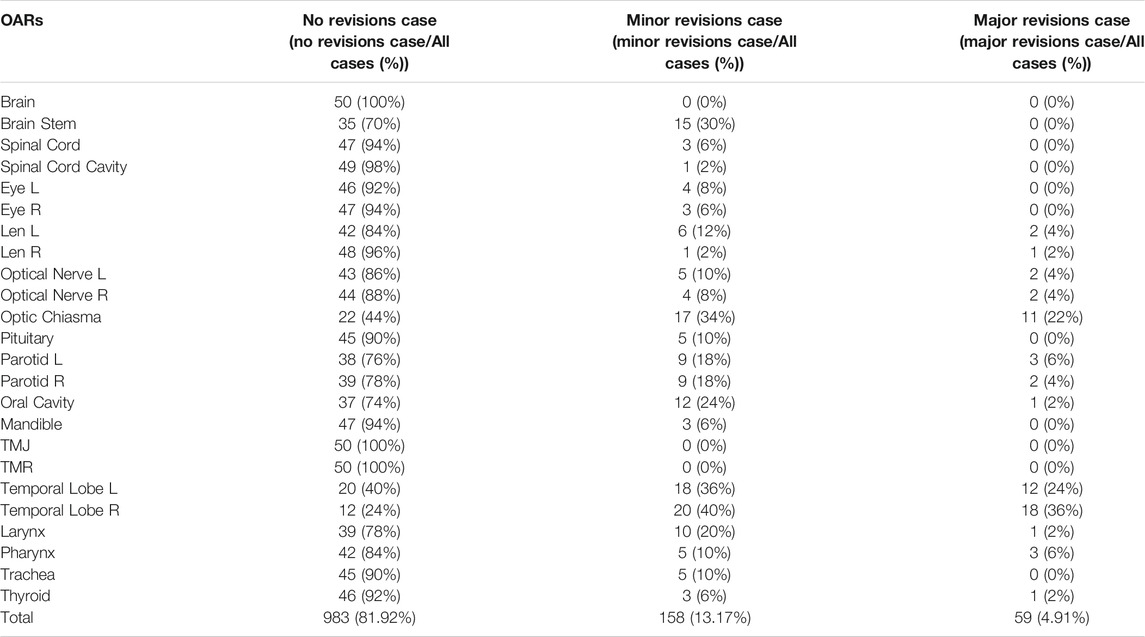
TABLE 8. The statistics for different OAR modifications by the senior oncologist in 50 cases after automatic delineation by SEB-Net.
4 Discussion
4.1 Delineating Accuracy Analysis
To further illustrate the advantages of the SEB-Net model in the OARs segmentation, we combined the two parameters (DSC and 95% HD) for analysis. Figure 8 reports the differences in DSC and 95% HD difference for the SEB-Net and Ua-Net methods. A DSC difference >0 indicated that SEB-Net is superior, while a 95% HD difference <0 indicated that the SEB-Net was superior. As shown in the figure, the DSC difference between the two methods was small (the left vertical axis represents the DSC difference) with an average value of 0.035, thus indicating that the SEB-Net-based DSC was better than that of the Ua-Net-based method on average. The 95% HD difference between the two methods was significant, with a mean value of −2.76 mm, indicating that SEB-Net has better organ edge accuracy. Except for mandible, TMJ L, and thyroid, the edge prediction of OARs is superior to Ua-Net.
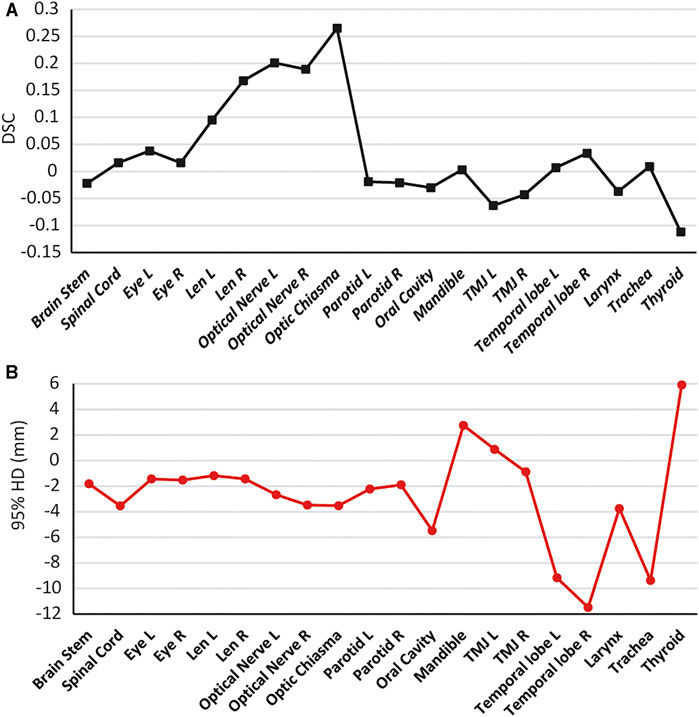
FIGURE 8. Quantitative comparison of SEB-Net method with Ua-Net method. (A): Comparison of DSC. (B): Comparison of 95% HD.
Ua-Net performed significantly better than SEB-Net on TMJ, probably due to the use of 3D deep neural networks, which are advantageous for organs with large cross-sectional spans. In SEB-Net, only three CT planes, coronal, sagittal, and cross-section were used, and the addition of other planes (e.g., oblique plane) would hopefully improve the performance of the EB-Net model on TMJ prediction.
In addition, SEB-Net was significantly better than the other three methods for the prediction of class III small organs (lens, optic chiasma, optic nerves, and pituitary). The cause of high-grade performance can be attributed to: 1) it is well known that an ensemble model is usually significantly more accurate than a single learner. Even if a weak learner is slightly better than a random guess, a combination of the wake learners can achieve strong performance in uncertain areas such as the small OARs; 2) the ensemble strategy with shared network weights increases the size of the training dataset, which correspondingly improves the quality of the model. With the three-view ensemble, our 2D model was trained with data samples three times more than a 3D model. More training samples improved the performance of all OARs, especially the small ones that may suffer from insufficient training samples; 3) the size of the small OARs was several orders of magnitude smaller than the other ones, which cause an unbalanced learning problem in the terms of machine learning. The boundary loss will penalize much more for the small OARs, helping to recover the small prediction areas.
4.2 SEB-Net Clinical Application Analysis
For clinical application evaluation of SEB-Net, the ultimate acceptability of contours was determined by the oncologist judgment for clinical use. The three-point system which is the most common exact rating systems was used [11, 31]. When oncologists use the SEB-Net-based auto-contouring, a few or partial modifications were needed for most of the organs. Our model can solve the repetitive labor in the delineation of Class I and Class II organs. The oncologist needs to focus on OARs such as the optic chiasma and temporal lobes. Consider the possibility that a number of optic chiasma layers in the CT images of each case was small, and the training set data were insufficient. These factors affected the model’s prediction accuracy. While the temporal lobe was not very clear on CT images, demarcation with the surrounding organs was not obvious, which affected the model’s prediction accuracy. These issues can be resolved by increasing the training set data or adding magnetic resonance imaging (MRI) to train the deep-learning model. Our results also suggest that many of the most commonly used geometric indices, such as the DSC, are not well correlated with clinically meaningful endpoints as indicated by Sherer et al. [11].
4.3 Limitations
This study has the following limitations. First, only CT images were used to train network, and some anatomical structures, such as the temporal lobe, have low contrast on CT, which is difficult to lineate with CT alone. Therefore, it is important to integrate information from other modal images (e.g., MRI). Second, the number of standard reference contours was still low, which limits the number of participants in the deep network. There is a need to develop an industry-wide standardized dataset. Multicenter of CT images and delineation can be used for deep learning training using the proposed method in future studies to improve the cross-domain adaptability and generalizability of the deep network. Third, it is worth noting that the previously published results were compared using different datasets. The comparison should ideally use the same training and testing data. However, we aim to achieve automatic segmentation of 24 OARs in HaN CT images. Training new models using the published methods is extremely time-consuming and heavy work. Despite this, we evaluated our model against oncologists on the same dataset and our model showed substantial improvement in terms of efficiency, feasibility, and applicability. Additionally, combining the boundary loss term with a 3D CNN having the strength to fully utilizing 3D volume information is possible. However, because of the limitations of GPU memory, computing power, and training samples, when designing 3D CNNs for 3D image segmentation, the trade-off between the field of view and utilization of inter-slice information in 3D images remains a major concern. For instance, 3D CNNs only have a limited field of view, whereas 2D CNNs can have a much larger field of view. Our 2.5D model used three different views to balance the two factors, thereby enabling us to employ a more complex CNN while still providing contextual information.
5 Conclusion
In summary, we have proposed and demonstrated a new deep-learning model (SEB-Net) for automatic segmentation in HaN CT images. To improve model performance (especially small organs), we proposed incorporating additional features. Multiple planar CT images were added in the training work, and the penalty weight of inaccurate edges was increased for the objective function used in the training work. The new deep learning method can accurately delineate HaN OARs, and its accuracy is better than the most advanced method at present. SEB-Net-based auto-contouring can save time for manual contouring. The new model has certain clinical applicability and a strong basis for clinical promotion.
Data Availability Statement
The datasets presented in this article are not readily available because data security requirement of our hospital. Requests to access the datasets should be directed to JW, bXB3YW5nanVuX3RqQDE2My5jb20=.
Ethics Statement
The studies involving human participants were reviewed and approved by the Medical Ethics Committee of Tianjin Medical University Cancer Institute and Hospital. The ethics committee waived the requirement of written informed consent for participation.
Author Contributions
WW and QW designed the project, performed data analysis, and drafted the manuscript. The manuscript was revised by MJ, ZW, and PW. QW, CW, and DZ wrote the programs. DH and SW analyzed and interpreted the patients’ data. NL and JW helped to check the contours. PW and JW guided the study and participated in discussions and preparation of the manuscript. All the authors reviewed and approved the manuscript.
Funding
This work was supported by the National Natural Science Foundation of China (Grant No. 81872472).
Conflict of Interest
The authors declare that the research was conducted in the absence of any commercial or financial relationships that could be construed as a potential conflict of interest.
Publisher’s Note
All claims expressed in this article are solely those of the authors and do not necessarily represent those of their affiliated organizations, or those of the publisher, the editors and the reviewers. Any product that may be evaluated in this article, or claim that may be made by its manufacturer, is not guaranteed or endorsed by the publisher.
Acknowledgments
The authors sincerely thank LinaTech for their technical support.
References
1. Torre LA, Bray F, Siegel RL, Ferlay J, Lortet-Tieulent J, Jemal A. Global Cancer Statistics, 2012. CA: A Cancer J Clinicians (2015) 65(2):87–108. doi:10.3322/caac.21262
2. Tran A, Zhang J, Woods K, Yu V, Nguyen D, Gustafson G, et al. Treatment Planning Comparison of IMPT, VMAT and 4π Radiotherapy for Prostate Cases. Radiat Oncol (2017) 12(1):10. doi:10.1186/s13014-016-0761-0
3. Lai S-Z, Li W-F, Chen L, Luo W, Chen Y-Y, Liu L-Z, et al. How Does Intensity-Modulated Radiotherapy versus Conventional Two-Dimensional Radiotherapy Influence the Treatment Results in Nasopharyngeal Carcinoma Patients? Int J Radiat Oncology*Biology*Physics (2011) 80(3):661–8. doi:10.1016/j.ijrobp.2010.03.024
4. Peng G, Wang T, Yang K-y., Zhang S, Zhang T, Li Q, et al. A Prospective, Randomized Study Comparing Outcomes and Toxicities of Intensity-Modulated Radiotherapy vs. Conventional Two-Dimensional Radiotherapy for the Treatment of Nasopharyngeal Carcinoma. Radiother Oncol (2012) 104(3):286–93. doi:10.1016/j.radonc.2012.08.013
5. Bonner JA, Harari PM, Giralt J, Cohen RB, Jones CU, Sur RK, et al. Radiotherapy Plus Cetuximab for Locoregionally Advanced Head and Neck Cancer: 5-year Survival Data from a Phase 3 Randomised Trial, and Relation between Cetuximab-Induced Rash and Survival. Lancet Oncol (2010) 11(1):21–8. doi:10.1016/S1470-2045(09)70311-0
6. Men K, Geng H, Cheng C, Zhong H, Huang M, Fan Y, et al. Technical Note: More Accurate and Efficient Segmentation of Organs‐at‐risk in Radiotherapy with Convolutional Neural Networks Cascades. Med Phys (2019) 46(1):286–92. doi:10.1002/mp.13296
7. Balagopal A, Kazemifar S, Nguyen D, Lin M-H, Hannan R, Owrangi A, et al. Fully Automated Organ Segmentation in Male Pelvic CT Images. Phys Med Biol (2018) 63(24):245015. doi:10.1088/1361-6560/aaf11c
8. Men K, Chen X, Yang B, Zhu J, Yi J, Wang S, et al. Automatic Segmentation of Three Clinical Target Volumes in Radiotherapy Using Lifelong Learning. Radiother Oncol (2021) 157:1–7. doi:10.1016/j.radonc.2020.12.034
9. van Dijk LV, Van den Bosch L, Aljabar P, Peressutti D, Both S, J.H.M. Steenbakkers R, et al. Improving Automatic Delineation for Head and Neck Organs at Risk by Deep Learning Contouring. Radiother Oncol (2020) 142:115–23. doi:10.1016/j.radonc.2019.09.022
10. Men K, Dai J, Li Y. Automatic Segmentation of the Clinical Target Volume and Organs at Risk in the Planning CT for Rectal Cancer Using Deep Dilated Convolutional Neural Networks. Med Phys (2017) 44(12):6377–89. doi:10.1002/mp.12602
11. Sherer MV, Lin D, Elguindi S, Duke S, Tan L-T, Cacicedo J, et al. Metrics to Evaluate the Performance of Auto-Segmentation for Radiation Treatment Planning: A Critical Review. Radiother Oncol (2021) 160:185–91. doi:10.1016/j.radonc.2021.05.003
12. Zhu J, Chen X, Yang B, Bi N, Zhang T, Men K, et al. Evaluation of Automatic Segmentation Model with Dosimetric Metrics for Radiotherapy of Esophageal Cancer. Front Oncol (2020) 10:564737. doi:10.3389/fonc.2020.564737
13. Hänsch A, Schwier M, Gass T, Morgas T, Haas B, Dicken V, et al. Evaluation of Deep Learning Methods for Parotid Gland Segmentation from CT Images. J Med Imag (2018) 6(1):1. doi:10.1117/1.JMI.6.1.011005
14. Duanmu H, Kim J, Kanakaraj P, Wang A, Joshua J, Kong J, et al. Automatic Brain Organ Segmentation with 3D Fully Convolutional Neural Network for Radiation Therapy Treatment Planning. Proc IEEE Int Symp Biomed Imaging (2020) 2020:758–62. doi:10.1109/isbi45749.2020.9098485
15. Ibragimov B, Xing L. Segmentation of Organs-At-Risks in Head and Neck CT Images Using Convolutional Neural Networks. Med Phys (2017) 44(2):547–57. doi:10.1002/mp.12045
16. Tam C, Tian S, Beitler JJ, Jiang X, Li S, Yang X. Automated Delineation of Organs-At-Risk in Head and Neck CT Images Using Multi-Output Support Vector Regression. Proc SPIE - Int Soc Opt Eng (2018) 1057824:1–10. doi:10.1117/12.2292556
17. Ren X, Xiang L, Nie D, Shao Y, Zhang H, Shen D, et al. Interleaved 3D-CNNs for Joint Segmentation of Small-Volume Structures in Head and Neck CT Images. Med Phys (2018) 45(5):2063–75. doi:10.1002/mp.12837
18. Ronneberger O, Fischer P, Brox T. U-Net: Convolutional Networks for Biomedical Image Segmentation. Med Image Comput Comp Assist Intervention-MICCAI 2015 (2015) 9351:234–41. doi:10.1007/978-3-319-24574-4_28
19. Zhu W, Huang Y, Zeng L, Chen X, Liu Y, Qian Z, et al. AnatomyNet: Deep Learning for Fast and Fully Automated Whole‐volume Segmentation of Head and Neck Anatomy. Med Phys (2019) 46(2):576–89. doi:10.1002/mp.13300
20. Tang H, Chen X, Liu Y, Lu Z, You J, Yang M, et al. Clinically Applicable Deep Learning Framework for Organs at Risk Delineation in CT Images. Nat Mach Intell (2019) 1(10):480–91. doi:10.1038/s42256-019-0099-z
21. Milletari F, Navab N, Ahmadi S-A. V-Net: Fully Convolutional Neural Networks for Volumetric Medical Image Segmentation. In: 3D Vision (3DV), 2016 Fourth International Conference on, IEEE; 25-28 October 2016; Stanford, California, USA., IEEE, (2016). p. 565–71. doi:10.1109/3DV.2016.79
22. Sudre CH, Li W, Vercauteren T, Ourselin S, Jorge Cardoso M. Generalised Dice Overlap as a Deep Learning Loss Function for Highly Unbalanced Segmentations. In: Deep Learning in Medical Image Analysis and Multimodal Learning for Clinical Decision Support. Springer (2017). p. 240–8. doi:10.1007/978-3-319-67558-9_28
23. Iyer A, Thor M, Haq R, Deasy JO, Apte AP. Deep Learning-Based Auto-Segmentation of Swallowing and Chewing Structures. bioRxiv (2020). doi:10.1101/772178
24. Yu B, Zhou L, Wang L, Shi Y, Fripp J, Bourgeat P. Ea-GANs: Edge-Aware Generative Adversarial Networks for Cross-Modality MR Image Synthesis. IEEE Trans Med Imaging (2019) 38(7):1750–62. doi:10.1109/TMI.2019.2895894
25. Karimi D, Salcudean SE. Reducing the Hausdorff Distance in Medical Image Segmentation with Convolutional Neural Networks. IEEE Trans Med Imaging (2020) 39(2):499–513. doi:10.1109/TMI.2019.2930068
26. Paszke A, Gross S, Massa F, Lerer A, Brabury J, Chanan G, et al. PyTorch: An Imperative Style, High-Performance Deep Learning Library. Adv Neural Inf Process Syst (2019) 32:8024–35.
27. Brouwer CL, Steenbakkers RJHM, Bourhis J, Budach W, Grau C, Grégoire V, et al. CT-based Delineation of Organs at Risk in the Head and Neck Region: DAHANCA, EORTC, GORTEC, HKNPCSG, NCIC CTG, NCRI, NRG Oncology and TROG Consensus Guidelines. Radiother Oncol (2015) 117(1):83–90. doi:10.1016/j.radonc.2015.07.041
28. Raudaschl PF, Zaffino P, Sharp GC, Spadea MF, Chen A, Dawant BM, et al. Evaluation of Segmentation Methods on Head and Neck CT: Auto-Segmentation challenge 2015. Med Phys (2017) 44(5):2020–36. doi:10.1002/mp.12197
29. Vaassen F, Hazelaar C, Vaniqui A, Gooding M, van der Heyden B, Canters R, et al. Evaluation of Measures for Assessing Time-Saving of Automatic Organ-At-Risk Segmentation in Radiotherapy. Phys Imaging Radiat Oncol (2020) 13:1–6. doi:10.1016/j.phro.2019.12.001
30. Tong N, Gou S, Yang S, Ruan D, Sheng K, Fully Automatic Multi‐organ Segmentation for Head and Neck Cancer Radiotherapy Using Shape Representation Model Constrained Fully Convolutional Neural Networks. Med Phys (2018) 45(10):4558–67. doi:10.1002/mp.13147
31. McCarroll RE, Beadle BM, Balter PA, Burger H, Cardenas CE, Dalvie S, et al. Retrospective Validation and Clinical Implementation of Automated Contouring of Organs at Risk in the Head and Neck: A Step Toward Automated Radiation Treatment Planning for Low- and Middle-Income Countries. Jgo (2018) 4:1–11. doi:10.1200/JGO.18.00055
Keywords: radiotherapy, convolutional neural networks, automatic segmentation, head and neck cancer, deep learning
Citation: Wang W, Wang Q, Jia M, Wang Z, Yang C, Zhang D, Wen S, Hou D, Liu N, Wang P and Wang J (2021) Deep Learning-Augmented Head and Neck Organs at Risk Segmentation From CT Volumes. Front. Phys. 9:743190. doi: 10.3389/fphy.2021.743190
Received: 17 July 2021; Accepted: 28 September 2021;
Published: 19 November 2021.
Edited by:
Eliana Maria Vasquez Osorio, The University of Manchester, United KingdomReviewed by:
Kuo Men, Chinese Academy of Medical Sciences and Peking Union Medical College, ChinaAndrew Green, The University of Manchester, United Kingdom
Copyright © 2021 Wang, Wang, Jia, Wang, Yang, Zhang, Wen, Hou, Liu, Wang and Wang. This is an open-access article distributed under the terms of the Creative Commons Attribution License (CC BY). The use, distribution or reproduction in other forums is permitted, provided the original author(s) and the copyright owner(s) are credited and that the original publication in this journal is cited, in accordance with accepted academic practice. No use, distribution or reproduction is permitted which does not comply with these terms.
*Correspondence: Jun Wang, bXB3YW5nanVuX3RqQDE2My5jb20=; Ping Wang, eWloYWlkYW9oYW5nQDE2My5jb20=