 Zhihai Zheng
 Jin Ban2*
- 1National Climate Center, Laboratory for Climate Studies, China Meteorological Administration, Beijing, China
- 2Heilongjiang Meteorological Bureau, Harbin, China
The impact of the Arctic Oscillation (AO) on the predictability of mid-high latitude circulation in December is analysed using a full set of hindcasts generated form the Beijing Climate Center Atmospheric General Circulation Model version 2.2 (BCC_AGCM2.2). The results showed that there is a relationship between the predictability of the model on the Eurasian mid-high latitude circulation and the phase of AO, with the highest predictability in the negative AO phase and the lowest predictability in the normal AO phase. Moreover, the difference of predictability exists at different lead times. The potential sources of the high predictability in the negative AO phase in the BCC_AGCM2.2 model were further diagnosed. It was found that the differences of predictability on the Eurasian mid-high latitude circulation also exist in different Arctic sea ice anomalies, and the model performs well in reproducing the response of Arctic sea ice on the AO. The predictability is higher when sudden stratospheric warming (SSW) events occur, and strong SSW events tend to form a negative AO phase distribution in the Eurasian mid-high latitudes both in the observation and model. In addition, the model captured the blocking over the mid-high latitudes well, it may be related to the relatively long duration of the blocking. Changes in the AO will affect the blocking circulations over the mid-high latitudes, which partly explains the high predictability of the model in negative AO phases from the aspect of the internal atmospheric dynamics.
Introduction
The Arctic Oscillation (AO) is the dominant mode of the interannual variability in the extratropical regions of the Northern Hemisphere in winter. Its typical feature is the opposite change in pressure between the polar regions and the mid-high latitudes in the Northern Hemisphere [1, 2]. The AO exerts a strong impact on the climate of North America, Eurasia, and North Africa through the zonal variation in the North Atlantic storm track and the related temperature, precipitation, and cyclone activities in winter [3–9]. Changes in the East Asian winter monsoon (EAWM) and winter surface climate that have a great social impact on East Asia are closely related to the interannual and interdecadal changes in the AO. The atmospheric circulation anomaly corresponding to the negative AO phase tends to be a strong EAWM and cold surface air temperature (SAT) anomaly in East Asia in winter and often brings strong cold wave events [10, 11], and vice versa [12–14].
The AO is most common in winter and occurs on time scales ranging from intraseasonal to interdecadal [15]. On subseasonal to interannual time scales, the predictability of the AO is mainly affected by the chaotic characteristics of the air-sea system and the nonlinear dynamics of the extratropical atmosphere [16, 17]. Many studies have focused on the forecast skill of the AO on the scale of the winter average [18–21]. Recent studies have shown that advanced seasonal forecast models have significantly improved the forecast skill of the AO in winter [22, 23]. In terms of predictable sources on the seasonal scale, in addition to the internal atmospheric dynamics, the predictability of the AO in winter is related to underlying surface anomalies, such as the North Atlantic sea surface temperature and the snow cover anomalies in the Northern Hemisphere [24–26].
However, the forecast skill of the AO is more challenging on the subseasonal scale. Currently, there are relatively few assessments on this time scale. The forecast skills of some operational dynamical forecast systems, such as the National Centers for Environmental Prediction (NCEP), the European Centre for Medium-Range Weather Forecasts (ECMWF) and the Beijing Climate Center, were evaluated, the results showed that the forecast skills were low at the subseasonal scale [20, 27, 28]. The low forecast skill of the AO on the subseasonal scale is related to a lack of understanding of its predictable sources. The variability in the stratospheric polar vortex may also provide an important source for the predictability of the subseasonal AO. Studies have shown that the stratospheric polar vortex can propagate downward through westerly and easterly wind anomalies. Sudden stratospheric warming (SSW) can dramatically weaken the stratospheric polar vortex, and the weakened Northern Hemispheric stratospheric polar vortex is beneficial for the turning of the tropospheric and near-surface AO to the negative phase in winter[29, 30]. In addition, the recent accelerated reduction in Arctic sea ice is also considered to be a possible factor in the changes in the mid-high latitude circulation in winter, and the response characteristics of circulation are often similar to AO modes, especially in some numerical models [31, 32]. However, the relatively short observational record and the low mid-latitude signal-to-noise ratio (SNR) lead to difficulties when explaining the physical connection between Arctic sea ice and the AO mode, so this connection is still controversial.
Existing studies have shown that the ability of a model to forecast the AO differs in different months, including winter months. At the same time, the relationship between the AO and the East Asian climate shows intraseasonal variability, and the impact of the AO on the temperature in southern China in December is different from that in January-February [8]. Meanwhile, the circulation anomalies affected by the December AO for December and for the following January are primarily confined to the Euro-Atlantic sector while they extend to East Asia during the following February [33]. In addition, the standard deviation of the AO has increased significantly in December since the 1990s, while this phenomenon has not been observed in November and January [34]. Therefore, this study aims to evaluate the predictability of mid-high latitude circulation in BCC_AGCM2.2, with a focus on December. More importantly, we investigate the differences of predictability in different AO phases and the possible causes for the differences are also further analysed.
Data
The BCC_AGCM2.2 has a horizontal resolution of T106 and includes 26 vertical levels [35]. The top of the model is at 2.3 hPa. The model is initialized using the atmospheric conditions from the NCEP Reanalysis dataset [36] and sea-surface conditions from NOAA Optimum Interpolation Sea Surface Temperature V2 [37]. Four model runs (00Z, 06Z, 12Z, and 18Z) are initialized every day starting on January 1, 1983 and run for 55 days each. The lagged average forecasting (LAF) technique is used to produce the ensemble mean. The LAF ensemble includes the latest 5 days (A total of 20 members) operational forecasts, and also forecasts for the same verification time stated one or more days earlier than the latest one. The model output is interpolated to a 2.5 × 2.5 horizontal resolution prior to analysis. To verify the model hindcast, we use the daily and monthly NCEP-NCAR reanalysis dataset for the period 1983–2015. The NCEP-NCAR reanalysis data are gridded at 2.5 × 2.5 resolution. The SST data gridded at 2 × 2 resolution used in this study are taken from the National Oceanic and Atmospheric Administration extended reconstructed SST version 4 (ERSST V4) [38]. The optimal interpolated global sea ice density data from December 1981 to December 2015 are provided by NOAA, with a horizontal resolution of 1.0 ×1.0. The observed monthly AO index derive from the Climate Prediction Center of NOAA (https://www.cpc.ncep.noaa.gov/products/precip/CWlink/pna/nao.shtml), which is defined as the first leading mode of empirical orthogonal function (EOF) analysis of area-weighted monthly mean 1000 mb anomalies north of 20°N. The predicted index is calculated using the 1000 mb anomalies of ensemble mean.
Methods
The Signal-to-noise ratio (SNR) is used to account for the predictability of mid-high latitude circulation, which is estimated by the ratio of the variances of ensemble mean (the signal) to the deviations or spreads among the ensemble members (the noise) [39, 40]. At a given location, the prediction of a single ensemble member is denoted by
The yearly mean climatology
The variance of ensemble mean represents the climate signal as
Note that the denominator is 32 instead of 33 because the degrees of freedom are one less than the total number for a second moment. Similarly, the deviations or spreads among the ensemble members represents the noise as
The Signal-to-noise ratio is recalculated as
The anomaly correlation coefficient (ACC) is also chosen as a measure to gauge the predictability that we are interested in. The ACC is defined as:
Where
The composite is employed to compare prediction skill in different AO phases. The wave activity flux is used to provide information about the large-scale wave source and sink [41].
Prediction Skill and Predictability of AO and Mid-high Latitude Circulation
To test the forecast skill of AO, we first decomposed the 1,000 hPa extratropical height in the Northern Hemisphere (0–360°E, 20°N-90°N) using the empirical orthogonal function (EOF) and then projected the result onto the observed first mode to obtain the AO index series predicted by the model. Figure 1 shows the temporal evolution of December AO index hindcast by BCC_AGCM2.2 at 0-days, 5-days, and 10-days lead times for the ensemble mean from 1983 to 2015. The results showed that the temporal evolution of AO index predicted at different lead times were relatively consistent with the observation. The correlation coefficients between the AO indexes predicted at 0-days, 5-days, and 10-days lead times and the observed AO indexes were 0.71, 0.68, and 0.69, respectively, which all exceed 99.9% confidence, indicating that the dynamic model can well capture the AO interannual variability in December. In addition, in the typical positive and negative phase years, the AO index predicted by the model were also very close to the observed AO index.
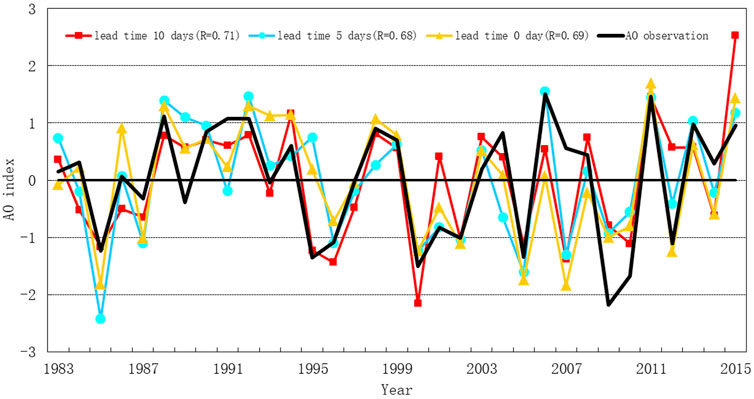
FIGURE 1. Temporal evolution of December AO index hindcast by BCC_AGCM2.2 at 0-days (yellow), 5-days (Cyan), and 10-days (red) lead times for the ensemble mean, and the observations (black).
The AO is the dominant mode of the interannual variability in atmospheric circulation in the mid-high latitude regions of the Northern Hemisphere. Figure 2 shows the ACC of the 500 hPa geopotential height over the Eurasian region (20°-80°N, 50°-180°E) predicted by the model at 0-days, 5-days, and 10-days lead times. According to the AO index and its standard deviations, the 33 years for 1983–2015 were divided into negative AO phase, normal AO phase and positive AO phase. Negative AO years include 1985, 1995, 2000, 2005, 2009, 2010, and 2012, and the index is greater than 1 standard deviation. Positive AO years include 1988, 1991, 1992, 1998, 2006, 2011, 2013, and 2015, and the index is greater than 1 standard deviation. The remaining 18 years are the normal AO years. In terms of the average over all years, the forecast skill decreased rapidly with the extension of the lead time, the ACCs predicted at 0-days, 5-days, and 10-days lead times were approximately 0.5, 0.4, and 0.27, respectively. Additionally, the ACC predicted at 0-days lead time was 0.76 in the negative AO phase, 0.48 in the positive AO phase, and 0.4 in the normal AO phase. Although the forecast skills at 5-days and 10-days lead times were both lower than those at 0-days lead time, the ACC was still highest in the negative AO phase, followed by the positive AO phase, and lowest in the normal AO phase. Interestingly, when the AO phase was positive, the forecast skill decreased the slowest with the extension of the lead time.
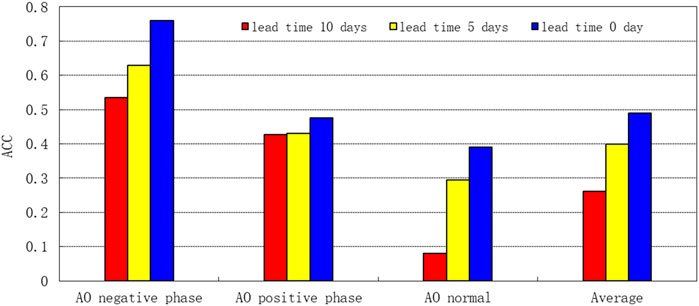
FIGURE 2. ACC of the 500 hPa geopotential height in the Eurasian region predicted by BCC_AGCM2.2 in negative, positive, and normal AO phases.
To further examine the prediction skill in the lower troposphere, Figure 3 displays the composites of 1,000 hPa geopotential height for different AO phases in the model and observations. Due to different lead times the skill changes are similar, we only chose the prediction at 0-days lead time. In the negative AO phase, a huge positive anomaly occupies the entire northern Eurasia continent, and a negative anomaly is seen over the Northwest Pacific. The large zonal gradient between the anomalous Eurasia continent high and the subtropical North Pacific low implies strong EAWM. The distributions in the model and observation were very similar, including the significant positive and negative anomaly region. The anomalous distributions in positive AO phase were also quite similar, with a major trough extending southward along the Ural Mountain and a ridge extending northward along the Mongolia. However, the intensity of the trough and ridge in the model prediction is obviously weak, and the significant positive anomaly in Eastern China and Mongolia is not seen in prediction. The anomalous center in prediction and observation are not significant in the normal AO Phase.
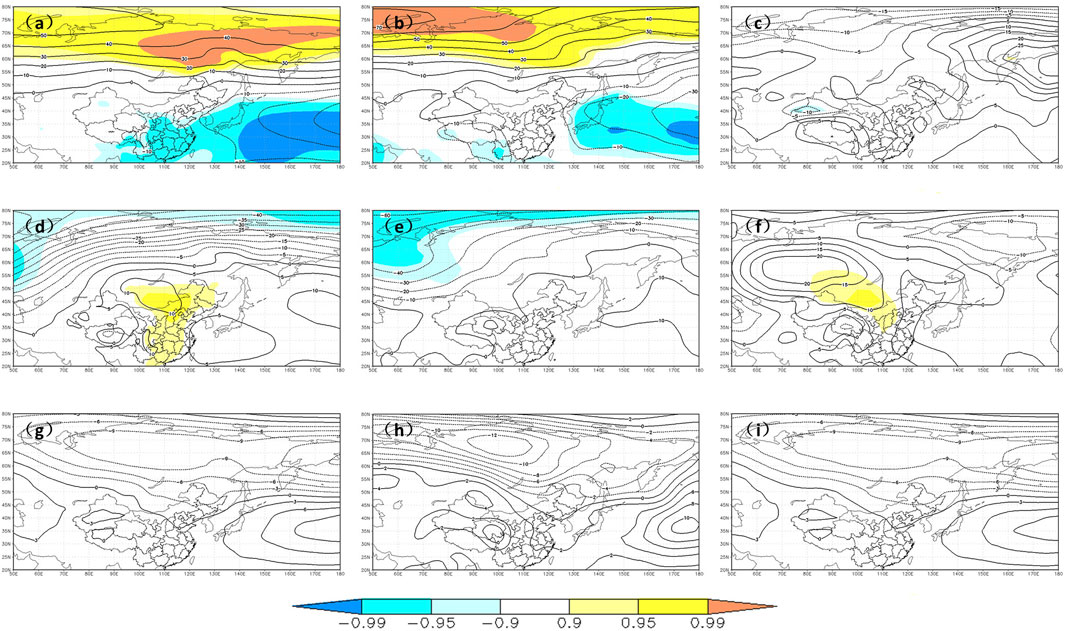
FIGURE 3. Composites of 1,000 hPa geopotential height for the negative AO phase in (A) model (B) observations (C) The difference between prediction and observation (D–F) As in (A–C), but for the positive AO phase (G–I) As in (A–C), but for the normal AO phase. Light, middle, and dark shading indicate the 90, 95, and 99% confidence levels based on a Student’s t-test, respectively.
Based on the above analysis, the model has a high predictability for the geopotential height in the Eurasian region in the negative AO phase. On this basis, the SNR method was applied to further analyse the predictability of the model over the Eurasian region in different AO phases (Figure 4). In the case of a negative AO phase, the SNR of the model was greater than 1 from east of Japan to the northwest Pacific, indicating that the model can generally well capture the strength and location of the East Asian trough in the negative AO phase. The model predicted a high SNR in the Sea of Okhotsk region and West Pacific in positive AO phase. Additionally, The SNR in the normal AO phase was the lowest.
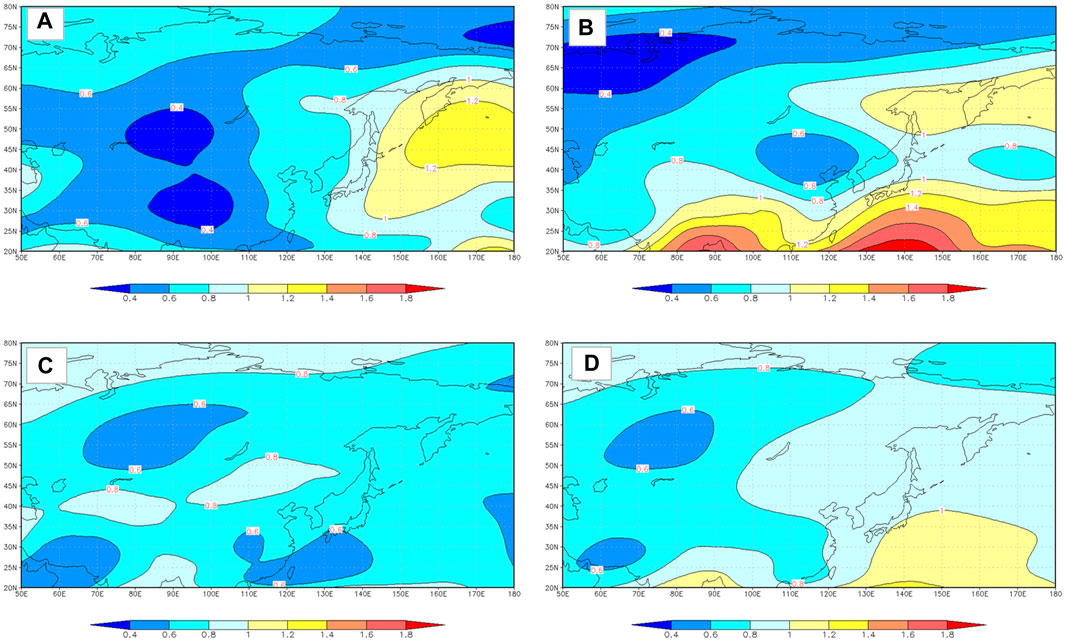
FIGURE 4. The signal-to-noise ratio distributions for the AO in the (A) negative phase, (B) positive phase, (C) normal phase, and (D) all years.
Causes for the Different Predictability
The above results show that the prediction skill of the negative AO phase is higher than that of the positive and normal AO phases. To explain the origins of the potential predictable sources of the high forecast skill of the negative AO phase in the BCC_AGCM2.2 model, the possible causes were analysed from the aspects of the Arctic sea ice, sudden stratospheric warming (SSW), and the internal atmospheric dynamics.
As a component of the Earth’s climate system, Arctic sea ice plays an important role in the surface energy budget of the high latitudes in the Northern Hemisphere by regulating the surface albedo and the turbulent heat and momentum fluxes at the ocean-atmosphere interface. The atmospheric response to reductions in Arctic sea ice is often associated with changes in the AO [31, 32]. Figure 5 shows the composite Arctic sea ice anomalies in the negative and positive AO phases. The figure shows that when the AO is in the negative phase, the Arctic sea ice has a significantly negative anomaly centre in the Kara Sea region, which exceeds the 95% confidence level. When the AO is in the positive phase, the positive Arctic sea ice anomaly only exceeds the 95% confidence level in the vicinity of the Kara Sea, and the region that passes the 95% confidence level is significantly smaller than that in the negative AO phase.
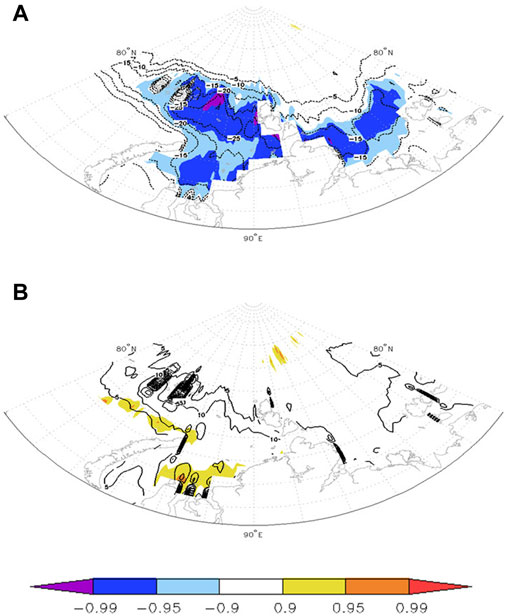
FIGURE 5. Composite of autumn Arctic sea ice in the (A) negative AO phase and (B) positive AO phase years. Light, middle, and dark shading indicate the 90, 95, and 99% confidence levels based on a Student’s t-test, respectively.
We define the sea ice in the Barents Sea-Kara Sea region (60°-90°E, 70°-80°N) in October as the Arctic sea ice index, they are area weighted and linearly detrended before the analysis. The correlation coefficient between the December AO index and the autumn Arctic sea ice index is 0.40 (Figure 6B), which exceeds the 95% confidence. Then, 5 years with less sea ice (1984, 1985, 1995, 2009, and 2012) and 5 years with more sea ice (1992, 1996, 1998, 1999, and 2002) were selected for comparing the prediction skill. The ACC of the 500 hPa geopotential height in the Eurasian region predicted by BCC_AGCM2.2 in less Arctic sea ice years at 0-days and 5-days lead times were 0.63 and 0.62, respectively, which were significantly higher than those (0.4 and 0.35) in years with more ice (Figure 6A). This finding is consistent with the observed and model-predicted negative feedback between the sea ice and the atmosphere, indicating that less Arctic sea ice is one of the predictable sources of the Eurasian mid-high latitude circulation. The composites of the 500 hPa geopotential height in years with less and more sea ice was further analysed in Figure 7. There are significant negative anomalies over most areas of China in years with less Arctic sea ice, while the anomalies are not clearly significant in years with more Arctic sea ice, indicating that the response to less Arctic sea ice forcing over the Eurasian mid-high latitudes is much obvious than more Arctic sea ice.
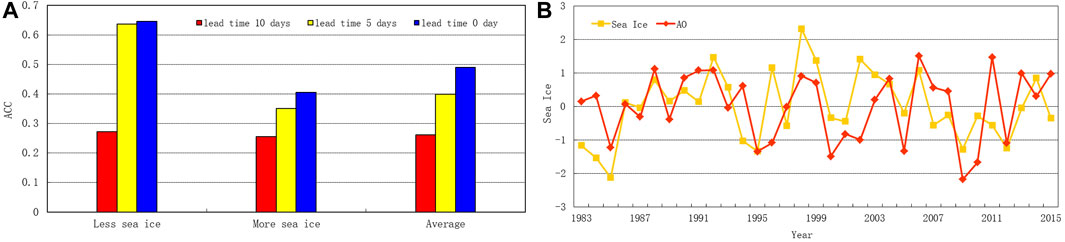
FIGURE 6. (A) ACC of the 500 hPa geopotential height in the Eurasian region predicted by BCC_AGCM2.2 in less, more, and average Arctic sea ice, (B) temporal evolution of December AO index and Arctic sea ice.
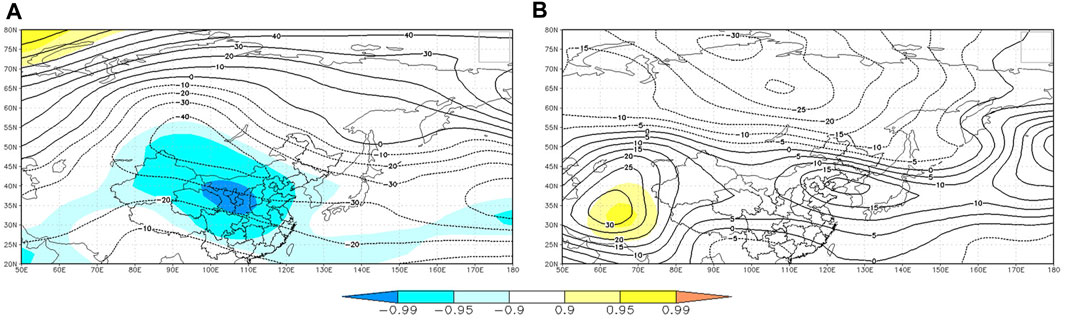
FIGURE 7. Composite of the 500 hPa geopotential height in years with (A) less and (B) more Arctic sea ice. Light, middle, and dark shading indicate the 90, 95, and 99% confidence levels based on a Student’s t-test, respectively.
The influence of the stratospheric polar vortex can last for several weeks or even several months, and SSW can dramatically weaken the stratospheric polar vortex. The zonal geopotential height anomalies of 90°N and 60°N at 10 hPa were averaged separately, and then the mean zonal geopotential height anomaly of 60°N was subtracted from the mean zonal geopotential height anomaly of 90°N to obtain the index [29]. The specific formula is
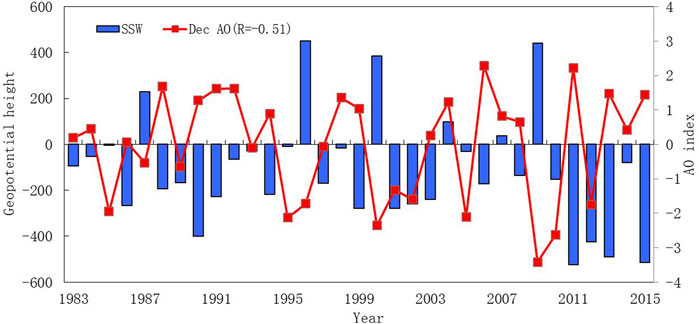
FIGURE 8. The SSW index in November and the AO index in December.
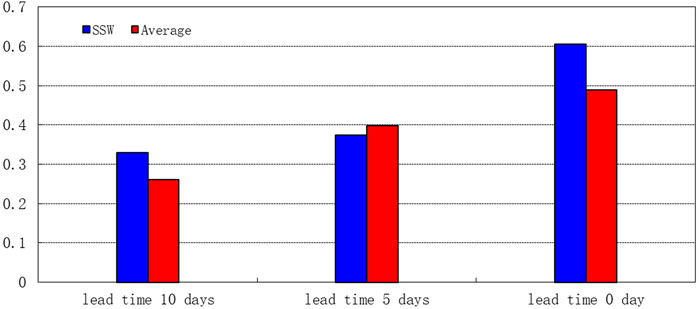
FIGURE 9. ACC of the 500 hPa geopotential height in the Eurasian region predicted by BCC_AGCM2.2 in SSW events and all years.
Some studies pointed out that the blocking high over the Ural Mountains in winter occurs more frequently in years with a weak AO and less frequently in years with a strong AO [42]. The composite of the observed 500 hPa geopotential high is computed based on the mean of years with the positive AO minus that with the negative AO (Figure 10A). The strong high pressure anomaly is located at the Ural Mountains and the Sea of Okhotsk, and the low pressure anomaly is located at the Northern China and Mongolia. The anomalous high over Ural Mountains and the Sea of Okhotsk are conductive to the activity of blocking. The similar distribution is also seen in model (Figure 10B), which implies good prediction of blocking in extreme years of AO. To further explain that the predictability of the model under different AO phases is related to the blocking high situation over the mid-high latitudes, the average of 500 hPa geopotential high over the Ural Mountains (40°N-50°N, 40°E-80°E), the Lake Baikal (60°N-70°N, 80°E-120°E), and the Sea of Okhotsk (60°N-70°N, 120°E-160°E) were defined as the blocking indices, and their normalized indices were shown in Figure 11. Blocking activity in the three regions were obvious for 6 out of 7 negative AO years. However, there were only 4 years with active blocking in 8 positive AO phase years. Therefore, the probability of the occurrence of a blocking high over the mid-high latitudes is higher in the negative AO phase and lower in the positive AO phase. The model can capture most of the blocking, but all three blocking in 2000, blocking of the Sea of Okhotsk in 2009 and the blocking of the Ural Mountains in 2010. In summary, changes in the AO will affect the blocking circulations over the mid-high latitudes, and the model can well capture the blocking over the mid-high latitudes, it may be related to the long duration and persistence of blocking [43]. It partly explains the high predictability of the model in negative AO phases from the aspect of the internal atmospheric dynamics.
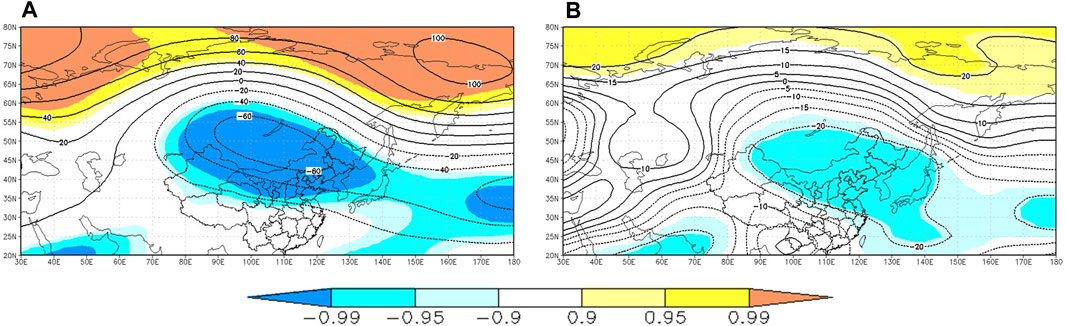
FIGURE 10. The composite of the 500 hPa geopotential height in (A) observation and (B) model, which are defined as the mean of years with the positive AO minus that with the negative AO. Light, middle, and dark shading indicate the 90, 95, and 99% confidence levels based on a Student’s t-test, respectively.
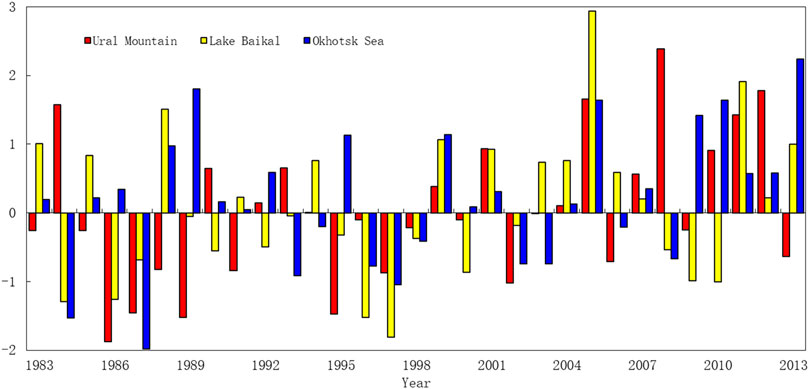
FIGURE 11. Blocking high indexes of the Ural Mountains, Lake Baikal, and the Sea of Okhotsk.
The wave source is in the North Atlantic Ocean and gradually propagates along Europe to the mid-high latitudes of Asia in the negative AO phase (Figure 12). The model also predicts a westward propagating wave source in the North Atlantic Ocean, which also moves towards the mid-high latitudes of Asia, but there are differences in magnitude and propagation phase. However, the wave activity center over Tibetan Plateau is underestimated by BCC_AGCM2.2. In general, the internal atmospheric dynamics of the model in the negative AO phase are better than those in positive AO phase.
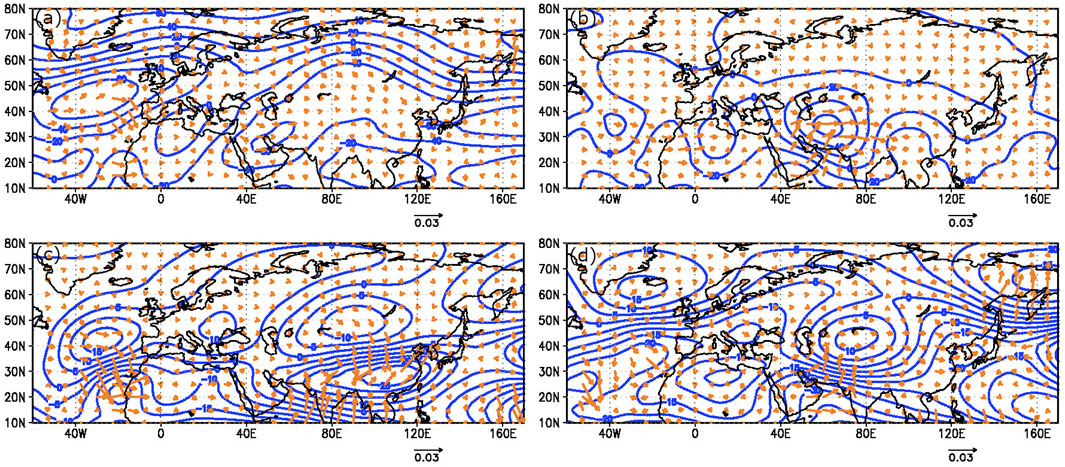
FIGURE 12. Composites of wave activity flux for the (A) negative and (B) positive AO phase in observations, (C–D) As in (A–B), but for model.
Discussion and Conclusions
The Arctic Oscillation (AO) is the dominant mode of the interannual variability in atmospheric circulation in the extratropical regions of the Northern Hemisphere in winter. The impact of the AO on the predictability of mid-high latitude circulation in December was analysed using a full set of hindcasts generated form the Beijing Climate Center Atmospheric General Circulation Model version 2.2 (BCC_AGCM2.2). The results showed that there is a relationship between the predictability of the model on the Eurasian mid-high latitude circulation and the phase of AO, with the highest predictability in negative AO phase and lowest predictability in normal AO phase. Moreover, the difference of predictability exists in different lead times.
To explain the origins of the potential predictable sources of the high forecast skill of the negative AO phase in the BCC_AGCM2.2 model, the possible causes of these conditions were diagnosed. We found that the differences of predictability on the Eurasian mid-high latitude circulation also exist in different Arctic sea ice anomalies. When Arctic sea ice decreases, the AO response is likely to be in a negative phase. The model also performs well in reproducing the response of Arctic sea ice on the AO. Sudden stratospheric warming is another potential source of higher predictability on the Eurasian mid-high latitude circulation in negative AO phase. The ACC at 0-days and 10-days lead time in SSW events was higher than the average of other years, and strong SSW events tend to form a negative AO phase distribution in the Eurasian mid-high latitudes. In addition, the model captures the blocking over the mid-high latitudes well, which may be related to the relatively long duration of the blocking. Further, changes in the AO will affect the blocking circulations over the mid-high latitudes, which explains the high predictability of the model under negative AO phases from the aspect of the internal atmospheric dynamics.
Although BCC_AGCM2.2 has relatively high predictability of mid-high latitude circulation in December in negative AO phase, the predictability is still much lower in other conditions and other months. Apart from the AO, other factors such as Madde–Julian Oscillation (MJO) and the sea surface temperature over the North Atlantic Ocean and Indian Ocean are also important for the predictability of Eurasian mid-high latitude circulation [44, 45]; meanwhile, the predictability of models are different; these would be worthwhile to address in further works.
Data Availability Statement
The original contributions presented in the study are included in the article/supplementary material, further inquiries can be directed to the corresponding author.
Author Contributions
ZZ initiated the project. JB performed the data analysis. ZZ and JB wrote the initial draft of the paper. All authors contributed to interpreting results and improvement of this paper.
Funding
This work was supported by the National Natural Science Foundation of China (41875101), the National Key Research and Development Program of China (2017YFC1502303) and the National Natural Science Foundation of China (41805060).
Conflict of Interest
The authors declare that the research was conducted in the absence of any commercial or financial relationships that could be construed as a potential conflict of interest.
Publisher’s Note
All claims expressed in this article are solely those of the authors and do not necessarily represent those of their affiliated organizations, or those of the publisher, the editors and the reviewers. Any product that may be evaluated in this article, or claim that may be made by its manufacturer, is not guaranteed or endorsed by the publisher.
References
1. Thompson D. W. J., Wallace J. M., Annular Modes in the Extratropical Circulation. Part I: Month-To-Month Variability. J Clim (2000) 13:1000–16. doi:10.1175/1520-0442(2000)013<1000:amitec>2.0.co;2
2. Thompson D. W. J., Wallace J. M., The Arctic Oscillation Signature in the Wintertime Geopotential Height and Temperature fields. Geophys Res Lett (1998) 25:1297–300. doi:10.1029/98gl00950
3. Hurrell J. W., Decadal Trends in the North Atlantic Oscillation: Regional Temperatures and Precipitation. Science (1995) 269:676–9. doi:10.1126/science.269.5224.676
4. Li J., Zheng F., Sun C., Feng J., Wang J., Pathways of Influence of the Northern Hemisphere Mid-high Latitudes on East Asian Climate: A Review. Adv Atmos Sci (2019) 36:902–21. doi:10.1007/s00376-019-8236-5
5. Huang J., Ji M., Higuchi K., Shabbar A., Temporal Structures of the North Atlantic Oscillation and its Impact on the Regional Climate Variability. Adv Atmos Sci (2006) 23:23–32. doi:10.1007/s00376-006-0003-8
6. Sun C., Li J., Feng J., Xie F., A Decadal-Scale Teleconnection between the North Atlantic Oscillation and Subtropical Eastern Australian Rainfall. J Clim (2015) 28:1074–92. doi:10.1175/jcli-d-14-00372.1
7. Feng J., Zhu J., Li J., Liao H. Aerosol Concentrations Variability over China: Two Distinct Leading Modes. Atmos Chem Phys (2020) 20:9883–9893. doi:10.5194/acp-20-9883-2020
8. Zuo J., Ren H-L., Li W., Contrasting Impacts of the Arctic Oscillation on Surface Air Temperature Anomalies in Southern China between Early and Middle-To-Late Winter. J Clim (2015) 28:4015–26. doi:10.1175/jcli-d-14-00687.1
9. Feng J., Li J., Liao H., Zhu J., Simulated Coordinated Impacts of the Previous Autumn North Atlantic Oscillation (NAO) and winter El Niño on winter Aerosol Concentrations over Eastern China. Atmos Chem Phys (2019) 19:10787–800. doi:10.5194/acp-19-10787-2019
10. Jeong J. H., Ho C. H., Changes in Occurrence of Cold Surges over East Asia in Association with Arctic Oscillation. Geophys Res Lett (2005) 32:L14704. doi:10.1029/2005gl023024
11. Hong C. C., Hsu H. H., Chia H. H., Wu C. Y., Decadal Relationship between the North Atlantic Oscillation and Cold Surge Frequency in Taiwan. Geophys Res Lett (2008) 35:L24707. doi:10.1029/2008gl034766
12. Gong D. Y., Wang S. W., Zhu J. H., East Asian winter Monsoon and Arctic Oscillation. Geophys Res Lett (2001) 28:2073–6. doi:10.1029/2000gl012311
13. Wu B., Wang J., Winter Arctic Oscillation, Siberian High and East Asian winter Monsoon. Geophys Res Lett (2002) 29:1897. doi:10.1029/2002gl015373
14. Gong D., Wang S., Influence of Arctic Oscillation on winter Cclimate over China. J Geogr Sci (2003) 13:208–16. doi:10.1007/bf02837460
15. Gong G., Entekhabi D., Cohen J., A Large-Ensemble Model Study of the Wintertime AO-NAO and the Role of Interannual Snow Perturbations. J Clim (2002) 15:3488–99. doi:10.1175/1520-0442(2002)015<3488:alemso>2.0.co;2
16. Feldstein S. B., The Dynamics of NAO Teleconnection Pattern Growth and Decay. Q.J.R Meteorol Soc (2003) 129:901–24. doi:10.1256/qj.02.76
17. Robertson A. W., Influence of Ocean-Atmosphere Interaction on the Arctic Oscillation in Two General Circulation Models. J Clim (2001) 14:3240–54. doi:10.1175/1520-0442(2001)014<3240:iooaio>2.0.co;2
18. Baker L. H., Shaffrey L. C., Sutton R. T., Weisheimer A., Scaife A. A., An Intercomparison of Skill and Overconfidence/Underconfidence of the Wintertime North Atlantic Oscillation in Multimodel Seasonal Forecasts. Geophys Res Lett (2018) 45:7808–17. doi:10.1029/2018gl078838
19. Müller WA., Appenzeller C., Schär C., Probabilistic Seasonal Prediction of the winter North Atlantic Oscillation and its Impact on Near Surface Temperature. Clim Dyn (2005) 24:213–26. doi:10.1007/s00382-004-0492-z
20. Johansson Å., Prediction Skill of the NAO and PNA from Daily to Seasonal Time Scales. J Clim (2007) 20:1957–75. doi:10.1175/jcli4072.1
21. Kim H. M., Webster P. J., Curry J. A., Seasonal Prediction Skill of ECMWF System 4 and NCEP CFSv2 Retrospective Forecast for the Northern Hemisphere Winter. Clim Dyn (2012) 39:2957–73. doi:10.1007/s00382-012-1364-6
22. Kang D., Lee M. I., Im J., Kim D., Kim H. M., Kang H. S, et al. Prediction of the Arctic Oscillation in Boreal winter by Dynamical Seasonal Forecasting Systems. Geophys Res Lett (2014) 41:3577–85. doi:10.1002/2014gl060011
23. Sun J., Ahn J. B., Dynamical Seasonal Predictability of the Arctic Oscillation Using a CGCM. Int J Climatol (2015) 35:1342–53. doi:10.1002/joc.4060
24. Rodwell M. J., Rowell D. P., Folland C. K., Oceanic Forcing of the Wintertime North Atlantic Oscillation and European Climate. Nature (1999) 398:320–3. doi:10.1038/18648
25. Robertson A. W., Mechoso C. R., Kim Y. J., The Influence of Atlantic Sea Surface Temperature Anomalies on the North Atlantic Oscillation. J Clim (2000) 13:122–38. doi:10.1175/1520-0442(2000)013<0122:tioass>2.0.co;2
26. Cohen J., Fletcher C., Improved Skill of Northern Hemisphere Winter Surface Temperature Predictions Based on Land-Atmosphere Fall Anomalies. J Clim (2007) 20:4118–32. doi:10.1175/jcli4241.1
27. Vitart F., Evolution of ECMWF Sub-seasonal Forecast Skill Scores. Q.J.R Meteorol Soc (2014) 140:1889–99. doi:10.1002/qj.2256
28. Zuo J., Ren H-L., Wu J., Nie Y., Li Q., Subseasonal Variability and Predictability of the Arctic Oscillation/North Atlantic Oscillation in BCC_AGCM2.2. Dyn Atmospheres Oceans (2016) 75:33–45. doi:10.1016/j.dynatmoce.2016.05.002
29. Baldwin M. P., Dunkerton T. J., Stratospheric Harbingers of Anomalous Weather Regimes. Science (2001) 80-294:581–4. doi:10.1126/science.1063315
30. Baldwin M. P., Stephenson D. B., Thompson D. W. J., Dunkerton T. J., Charlton A. J., O’Neill A., Stratospheric Memory and Skill of Extended-Range Weather Forecasts. Science (2003) 301:636–40. doi:10.1126/science.1087143
31. Ding S., Wu B., Chen W., Dominant Characteristics of Early Autumn Arctic Sea Ice Variability and its Impact on Winter Eurasian Climate. J Clim (2021) 34:1825–46. doi:10.1175/jcli-d-19-0834.1
32. Alexander M. A., Bhatt U. S., Walsh J. E., Timlin M. S., Miller J. S., Scott J. D., The Atmospheric Response to Realistic Arctic Sea Ice Anomalies in an AGCM during Winter. J Clim (2004) 17:890–905. doi:10.1175/1520-0442(2004)017<0890:tartra>2.0.co;2
33. Qiao S., Feng G., Impact of the December North Atlantic Oscillation on the Following February East Asian Trough. J Geophys Res Atmos (2016) 121:10,074–10.doi:10.1002/2016jd025007
34. Overland J. E., Wang M., Increased Variability in the Early Winter Subarctic North American Atmospheric Circulation*. J Clim (2015) 28:7297–305. doi:10.1175/jcli-d-15-0395.1
35. Wu T., Song L., Li W., Wang Z., Zhang H., Xin X., et al. An Overview of BCC Climate System Model Development and Application for Climate Change Studies. Acta Meteorol Sin (2014) 28:34–56. doi:10.1007/s13351-014-3041-7
36. Kalnay E., Kanamitsu M., Kistler R., Collins W., Deaven D., Gandin L., et al. The NCEP/NCAR 40-Year Reanalysis Project. Bull Amer Meteorol Soc. (1996) 77:437–71. doi:10.1175/1520-0477(1996)077<0437:tnyrp>2.0.co;2
37. Reynolds R. W., Rayner N. A., Smith T. M., Stokes D. C., Wang W., An Improved In Situ and Satellite SST Analysis for Climate. J Clim (2002) 15:1609–25. doi:10.1175/1520-0442(2002)015<1609:aiisas>2.0.co;2
38. Huang B., Banzon VF., Freeman E., Lawrimore J., Liu W., Peterson T. C, et al. Extended Reconstructed Sea Surface Temperature Version 4 (ERSST.V4). Part I: Upgrades and Intercomparisons. J Clim (2015) 28:911–30. doi:10.1175/jcli-d-14-00006.1
39. Kumar A., Hoerling M. P., Prospects and Limitations of Seasonal Atmospheric GCM Predictions. Bull Amer Meteorol Soc. (1995) 76:335–45. doi:10.1175/1520-0477(1995)076<0335:palosa>2.0.co;2
40. Zheng Z., Hu Z. Z., L’Heureux M., Predictable Components of ENSO Evolution in Real-Time Multi-Model Predictions. Sci Rep (2016) 6:35909. doi:10.1038/srep35909
41. Takaya K., Nakamura H., A Formulation of a Wave-Activity Flux for Stationary Rossby Waves on a Zonally Varying Basic Flow. Geophys Res Lett (1997) 24:2985–8. doi:10.1029/97gl03094
42. Cheung H. N., Zhou W., Mok H. Y., Wu M. C., Relationship between Ural-Siberian Blocking and the East Asian Winter Monsoon in Relation to the Arctic Oscillation and the El Niño-Southern Oscillation. J Clim (2012) 25:4242–57. doi:10.1175/jcli-d-11-00225.1
43. Miyakoda K., Gordon T., Caverly R., Stern W., Sirutis J., Bourke W., Simulation of a Blocking Event in January 1977. Mon Weather Rev (1983). 111, p. 846–69. doi:10.1175/1520-0493(1983)111<0846:soabei>2.0.co;2
44. Zhou S., Miller A. J., The Interaction of the Madden-Julian Oscillation and the Arctic Oscillation. J Clim (2005) 18:143–59. doi:10.1175/jcli3251.1
Keywords: The Arctic Oscillation, predictability, prediction skill, blocking, Arctic sea ice, interaction between stratosphere and troposphere
Citation: Zheng Z, Ban J and Li Y (2021) The Effect of the Arctic Oscillation on the Predictability of Mid-High Latitude Circulation in December. Front. Phys. 9:736085. doi: 10.3389/fphy.2021.736085
Received: 04 July 2021; Accepted: 08 September 2021;
Published: 23 September 2021.
Edited by:
Gui-Quan Sun, North University of China, ChinaReviewed by:
Feng Juan, Beijing Normal University, ChinaXuelei Feng, University Corporation for Atmospheric Research (UCAR), United States
Copyright © 2021 Zheng, Ban and Li. This is an open-access article distributed under the terms of the Creative Commons Attribution License (CC BY). The use, distribution or reproduction in other forums is permitted, provided the original author(s) and the copyright owner(s) are credited and that the original publication in this journal is cited, in accordance with accepted academic practice. No use, distribution or reproduction is permitted which does not comply with these terms.
*Correspondence: Jin Ban, YmFuamluY3lAMTYzLmNvbQ==