 Zhaoxing Li
 Qionghai Liu3
95% of researchers rate our articles as excellent or good
Learn more about the work of our research integrity team to safeguard the quality of each article we publish.
Find out more
ORIGINAL RESEARCH article
Front. Phys. , 10 August 2021
Sec. Social Physics
Volume 9 - 2021 | https://doi.org/10.3389/fphy.2021.735998
This article is part of the Research Topic Data-driven Modeling and Optimization: Applications to Social Computing View all 25 articles
A complex network can crash down due to disturbances which significantly reduce the network’s robustness. It is of great significance to study on how to improve the robustness of complex networks. In the literature, the network rewire mechanism is one of the most widely adopted methods to improve the robustness of a given network. Existing network rewire mechanism improves the robustness of a given network by re-connecting its nodes but keeping the total number of edges or by adding more edges to the given network. In this work we propose a novel yet efficient network rewire mechanism which is based on multiobjective optimization. The proposed rewire mechanism simultaneously optimizes two objective functions, i.e., maximizing network robustness and minimizing edge rewire operations. We further develop a multiobjective discrete partite swarm optimization algorithm to solve the proposed mechanism. Compared to existing network rewire mechanisms, the developed mechanism has two advantages. First, the proposed mechanism does not require specific constraints on the rewire mechanism to the studied network, which makes it more feasible for applications. Second, the proposed mechanism can suggest a set of network rewire choices each of which can improve the robustness of a given network, which makes it be more helpful for decision makings. To validate the effectiveness of the proposed mechanism, we carry out experiments on computer-generated Erdős–Rényi and scale-free networks, as well as real-world complex networks. The results demonstrate that for each tested network, the proposed multiobjective optimization based edge rewire mechanism can recommend a set of edge rewire solutions to improve its robustness.
In our daily life, complex networks are ubiquitous [1–3]. We rely on diverse kinds of complex networks as they play a very important role in our lives [4–6]. For example, we rely on transportation networks to travel around the world, while we count on power grid networks to provide power supplies to ensure social productions and lives [7]. Complex networks are so important to us. However, complex networks in real-world often suffer from unpredictable disturbances such as random component failures and/or target attacks [8,9]. Those disturbances can lead to the dysfunction of network components [10]. Because the components of a network generally interact with each other, therefore the dysfunction of some components can trigger the dysfunction of other components and system-level disasters even can appear. It is therefore of great scientific and social values to ensure the stabilities and reliabilities of complex networks [11,12].
Up to now, scientists have developed many ways to quantify stabilities and reliabilities of complex networks [13,14]. One of the most effective ways is based on network robustness analysis [15]. The robustness of a network quantifies the capability of the network to survive disturbances. Scientists in the past decade have carried out many studies on network robustness. The majority of existing studies on network robustness of based on graph theories [16,17]. A graph is a straightforward yet effective modelling of a complex network. The nodes of a graph are the entities of a complex network, while the edges of the graph represent the interactions among the entities. Existing studies on network robustness can be roughly grouped into two classes. The first class aims to develop quantitative metrics to measure the robustness of a given network. The second class is dedicated to investigating models and theories to improve the robustness of a given network.
Regarding network robustness quantification, one of the most studied methods is the percolation theories [18,19]. Suppose that 1 − p portion of the nodes of a network lose their functionalities due to disturbances. Then the purpose of percolation theories is to mathematically calculate the remaining portion of nodes. Such kind of percolation theories are termed as site percolation [4]. Note that the remaining portion of nodes is no higher than p since the dysfunction of some nodes can lead to the dysfunction of other nodes that rely on those initially failed nodes. Because the dysfunction can be happened to the edges of a network, the corresponding percolation theories are deemed as bond percolation [4]. It has been widely reported that many complex networks show community structures [20]. A network community is commonly regarded as a subnetwork of a given network and the similarities between nodes within the community are high while similarities between communities are low. For a network with community structure, when some of its components are failed, then those failed components will first affect components in their own communities. Therefore, some researchers also investigate the robustness of complex networks to component failures at a mix-level. For example, the work in [21] for the first time investigated the robustness of ecological networks to the species loss of community. Interestingly, they discovered that the community-level robustness of ecological networks has positive correlation with that of node-level robustness.
Percolation theories provide a way to measure the robustness of complex networks. Another challenging question is how to improve the robustness of complex networks. For real-world applications, the back-up mechanism is widely used [16]. Literally, the back-up mechanism improves the robustness of a network by backing up its critical components. Note that to back-up a network component needs extra resources and sometimes it is not easy to do that. For example, it may be difficult to back up a power station due to physical connection issues. Consequently, scientists have developed another effective way, i.e., network rewire mechanism, to improve the robustness of complex networks [22,23]. A network rewire mechanism changes the connections between the nodes of a network so as to improve its robustness. Generally, a rewire mechanism is subject to the constraint that the total number of edges is fixed. However, some researchers propose to discard this constraint when design network rewire mechanisms [24].
Network rewire mechanisms have been proved to be very effective for improving network robustness. However, existing network rewire mechanisms have two major drawbacks. The first one is that a rewire mechanism normally generates a robust network whose structure is quite different from its original one. This drawback makes existing rewire mechanisms hard to be applied to real situations. The second one is that existing rewire mechanisms can only generate single solutions which is not intelligent for smart and personalized decision making.
In order to overcome those two drawbacks mentioned above, in this paper we suggest a novel network rewire mechanism for improving network robustness. Specifically, we propose a multiobjective optimization based network rewire mechanism. The proposed mechanism simultaneously optimizes two objectives. The first objective is to maximize the network robustness. This objective makes sure that a feasible network rewire solution definitely increase the robustness of the studied network. The second objective is to minimize the number of network rewire operations. This objective ensures that a feasible network rewire solution can improve the robustness of the studied network by implementing as small number of rewire operations as possible, making the proposed network rewire mechanism be of practical use. In order to solve the optimization based model, we further develop a multiobjective particle swarm optimization algorithm. Each time we run the developed algorithm, the algorithm can generate a set of solutions. Each solution denotes a network rewire choice with which the robustness of the studied network can be improved. Compared to existing network rewire mechanisms, the newly proposed network rewire mechanism better facilitates decision making. In order to validate the effectiveness of the proposed mechanism, we carry out experiments on Erdős–Rényi and scale-free networks that are generated using computer models. We also carry out experiments on several real-world complex networks. Experiments demonstrate that the proposed optimization-based network rewire mechanism can provide many different choices to improve the robustness of the tested networks. For real-world applications, one may analyze the detailed properties of the given network and decide which choices can be chosen to improve the network’s robustness.
The remainder of this paper is organized as follows. Section 2 presents preliminaries for better understanding of this work. Section 3 formulates the proposed research problem and Section 4 delineates the designed algorithm to solve the proposed problem. Section 5 demonstrates the experiments and Section 6 concludes the paper.
A complex network is usually represented by a graph. A graph consists of nodes and edges. In the literature, a node also can be called a vertex while an edge can be called a link. Mathematically, a graph is generally denoted by G = {V, E}. In this kind of notation, the symbol V represents the node set and the symbol E represents the edge set. The nodes of a graph represent the entities of a network that the graph models, while the edges represent the relationships between the entities.
The relationships between the nodes of a graph can be depicted using its adjacency matrix which is usually denoted by A. Figure 1 shows an example of a simple network together with its corresponding adjacency matrix.
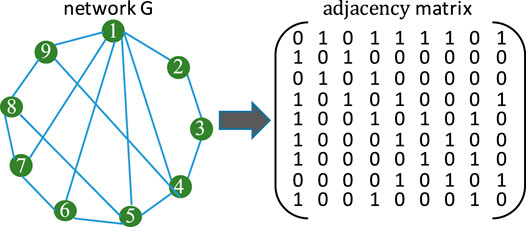
FIGURE 1. An example of a simple network together with its corresponding adjacency matrix.
For the graph G shown in Figure 1 with n = 9 nodes, its adjacency matrix is normally with size n × n. The element of A is usually denoted by aij, representing the relationship between nodes i and j. Note that the value of aij is problem-specific. For a binary network with aij ∈ {1, 0}, the element aij only represents whether there is connection between nodes i and j.
A network rewire mechanism is usually used in the network science domain. For a given network G, a network rewire mechanism aims to generate a new network G′. Figure 2 shows an example of a simple network rewire mechanism.
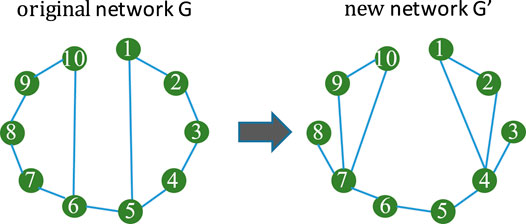
FIGURE 2. An example of a simple network rewire mechanism.
In Figure 2, the original network has 10 nodes and 11 edges. After adopting a simple rewire mechanism, network G has been changed into network G′. It can be seen from the figure that the network rewire mechanism just changes the edge connections between the nodes and does not change the total number of edges of the original network.
Many real-world problems can be reformulated as optimization problems. Because real-world problems could be very difficult, therefore when turning a real-world problem into an optimization problem, the optimization formula may not have mathematical properties like gradient. In this case, mathematical methods cannot solve such kind of optimization problems.
In order to solve optimization problems that cannot be solving using traditional mathematical methods, scientists have developed the so called bio-inspired algorithms [25,26] and amongst which is the particle swarm optimization algorithm (PSO) [27–29].
Suppose that one aims to maximize a function f(x) with x being the argument by using PSO. Then a PSO algorithm works with a swarm or a population of individuals. Each individual is a feasible solution x to the optimized problem f(x). Let us use pi to denote the ith population and xj ∈pi to denote the jth individual in pi. Then a PSO algorithm iteratively evolves pi to approximate the optimal solutions to f(x). During each iteration, the algorithm updates individual xj in the following way:
where vj is the velocity of individual xj. The velocity vj is calculated as follows
where w, c1 and c2 are three constants. r1 and r2 are two random number with r1, r2 ∈ [0, 1]. The symbol Lj is the personally best individual of xj, i.e., the best solution that individual xj has so far found. The symbol G is the globally best individual found by all the individuals.
Note that an individual updates its velocity vj by referring to its historical information and the information from the whole population. The new velocity vj then could help individual xj to explore to promising area. During each iteration, the algorithm updates Lj and G. By iteratively evolving pi for a prescribed number of iteration, the algorithm stops and G therefore is regarded as the optimal solution(s) to the original optimization problem.
The research aims to enhance the robustness of a given network by proposing a novel network rewire mechanism. To do so, first we need to know how to quantify the robustness of a given network. In the literature, there are many studies on network robustness [16,30]. As a consequence, many methods have been developed by scientists to quantify the robustness of complex networks [13,31] and amongst which is the method based on spectral analysis [31].
Given a network G with its adjacency matrix being denoted by A. Let us use di to represent the degree of node i, i.e., the number of edges attached to i. Then one can easily obtain a diagonal matrix D in which its ith element is di. In the literature, the Laplacian matrix L of network G is defined as
For the matrix L we can work out all its eigenvalues λ. An eigenvalue λ satisfies the following relation
in which x is the corresponding eigenvector. Let λ2 ∈ λ be the second smallest non-negative eigenvalue of matrix L. It has been found that λ2 has a positive relationship with the network’s connectivity [31]. As a consequence, in the literature scientists use it as a metric to quantify the network’s robustness. Due to its computationally friendly feature, in this study we use λ2 as the network robustness quantification metric. Normally, the larger the value of λ2, the more robust the given network.
In this work, we propose a new network rewire mechanism to enhance the robustness of a given complex network. Figure 3 takes a simple network as an example to show the basic idea of the proposed network rewire mechanism.
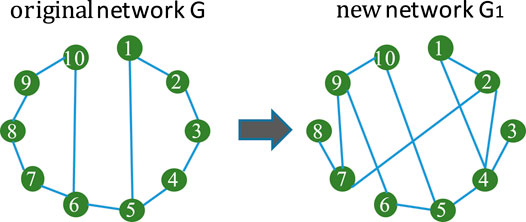
FIGURE 3. The basic idea of the proposed network rewire mechanism to enhance the robustness of a given complex network. In the proposed rewire mechanism, both edge additions and deletions are allowed without extra constrains.
On the left hand side of Figure 3 is a simple network G0 with 10 nodes. The network G0 originally carries with 11 edges. In order to enhance its robustness, existing rewire mechanisms change the edge connections. Specifically, they reconnect the nodes and aim to find out a new network G1 with exactly the same number of edges and higher network robustness.
In this work we propose a novel rewire mechanism as shown on the right hand side of Figure 3. The proposed mechanism does not require that G1 has exactly the same number of G. As can be seen from the right hand side of Figure 3, we delete some edges from G. We also add new edges between the nodes. As long as G1 has higher network robustness than G, then we can both delete edges from and add new ones to G. As compared to existing rewire mechanisms, the newly proposed mechanism is more flexible and could be more of practical usage.
Note that for a given network there are many choices for edge deletion and addition. In order to determine which edges can be deleted and added, we propose a multiobjective optimization model which will be described in detail in the subsequent subsection.
For a given network G we adopt the λ2 metric to quantify its robustness. The proposed network rewire mechanism aims to enhance G’s robustness by removing and adding edges. Specifically, we propose the following multiobjective optimization model.
in which
In the above model, objective f1 aims to maximize the robustness of G1. Both objectives f2 and f3 aim to minimize the edge operations. For a network in reality, it is not good to remove a large amount of edges from the network as it will change the network’s structure a lot. Objective f2 then constraints this operation. Similarly, it is not practical to add a large amount of edges to the network as adding new edges needs extra workload. Objective f3 is such a constraint to avoid this behaviour.
Note that existing rewire mechanisms also do edge addition and removal, i.e., they consider both objectives f2 and f3. However, they require to remain the total number of edges in the network, i.e., they require that f2 = f3. In the newly proposed rewire mechanism, we do not pose such constraints. As a consequence, the proposed mechanism is of more practical use. For networks in which adding edges is more convenient than that of deleting edges, then we can minimize f2 but relax f3. Similarly, if deleting edges is much easier than adding new ones, then we can pay more attention to f3.
One may clearly see from Eq. 5 that the proposed optimization model does not have a direct relationship between the decision variable (E+ and E−) and the objective function values. A concrete solution of E+ and E− cannot directly be substituted into the calculation of f1. Meanwhile, E+ and E− are edge sets.
The proposed model contains three objectives. In order to solve it, traditional mathematical methods will apply weighted sum method to do it. However, since the edge sets are composed of links, therefore mathematical methods cannot solve Eq. 5 as the decision variables are discrete and the objectives do not have any gradient information. Because the proposed optimization model given in Eq. 5 involves three discrete objectives, in the literature, scientists have developed nature-inspired algorithms such as genetic algorithms (GAs) [32], particle swarm optimization algorithms (PSOs) [33], etc., to solve such kind of problems. Both GAs and PSOs are designed for single objective optimization. In order to solve multiobjective optimization, representative algorithms like the non-dominated sorting genetic algorithm-version II (NSGA-II) [34], multiobjective particle swarm optimization (MOPSO) [35], multiobjective evolutionary algorithm based on decomposition (MOEA/D) [36], etc., have been developed by scientists and been applied to solve many engineering problems.
In order to solve the model shown in Eq. 5, we in this work adopt the MOPSO algorithm proposed in [27]. The MOPSO algorithm is chosen because of its simplicity in terms of algorithm understanding and implementation. We redesign some operators of the MOPSO algorithm to make it fit for the model in Eq. 5. The whole algorithm framework for solve Eq. 5 is given in Algorithm 1.
Step 4 of Algorithm 1 involves the individual representation method which will be described in the following subsection. Step 7a of Algorithm 1 evaluates a particle based on the proposed multiobjective optimization model. Step 10 of Algorithm 1 is the main for loop which mainly contains the particles’ position and velocity information update and this will be described in the following subsection. Note that the details for generating a testing network will be provided in the experiment section and all the parameter settings will also be given in the experiment section.
The algorithm proposed in [27] is for network clustering. The authors therefore developed an integer based particle position representation method. Since in this work we aim to do network rewire to enhance network robustness, we thus need to reconsider the way to represent a particle position.
Keep in mind that the purpose of the work is to find out the edge sets E+ and E− so as to improve the robustness of a given network. For a given network G, we know its adjacency matrix A and its edge set E. We then can remove edges from E and E− can be determined. Based on matrix A, we also know the possible new edges between the nodes and therefore can determine E+. Considering this, we thus propose the following way to represent the position of the ith particle of a PSO algorithm.
In Eq. 6, xij ∈xi is a binary variable, i.e., xij ∈ {0, 1}. The length of xi is m and m = n × (n − 1)/2. Figure 4 takes a simple network as an example to show how Eq. 6 works.
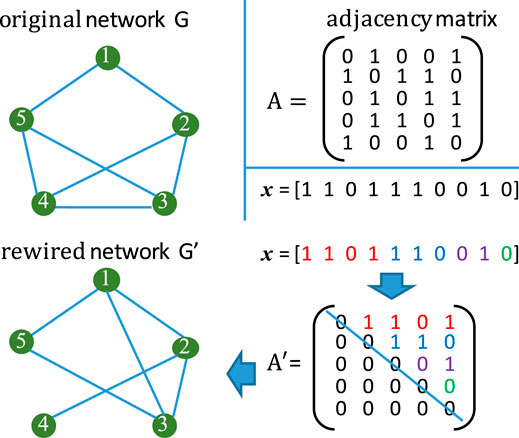
FIGURE 4. An illustration of a simple network and a possible representation of a particle position.
In Figure 4, the simple network G has five nodes and seven edges. Its adjacency matrix is given as A. In the figure there is a binary sequence x which represents a particle’s position. This binary sequence represents a possible edge rewire solution. We first set up an empty matrix A′. Then we turn the binary sequence x into the elements of the upper triangle matrix of matrix A′. The upper triangle matrix then represents the new edge connection relationship and corresponds to the new network G′.
As mentioned earlier, the purpose of this work is to find E+ and E−. So the most straightforward way is to represent xi as an adjacency matrix A′. Based on the difference between A and A′ we can easily work out E+ and E− and therefore can calculate the values of the objective functions. However, this kind of representation requires too much computer memories when n is very big. As can be seen from Figure 4, the proposed representation mechanism can reduce the memory size by more than half.
How to represent the velocity of a particle is related to the way how the position of the particle is represented, since the velocity vector help a partite to update its position information. As compared to the matrix representation method, the proposed particle position representation method is more convenient for the velocity representation.
Since in this work we propose to encode the edges in the upper triangle of the adjacency matrix of a given network using binary coding schema, therefore we decide to use binary representation of the velocity vector of a given particle. Specifically, for a given velocity vector vi = (vi1, vi2, … , vim) corresponding to particle xi, its element vij ∈ {0, 1}. The element vij represents whether the jth element in the vector xi will be changed or not.
For the ith particle with xi being its position vector, we update its position information with the following equation
in which the operator ⊕ defines the operation for xi’ as follows
The velocity vector vi′ of the ith particle is updated as follows
in which the speed vector v is calculated as
where Gr ∈G is a solution randomly chosen from the global best solution set G and the symbol S () is a confining function which maps vector v into vi′. Specifically, S () works as follows
It can be seen from the above equations that v is a real valued vector. By implementing the S () operation we turn v into a binary vector based on which we thus can update the particle’s position information. Note that other functions also can be adopted to replace the S () function. However, there is no guarantee that other functions would perform better than the S () function does. The S () function is adopted because it is smooth in the objective space.
Note that PSO is a population based algorithm. During the iterations we need to update the information of the local best individual Li for all i ∈ [1, psize] and the global best individual G since they help the entire swarm to explore for better solutions. Algorithm 2 presents the pseudocode for updating the local and global best particles in the adopted MOPSO algorithm.
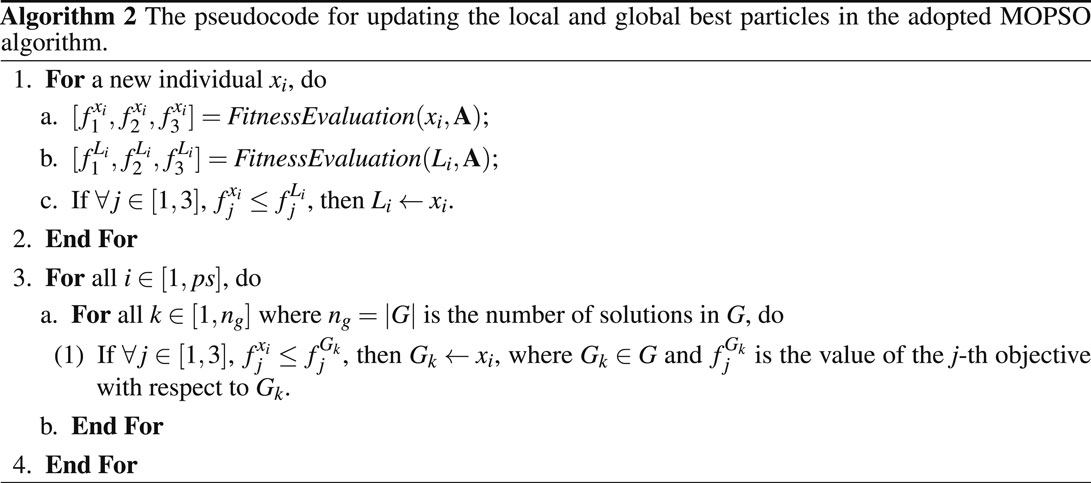
As can be seen from Algorithm 2, during each iteration, when a new individual xi is generated, we then evaluate its fitness. If xi dominates its historical best Li (step 1c of Algorithm 2), then we replace Li with xi, otherwise, we keep Li as it is. When a new population of individuals are generated, we then update G. Specifically, we use the Pareto solutions obtained from the current population to update those in the history. When any of the new Pareto solutions dominate any historical Pareto solutions, we then replace the old solutions with the new one (step 3 of Algorithm 2).
In the experiments we first test the proposed edge rewire mechanism on computer-generated networks. Specifically, we generate two types of networks, i,e., Erdős–Rényi networks and scale-free networks. The degree of an Erdős–Rényi follows Poisson distribution while the degree of a scale-free network follows power law distribution.
In order to generate an Erdős–Rényi network with n nodes, we first generate an empty network GER with n nodes. We then define a constant d. Then we further define the connection probability r as r = d/n. Then we connect each pair of nodes of GER with probability r. We have proved in our previous paper in [8] that the generated network appropriately follows the following degree distribution
The network GER therefore is an Erdős–Rényi network since its degree distribution follows the Poisson distribution and the average degree of GER is d. Figure 5 shows the degree distribution and the corresponding curve fitting of an example Erdős–Rényi network generated using the above mentioned method.
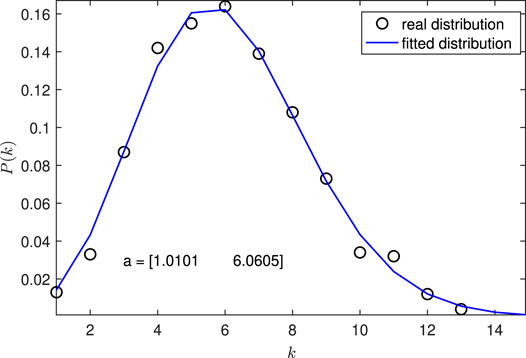
FIGURE 5. Degree distribution of a randomly generated Erdős–Rényi network (n = 1000, d = 6). The function
In Figure 5, the Erdős–Rényi network is generated with n = 1000 and d = 6. A Poisson distribution function
In order to generate a scale-free network with n nodes, we first determine the exponent λ in the degree distribution function p(k) = ck−λ with k being the nodes degree and c being a constant. We then determine the largest degree kmax and the smallest degree kmin. Based on the three parameters λ, kmax and kmin we then solve the following equation
By solving the above equation we then work out the constant c. With all the above, we then sample a degree sequence k = (k1, k2, … , kn) from the degree distribution function p(k) = ck−λ. Then we use the method proposed in [37] to work out networks GSF whose has exactly the sampled degree sequence k.
In Figure 6, the scale-free network is generated with n = 100, λ = 2.4, kmin = 1, and kmin = 10. A power-law distribution function
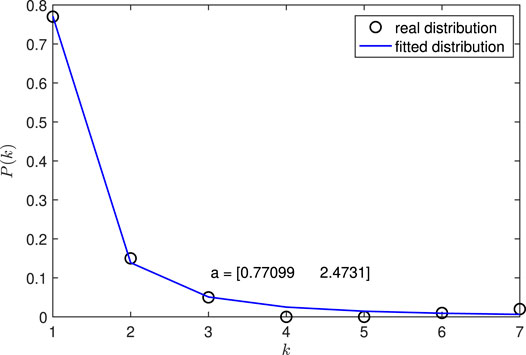
FIGURE 6. Degree distribution of a randomly generated scale-free network (n = 100, λ = 2.4, kmin = 1, kmin = 10). The function
Apart from the computer-generated networks, in the experiments we also test the proposed edge rewire mechanism on several real-world networks. Specifically, the following networks chosen from the survey paper in [20] are tested.
This network contains 34 nodes and 78 edges. It depicts the relationships between 34 members with the Karate club. The edges represent the relationships among the members. The structure of the Karate network is shown in Figure 7A.
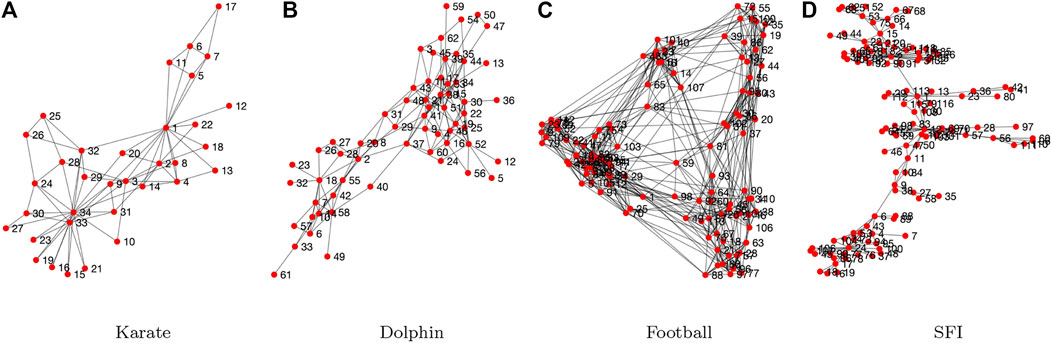
FIGURE 7. Network structure visualization of (A) the Karate network, (B) the dolphin network, (C) the Football network and (D) the SFI network.
The dolphin network contains 62 nodes each of which represents a bottlenose dolphin. Three are 159 edges in the network. The edges are built based on statistically significant frequent association, i.e., their social behaviours. The structure of the Dolphin network is shown in Figure 7B.
The football network represents the American football games between Division IA colleges during regular season Fall 2,000. The football network contains 115 nodes each of which represents a college. Three are 613 edges in the network. An edge is built between two nodes if the corresponding colleges have a game. The structure of the Football network is shown in Figure 7C.
The SFI network represents the collaborations between the scientists working with Santa Fe Institute during any part of calendar year 1999 or 2000. The SFI network contains 118 nodes and 200 edges. The structure of the SFI network is shown in Figure 7D.
Figure 7 visualizes the structures of the four tested real-world networks. These four networks are chosen because they have been widely used in the network science domain. Note that the four real-world networks are unweighted, i.e., they are binary networks. In the experiments, we only test the proposed mechanism on small-scale networks. On the one hand, the proposed mechanism can be tested on large-scale networks. On the other hand, testing on large-scale network is time consuming as the adopted PSO algorithm is a population based random search algorithm. As the main purpose of this work is to validate the feasibility of the proposed mechanism, therefore we do not carry out experiments on large-scale networks at the moment.
As mentioned above, when generating the networks we need to determine some parameters first. Meanwhile, for the introduced algorithm it also carries with several parameters. In the experiments, we set all the needed parameters as what are shown in Table 1.
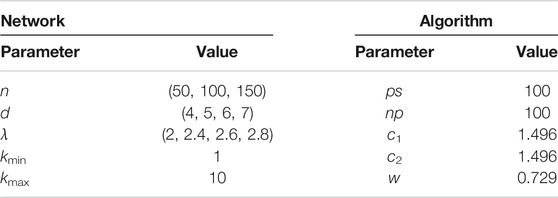
TABLE 1. Settings of the parameters contained in the algorithm and the generated networks for testing.
Note that the main idea of this work is to validate if the proposed optimization based edge rewire mechanism is effective or not. Therefore, we do not set the value of n large enough. For a network with n nodes, there are maximum n × (n − 1)/2 edges. If n is too large, then the optimization process will take a long time to finish. In the experiments we set it to be small so as to quickly check if the proposed idea is feasible or not. This is the main reason why the tested real-world networks are small in size.
In the experiments, we generate two types of artificial networks. For each type of networks, we generate 12 networks with the configurations of the number of nodes and the degree control parameter, i.e., d for the Erdős–Rényi network and λ for the scale-free network. Figure 8 and Figure 9 respectively visualize the Pareto fronts obtained by the introduced multiobjective particle swarm optimization algorithm when tested on the Erdős–Rényi and scale-free networks. Note that for each tested network we run the introduced multiobjective particle swarm optimization algorithm for 20 times. After each run we save the Pareto solutions. We eventually merge all the Pareto solutions over the 20 runs and filter out the final Pareto solutions based on Pareto dominance mechanism.
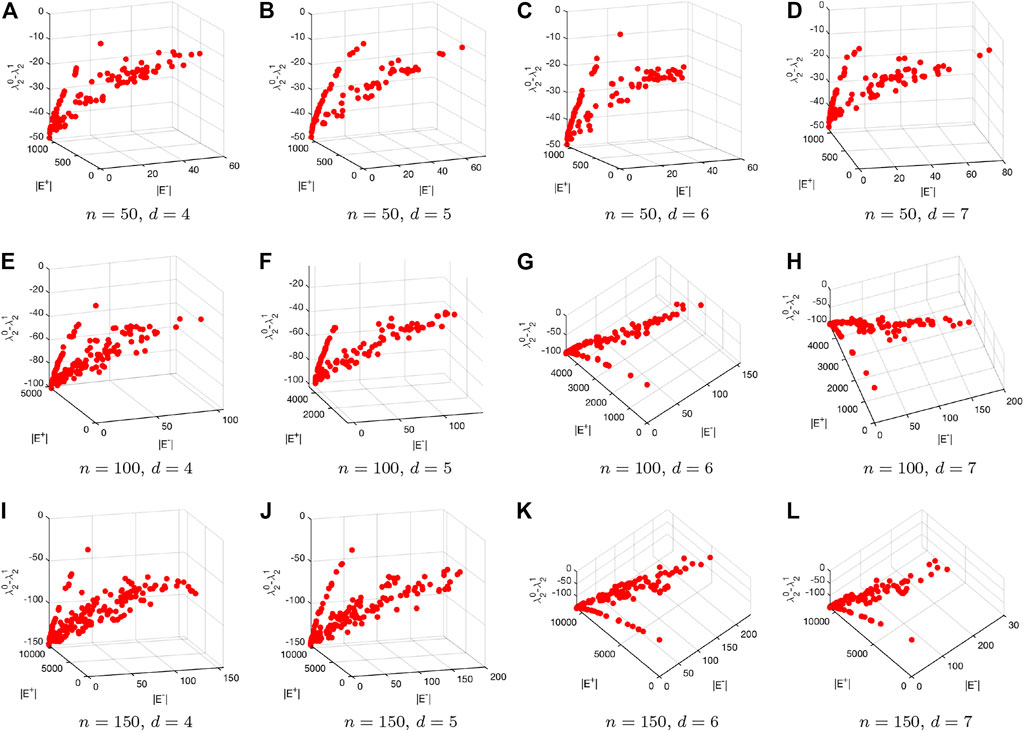
FIGURE 8. Visualization of the Pareto fronts obtained by applying the introduced multiobjective particle swarm optimization algorithm to the generated Erdős–Rényi networks.
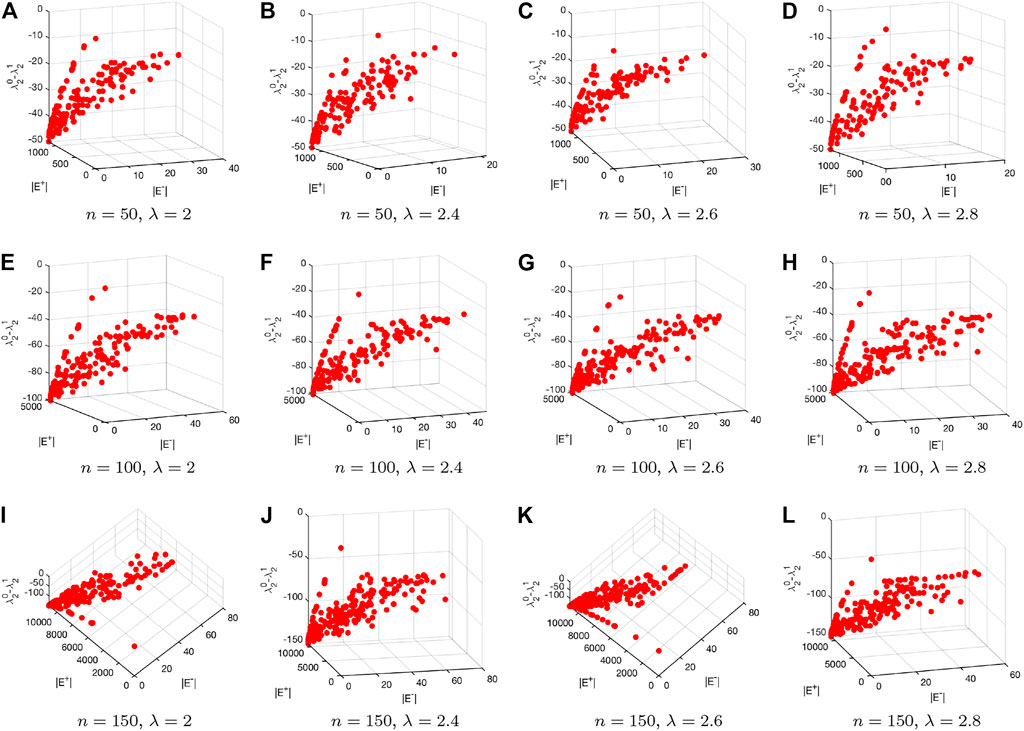
FIGURE 9. Visualization of the Pareto fronts obtained by applying the introduced multiobjective particle swarm optimization algorithm to the generated scale-free networks.
Both in Figure 8 and Figure 9 each row represents the results for networks with different sizes. In Figure 8, each column corresponds to different d, while each column in Figure 9 corresponds to different λ. We can clearly see from those two figures that the values of f1 for all the solutions are negative. This means that the robustness of the original networks have being improved based on the corresponding edge rewire mechanism. One may further see from the figures that the proposed multiobjective optimization based edge rewire mechanism can yield many different solutions to improve the robustness of a given network. Actually, this is one of the biggest advantages of the proposed edge rewire mechanism as compared to existing ones which can only provide single solutions for the decision makers. As can be seen from the two figures, each solution corresponds to edge deletions and additions but the number of added edges does not need to be equal to that of the deleted edges, which makes the proposed mechanism more flexible for real use.
The above experiments are carried out on Erdős–Rényi networks and scale-free networks which are two important types of networks. In the next, we show the results on the four real-world networks. Figure 10 visualizes of the Pareto fronts obtained by the introduced algorithm when tested on the four networks.
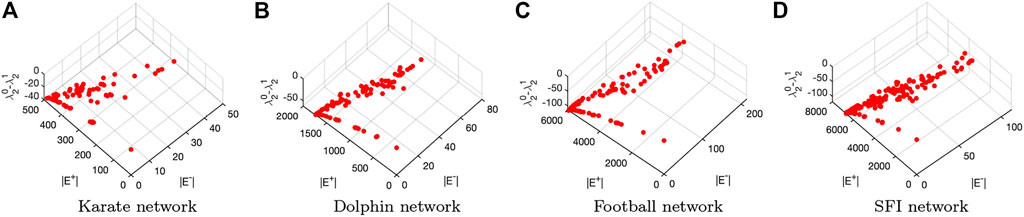
FIGURE 10. Visualization of the Pareto fronts obtained by applying the introduced multiobjective particle swarm optimization algorithm to (A) the Karate network, (B) the dolphin network, (C) the Football network and (D) the SFI network.
It also can be seen from Figure 10 similar phenomenon occurs to the tested real-world networks as compared to that of the computer-generated networks. More specifically, there are multiple Pareto solutions for improving the robustness of each of the tested real-world networks. The above experiments prove that the proposed edge rewire mechanism can reconnect those tested networks to improve their network robustness. In what follows, we analyze the robustness of the enhanced networks with respect to the obtained Pareto solutions.
The above experiments indicate that the proposed multiobjective optimization based edge rewire mechanism can help to improve the robustness of a given network. Note that by optimizing the proposed mechanism, a set of rewire solutions can be obtained. In this section we analyze the robustness improvement of two extreme solutions for each tested network.
As can be seen from Figures 8–10, the Pareto front for each network contains a set of solutions. Here, we choose two extreme solutions from each Pareto front. For all the solutions, we sum up f2 and f3. Then we choose the two extreme solutions as the two solutions that require the minimum number of edge operations including addition and deletion. We then calculate the ratio of robustness improvement. The results for all the tested artificial networks are shown in Table 2.

TABLE 2. Robustness improvement made by the two selected extreme solutions from the Pareto front for each of the tested Erdős–Rényi (ER) and scale-free (SF) networks.
In Table 2, the robustness improvement is calculated as
From Table 2 we also notice that the robustness improvement for scale-free networks are more significant than that of Erdős–Rényi networks. This is because that a scale-free network has relatively less edges than an Erdős–Rényi network with the same number of nodes. Consequently, the proposed edge rewire mechanism can work better for improving the robustness of scale-free networks.
Table 3 records the robustness of the tested four real-world networks (recorded by
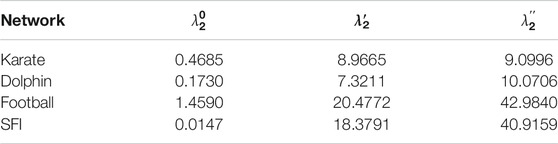
TABLE 3. Robustness of the real-world networks and their optimized networks with respect to the two selected extreme solutions from the Pareto fronts.
Tables 2, 3 show that the robustness of the tested networks have been greatly improved. In this section we graphically visualize the optimized structures of the networks against the original ones. For simplicity, here we only visualize the structures of Erdős–Rényi networks for d = 4 and scale-free networks for λ = 2.
Figures 11, 12 respectively visualize the original network structures (first column) and the optimized networks structures (second and third columns) for Erdős–Rényi networks for d = 4 and scale-free networks for λ = 2. We can see from Figures 11, 12 that the proposed edge rewire mechanism makes a given network have more edges to improve its robustness. As compared to Erdős–Rényi networks, the optimized scale-free networks seem to be much denser than their original networks. As explained earlier, this is because that a scale-free network has relatively less edges than a same sized Erdős–Rényi network.
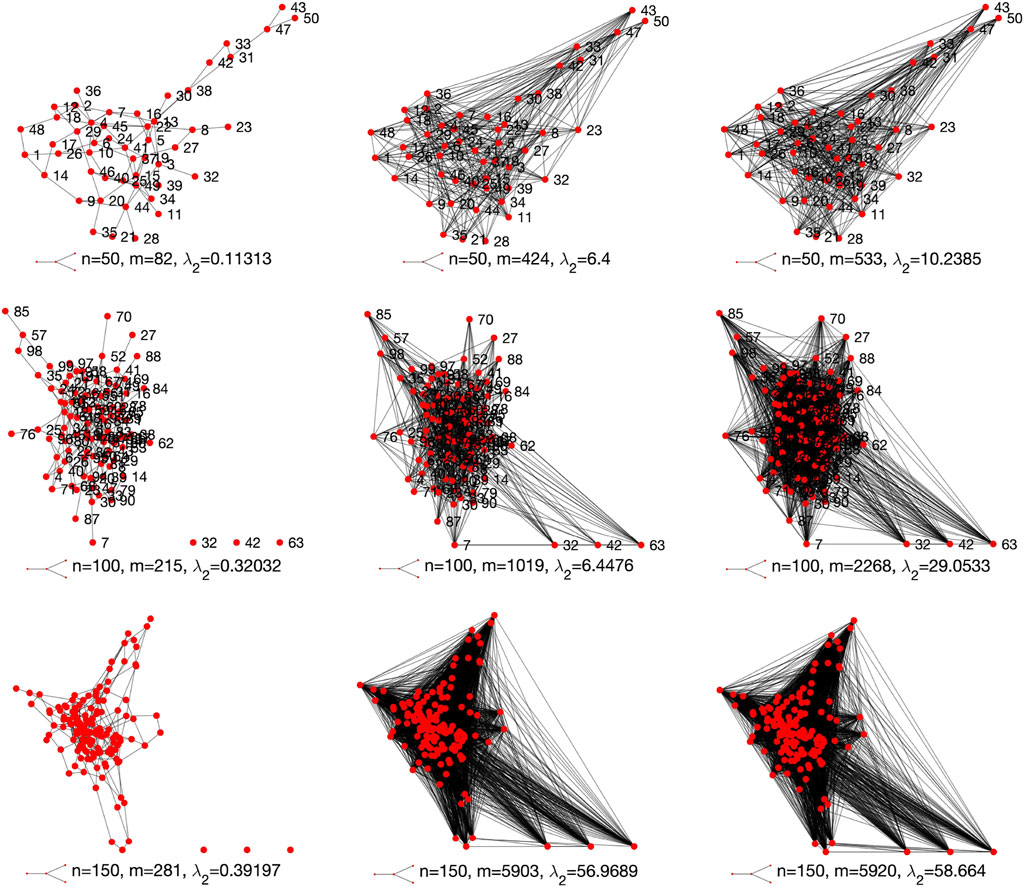
FIGURE 11. Original (first column) and optimized structures (second and third columns) of the Erdős–Rényi networks for d = 4.
FIGURE 12. Original (first column) and optimized structures (second and third columns) the scale-free networks for λ = 2.
Figure 13 visualizes the original network structures (first row) and the optimized networks structures (second and third rows) for the four tested real-world networks. It can be clearly seen from Figures 11–13 that the selected two solutions suggest to add more links to each of the tested network to improve its network robustness.
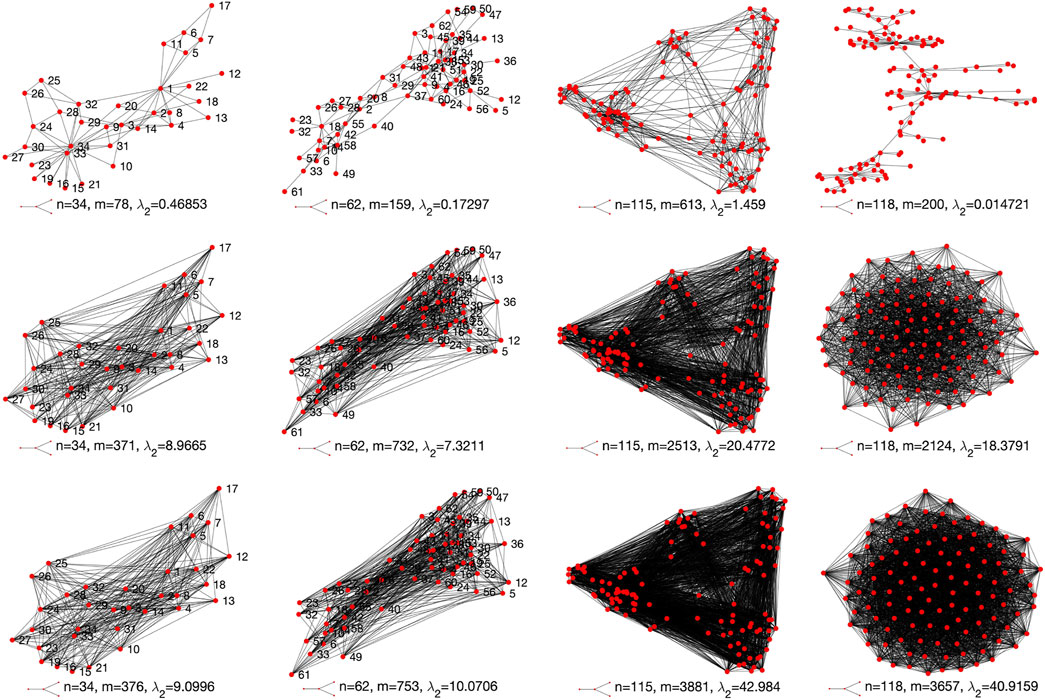
FIGURE 13. Original (first row) and optimized structures (second and third rows) of the four tested real-world networks.
One may notice from Figures 11–13 that the proposed edge rewire mechanism tends to make a given network be denser in order to improve its robustness. This is not necessarily the feature of the proposed model. Actually, the proposed multiobjective optimization based rewire mechanism is very flexible. Note that in the proposed model we do not add in any constraints. We do not limit the number of deleted and added edges. As long as the edge operations can improve the robustness of a given network, then the multiobjective optimization algorithm will determine the goodness of the edge operations based on Pareto dominance mechanism. If the operations are non-dominated with each other, then those operations will be saved as the possible choices.
Note that in the experiments for a tested network, its number of edges is far less than that of the maximum number of edges it can has. This is especially true for the tested scale-free networks. A scale-free network is normally sparse in its connections. Therefore there could be many choices to improve its robustness. In order to avoid making a network be denser, we provide below some possible solutions.
1) One may consider to increase the population size of the particle swarm optimization algorithm and run it for more than 20 times to possibly obtain more Pareto solutions. Then one may expect to select Pareto solutions that do not make many edge reconnections. It is also suggested that one can try to redesign the algorithm operators especially the status update principles for the particle swarm optimization algorithm.
2) One may add extra constraints. For example, one can set the portion of maximum edge operations, i.e., instead of considering all the possible edges, one can just predefine the maximum number of edges allowed in a given network. For example, for a network with n nodes and m edges, it can have a maximum of n (n − 1)/2 edges. Then one may add the constrain of f2 + f3 < αn (n − 1)/2 in which α ∈ (0, 1) is a control parameter.
3) For real applications, one may also consider the cost on the edge operations. For some networks, adding edges could be more costly than deleting edges, while the situation can be the opposite for some networks. Therefore, instead of directly using objectives f2 and f3, one can design other cost functions. A straightforward way to achieve this goal is to punish the two objectives with different coefficients. For example, one can consider the objectives βf2 and (1 − β)f3 with β ∈ [0, 1].
The study on network robustness has attracted much attention in the past decade. In reality many complex networks will more or less suffer from external attacks. Those attacks to a network can lead to the failure of network nodes and edges. When some nodes and/or edges fail, the corresponding network could totally fail, which could bring about enormous losses. Network robustness estimates a network’s ability to bear with attacks. To do research on network robustness can help the better design of network structures to improve their robustness.
In order to enhance the robustness of a complex network, in the literature one of the most effective ways is the network rewire mechanism which changes the edge connections between the nodes so as to improve the network’s robustness. In this work we adopted spectral analysis to measure the robustness of a given network. We then proposed a multiobjective optimization based network rewire mechanism to enhance network robustness. The proposed edge rewire mechanism optimizes three objectives. The first one is the robustness improvement. The second one is to minimize edge deletions and the third is to minimize edge additions. To optimize the proposed mechanism, we further develop a multiobjective discrete partite swarm optimization algorithm to solve the proposed mechanism. Compared to traditional network rewire mechanism, the developed mechanism can generate a set of network rewire choices each of which can improve the robustness of a given network. To validate the effectiveness of the proposed mechanism, we carried out simulations on computer-generated Erdős–Rényi and scale-free networks as well as real-world networks. Experiments have validated the effectiveness of the proposed edge rewire mechanism.
Publicly available datasets were analyzed in this study. This data can be found here: http://www-personal.umich.edu/∼mejn/netdata/.
ZL—Conceptualization, Methodology, Writing-Original draft preparation. ZL and QL—Data generating and collection. ZL, QL, and LC—experiments and discussions, ZL, QL, and LC—Writing—Reviewing and Editing.
This work was supported by the Shanxi Provincial Key Research and Development Project (Grant No. 2020NY-176), the Science Project of Yulin High Tech Zone (Grant No. CXY-2020-32), and the Doctoral Research Startup Fund of Yulin University (Grant No. 16GK25).
The authors declare that the research was conducted in the absence of any commercial or financial relationships that could be construed as a potential conflict of interest.
All claims expressed in this article are solely those of the authors and do not necessarily represent those of their affiliated organizations, or those of the publisher, the editors and the reviewers. Any product that may be evaluated in this article, or claim that may be made by its manufacturer, is not guaranteed or endorsed by the publisher.
1. Cai Q, Alam S, Duong VN. A Spatial-Temporal Network Perspective for the Propagation Dynamics of Air Traffic Delays. Engineering (2021) 7:452–64. doi:10.1016/j.eng.2020.05.027
2. Hoadley D, Bartolo M, Chesterman R, Faus A, Hernandez W, Kultys B, et al. A Global Community of Courts? Modelling the Use of Persuasive Authority as a Complex Network. Front Phys (2021) 9:331. doi:10.3389/fphy.2021.665719
3. Hope SM, Kundu S, Roy C, Manna SS, Hansen A. Network Topology of the Desert Rose. Front Phys (2015) 3:72. doi:10.3389/fphy.2015.00072
5. Zang T, Gao S, Huang T, Wei X, Wang T. Complex Network-Based Transmission Network Vulnerability Assessment Using Adjacent Graphs. IEEE Syst J (2019) 14:572–81. doi:10.1109/JSYST.2019.2934317
6. Wang C, Zhang F, Deng Y, Gao C, Li X, Wang Z. An Adaptive Population Control Framework for ACO-Based Community Detection. Chaos, Solitons & Fractals (2020) 138:109886. doi:10.1016/j.chaos.2020.109886
7. Ma C, Cai Q, Alam S, Sridhar B, Duong VN. Airway Network Management Using Braess's Paradox. Transportation Res C Emerging Tech (2019) 105:565–79. doi:10.1016/j.trc.2019.06.014
8. Li Z, Chen L. Continuous Phase Transition of K-Partite Networks. IEEE Syst J (2020) 2020:2990663. doi:10.1109/JSYST.2020.2990663
9. Wang C, Deng Y, Yuan Z, Zhang C, Zhang F, Cai Q, et al. How to Optimize the Supply and Allocation of Medical Emergency Resources during Public Health Emergencies. Front Phys (2020) 8:1. doi:10.3389/fphy.2020.00383
11. Gong M, Ma L, Cai Q, Jiao L. Enhancing Robustness of Coupled Networks under Targeted Recoveries. Sci Rep (2015) 5:8439. doi:10.1038/srep08439
12. Li Z, Chen L. Robustness of Multipartite Networks in Face of Random Node Failure. Chaos, Solitons & Fractals (2019) 121:149–59. doi:10.1016/j.chaos.2019.01.036
13. Newman MEJ, Barabási A-L, Watts DJ. The Structure and Dynamics of Networks. Princeton University Press (2011).
14. Ichinose G, Tsuchiya T, Watanabe S. Robustness of Football Passing Networks against Continuous Node and Link Removals. Chaos, Solitons & Fractals (2021) 147:110973. doi:10.1016/j.chaos.2021.110973
15. Feketa P, Bajcinca N. On Robustness of Impulsive Stabilization. Automatica (2019) 104:48–56. doi:10.1016/j.automatica.2019.02.056
16. Shekhtman LM, Danziger MM, Havlin S. Recent Advances on Failure and Recovery in Networks of Networks. Chaos, Solitons & Fractals (2016) 90:28–36. doi:10.1016/j.chaos.2016.02.002
17. Shang Y. Localized Recovery of Complex Networks against Failure. Sci Rep (2016) 6:30521. doi:10.1038/srep30521
18. Chattopadhyay S, Dai H, Eun DY, Hosseinalipour S. Designing Optimal Interlink Patterns to Maximize Robustness of Interdependent Networks against Cascading Failures. IEEE Trans Commun (2017) 65:3847–62. doi:10.1109/tcomm.2017.2709302
19. Kong LW, Li M, Liu RR, Wang BH. Percolation on Networks with Weak and Heterogeneous Dependency. Phys Rev E (2017) 95:032301. doi:10.1103/PhysRevE.95.032301
20. Cai Q, Ma L, Gong M, Tian D. A Survey on Network Community Detection Based on Evolutionary Computation. Ijbic (2016) 8:84–98. doi:10.1504/ijbic.2016.076329
21. Cai Q, Liu J. The Robustness of Ecosystems to the Species Loss of Community. Sci Rep (2016) 6:35904. doi:10.1038/srep35904
22. Louzada VHP, Daolio F, Herrmann HJ, Tomassini M. Smart Rewiring for Network Robustness. J Complex networks (2013) 1:150–9. doi:10.1093/comnet/cnt010
23. Dunn S, Wilkinson SM. Increasing the Resilience of Air Traffic Networks Using a Network Graph Theory Approach. Transportation Res E: Logistics Transportation Rev (2016) 90:39–50. doi:10.1016/j.tre.2015.09.011
24. Wuellner DR, Roy S, D'Souza RM. Resilience and Rewiring of the Passenger Airline Networks in the United States. Phys Rev E Stat Nonlin Soft Matter Phys (2010) 82:056101. doi:10.1103/PhysRevE.82.056101
25. Črepinšek M, Liu S-H, Mernik M. Exploration and Exploitation in Evolutionary Algorithms: a Survey. ACM Comput Surv (Csur) (2013) 45:35. doi:10.1145/2480741.2480752
26. Trivedi A, Srinivasan D, Sanyal K, Ghosh A. A Survey of Multiobjective Evolutionary Algorithms Based on Decomposition. IEEE Trans Evol Comput (2017) 21:440–62. doi:10.1109/ACCESS.2020.2973670
27. Cai Q, Gong M, Ruan S, Miao Q, Du H. Network Structural Balance Based on Evolutionary Multiobjective Optimization: A Two-step Approach. IEEE Trans Evol Computat (2015) 19:903–16. doi:10.1109/tevc.2015.2424081
28. van den Bergh F, Engelbrecht AP. A Cooperative Approach to Particle Swarm Optimization. IEEE Trans Evol Computat (2004) 8:225–39. doi:10.1109/tevc.2004.826069
29. Coello CAC, Pulido GT, Lechuga MS. Handling Multiple Objectives with Particle Swarm Optimization. IEEE Trans Evol Computat (2004) 8:256–79. doi:10.1109/tevc.2004.826067
30. Xu X, Chen A, Yang C. An Optimization Approach for Deriving Upper and Lower Bounds of Transportation Network Vulnerability under Simultaneous Disruptions of Multiple Links. Transportation Res Part C: Emerging Tech (2018) 94:338–53. doi:10.1016/j.trc.2017.08.015
31. Wu J, Barahona M, Tan Y-J, Deng H-Z. Spectral Measure of Structural Robustness in Complex Networks. IEEE Trans Syst Man Cybern A (2011) 41:1244–52. doi:10.1109/tsmca.2011.2116117
33. Kennedy J, Eberhart R. A Discrete Binary Version of the Particle Swarm Algorithm. In: Proceedings of 1997 IEEE International Conference on Systems, Man, and Cybernetics. IEEE (1997). p. 4104–8.
34. Deb K, Pratap A, Agarwal S, Meyarivan T. A Fast and Elitist Multiobjective Genetic Algorithm: NSGA-II.. IEEE Trans Evol Computat (2002) 6:182–97. doi:10.1109/4235.996017
35. Mohankrishna S, Maheshwari D, Satyanarayana P, Satapathy SC. A Comprehensive Study of Particle Swarm Based Multi-Objective Optimization. In: Proceedings of the 2012 International Conference on Information Systems Design and Intelligent Applications (2012) p. 689–701. doi:10.1007/978-3-642-27443-5_79
36. Zhang Q, Li H. MOEA/D: A Multiobjective Evolutionary Algorithm Based on Decomposition. IEEE Trans Evol Computat (2007) 11:712–31. doi:10.1109/tevc.2007.892759
Keywords: complex networks, network robustness, network rewire mechanism, multiobjective optimization, partite swarm optimization
Citation: Li Z, Liu Q and Chen L (2021) A Novel Edge Rewire Mechanism Based on Multiobjective Optimization for Network Robustness Enhancement. Front. Phys. 9:735998. doi: 10.3389/fphy.2021.735998
Received: 04 July 2021; Accepted: 21 July 2021;
Published: 10 August 2021.
Edited by:
Zhanwei Du, University of Texas at Austin, United StatesReviewed by:
Liping Huang, Nanyang Technological University, SingaporeCopyright © 2021 Li, Liu and Chen. This is an open-access article distributed under the terms of the Creative Commons Attribution License (CC BY). The use, distribution or reproduction in other forums is permitted, provided the original author(s) and the copyright owner(s) are credited and that the original publication in this journal is cited, in accordance with accepted academic practice. No use, distribution or reproduction is permitted which does not comply with these terms.
*Correspondence: Zhaoxing Li, YWJkZTAzMDlAMTYzLmNvbQ==
Disclaimer: All claims expressed in this article are solely those of the authors and do not necessarily represent those of their affiliated organizations, or those of the publisher, the editors and the reviewers. Any product that may be evaluated in this article or claim that may be made by its manufacturer is not guaranteed or endorsed by the publisher.
Research integrity at Frontiers
Learn more about the work of our research integrity team to safeguard the quality of each article we publish.