- 1State Key Laboratory of Communication Content Cognition, People’s Daily Online, Beijing, China
- 2Department of New Media and Arts, Harbin Institute of Technology, Harbin, China
- 3School of Computer Science and Technology, Harbin Institute of Technology, Harbin, China
- 4China Information Technology Security Evaluation Center, Beijing, China
Assessing the structural vulnerability of online social networks has been one of the most engaging topics recently, which is quite essential and beneficial to holding the network connectivity and facilitating information flow, but most of the existing vulnerability assessment measures and the corresponding solutions fail to accurately reveal the global damage done to the network. In order to accurately measure the vulnerability of networks, an invulnerability index based on the concept of improved tenacity is proposed in the present study. Compared with existing measurements, the new method does not measure a single property performance, such as giant component size or the number of components after destruction, but pays special attention to the potential equilibrium between the removal cost and the removal effect. Extensive experiments on real-world social networks demonstrate the accuracy and effectiveness of the proposed method. Moreover, compared with results of attacks based on the different centrality indices, we found an individual node’s prominence in a network is inherently related to the structural properties of network. In high centralized networks, the nodes with higher eigenvector are more important than the others in maintaining stability and connectivity. But in low centralized networks, the nodes with higher betweenness are more powerful than the others. In addition, the experimental results indicate that low centralized networks can tolerate high intentional attacks and has a better adaptability to attacks than high centralized networks.
Introduction
With the revolution of the WWW technology, Web 2.0 characterized by social collaborative technologies is emerging and fast-growing. People are increasingly inclined to cultivate their virtual social relations and virtual life on the existing prevalent online social networks [1], such as Facebook, Blogger, Wiki, and Digg. These online social networks can provide favorable platforms for people to exchange opinions or information with one another [2]. Specifically, online social networks are creating ties for us with a very wide range of people, which not only are bonded in relationships with acquaintances, as well as maintain close relationships with friends, schoolmates, and family members, but also are embodied in some new relationships in an online virtual world.
In order to defend some potential disruptions and facilitate information flow, assessing the vulnerability of online social networks has been one of the most engaging topics [3, 4]. The concept of vulnerability is generally used to find and characterize a lack of robustness and resilience of a complex system [5]. The vulnerability of a network structure was analyzed first by Albert et al. [6] and was regarded as a previously overlooked “Achilles’ heel.” Initially, vulnerability assessment was focused on some simple and generic models such as the Erdös–Rényi (ER) random model and the Barabási–Albert (BA) scale free model [6, 7]. Over the years, some scholars have found that the inherent preferential attachment mechanism and the structural properties of network may be responsible for the vulnerability of network [8–10]. Especially, a series of numerical simulations were introduced to study tolerance to random removals and intentional attacks in complex networks [11–13]. Most experimental studies have shown that the Barabási–Albert (BA) network and other similar heterogeneous networks are very robust to random removals but are very fragile against intentional attacks based on the degree or betweenness [6, 14]. For homogeneous networks such as regular networks and random networks, the effect of random removals is equivalent to that of intentional attacks [6], while for small-world networks, long-range link attacks can cause their collapse directly [13]. Some achievements have been made in the research of some typical network models, but how the dynamical processes, such as resilience to damage or tolerance to attacks, are influenced by the specific topological structure of a network remains unknown.
In recent years, there has been much effort directed at developing methods for vulnerability assessment [15–17]. The main results are largely based on two aspects, including critical node identification and removal effect evaluation. The former reflects the nodal prominent position in maintaining the network connectivity or facilitating information flow, while the latter refers to how to quantify the effect caused by the removal of a finite number of nodes. Indeed, the identification of critical individuals is an influence maximization problem [18], which aims to select a minimal node set to generate a maximal outcome in a given network. The quantification methods can be roughly classified into three categories: centrality-based algorithms, random-walk algorithms, and greedy-based algorithms. Structural connectivity has become the primary test criterion for vulnerability assessment [19]. In most instances, these evaluation metrics such as the characteristic path length [6] and the network efficiency [20, 21] are relatively straightforward and can more clearly characterize the changes in the connectivity of the target network before and after some nodes are removed. However, they only provide a useful topological snapshot for connected networks and are not suitable to assess the network vulnerability in terms of disconnectivity [15]. In addition, the existing measurements are difficult to reach equilibrium between the removal cost and the removal effect.
The primary purpose of this article is to fill this gap by exploring a new method to effectively quantify the vulnerability of the network structure. The new method focuses on how to identify the importance, or status, of a node in the network, and on further use of available resources to efficiently disrupt network operation, which comprehensively takes account of the cost with which one can disrupt a network and the attack effect. The contributions of this study can be summarized as the following:
1) An invulnerability index based on the concept of improved tenacity is proposed to measure the adaptability to attacks.
2) Low centralized networks can have a better adaptability to attacks than high centralized networks.
3) The experimental results verify the outperformance of the proposed method.
The rest of the article is organized as the following: In Methods, in order to assess the vulnerability of networks more properly, we present an invulnerability index based on the concept of improved tenacity to examine network adaptability to attacks. Generally, a network with a higher invulnerability index performs better under intentional attacks. In Network Data, we will examine the static properties of real online social networks empirically, in order to summarize the generalized differences in the topological structure of various online social networks. Especially, in Discussion, we will display the threshold behavior of the aforementioned networks on experimental observation, and further compare the efficiency of node removal with different centrality indices to find the vulnerability of online social networks.
Methods
The Attack Strategies
Inspired by the well-known percolation theory in statistical physics, the robustness and resilience of a network is usually defined as the network structural degradation caused by the removal of some critical nodes [19]. Tolerance to random removals and intentional attacks is understood as the ability of the network to maintain operations and connectivity under the loss of some nodes or links [8]. In order to ensure the efficiency of attacks, it is necessary to identify the most vulnerable nodes in a network. Indeed, the identification of critical nodes is an influence maximization problem [18]. The quantification algorithms can be roughly classified into three categories: centrality-based algorithms, random-walk algorithms, and greedy-based algorithms.
Centrality-based algorithms perform a fundamental quantification by considering geodesics between nodes to evaluate nodal importance. Up to now, many centrality-based algorithms have been proposed, such as degree centrality [22, 23], betweenness centrality [22, 24], closeness centrality [22, 25], eigenvector centrality [26], and other improved centrality-based algorithms [27–29]. The random-walk algorithms include the well-known PageRank [30] and other improved algorithms [31]. Random-walk algorithms work only well for directed networks. Greedy-based algorithms formulate the influence measurement as a discrete optimization problem, and their elementary strategies are to select the spreaders that contribute the largest incremental influence one by one, according to a specified influence cascade model [32]. In terms of algorithm construction, although greedy-based algorithms can achieve excellent results, they also have very high computational complexity and are not suitable for large-scale social networks.
Previous studies have shown that the adaptability of networks behaves differently from various attack strategies [20, 33]. Thus, in this article, we will study tolerance to various attacks in real online social networks and further find a minimized set of nodes triggering the collapse of network. We will consider four straightforward and efficient centrality indices as attack strategies to identify the importance of nodes.
1) Degree centrality: The algorithm measures a node’s influence according to the number of edges attached to it, which reflects the ability of a node to connect directly with other nodes.
2) Betweenness centrality: The algorithm measures a node’s influence through the ratio of the shortest path over the nodes to the number of all paths, which considers the global structure information of a given graph.
3) Closeness centrality: The basic idea behind the closeness centrality is that a node is central if it is “close” to many other nodes [34]. Thus, the closeness centrality score of node i is defined as the reciprocal of the sum of geodesic distances to all other nodes.
4) Eigenvector centrality: The algorithm is based on the principle that a node should be viewed as important if it is linked to other nodes which are important themselves. Thus, the eigenvector centrality of node i is defined as the proportional to the sum of the eigenvector centralities of the nodes it is connected to [28].
Because the removal of nodes under intentional attacks changes the balance of structure and leads to a global redistribution over all the networks, we recalculate the degree centrality, the betweenness centrality, the closeness centrality, and the eigenvector centrality, every time a small fraction of nodes is removed.
Evaluation Metrics
Numerous empirical results on real networks have revealed that the heterogeneous topology structure may be fit for most real networks [35–37], where degree distribution significantly deviates from a Poisson and low degree nodes are far more abundant than the nodes with high degrees. Due to the inhomogeneity of general networks, removing some critical nodes will decrease the network connectivity and lead to the loss of the global information-carrying ability of the network [6, 20]. Generally, when assessing the vulnerability of a network under intentional attacks, three performance criteria should be concerned in the framework of graph theory [38]:
1) The number of components that are being removed.
2) The number of disconnected subgroups after intentional attacks.
3) The size of the largest remaining group within which mutual communication can still occur.
Most of the online social networks can be abstracted as a non-complete connected graph
As one of the basic concepts of graph theory, connectivity plays a vital role in network performance and is fundamental to vulnerability measures. The concept of connectivity
where
Toughness and integrity are two other graph concepts used in the vulnerability assessment. The notion of the toughness
where
The notion of integrity introduced as another vulnerability parameter of graphs [41] focuses on the criteria (1) and (3). For a non-complete connected graph
where
Obviously, the disruption is more successful if the disconnected network contains more components and is much more successful if, in addition, the components are small. Unfortunately, connectivity and toughness give the minimum cost to disrupt a network but fail to indicate accurately what remains after the disruption. Although Barefoot’s integrity has taken the size of the largest remaining component after destruction into account, it cannot indicate the extent of the damage.
The notion of tenacity was originally proposed in Ref. [42], where they introduced the mix-tenacity to measure the vulnerability of Harary graphs. The precise definition of tenacity is defined as follows:
The tenacity
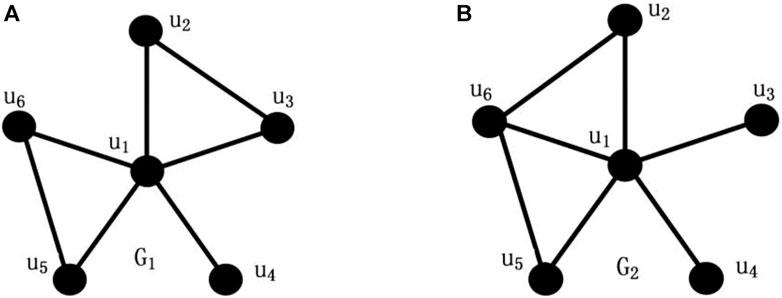
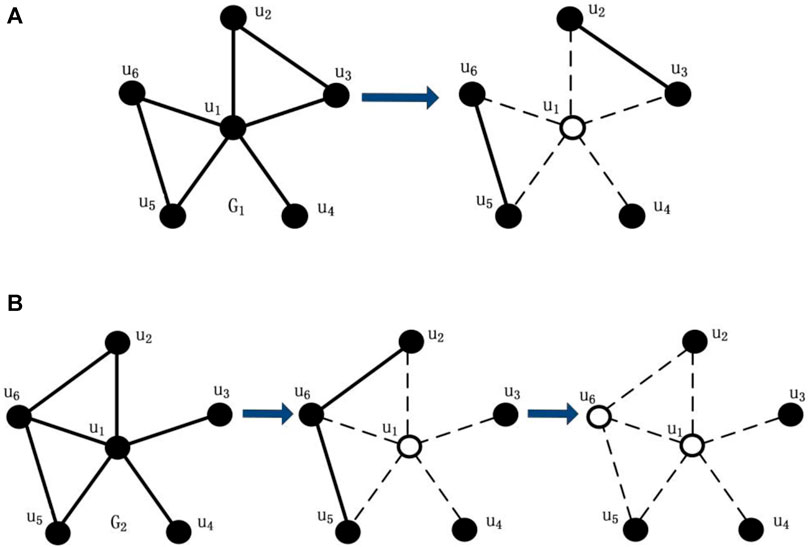
In general, if the network remains more disconnected subgroups and smaller connected component size after destruction, the disruption is more successful. As shown in Figures 3A,B,
In Ref. [43], Hendry used the concept of scattering number to measure the vulnerability of extremal non-Hamiltonian graphs and found that it was more efficient for measuring the degree of global destruction. The scattering number
So we think that it is necessary to add the criterion to reveal the global damage done to networks under attacks, and keep its priority in assessing the vulnerability of networks. Therefore, we propose an improved tenacity based on the concepts of scattering number and tenacity, which is named
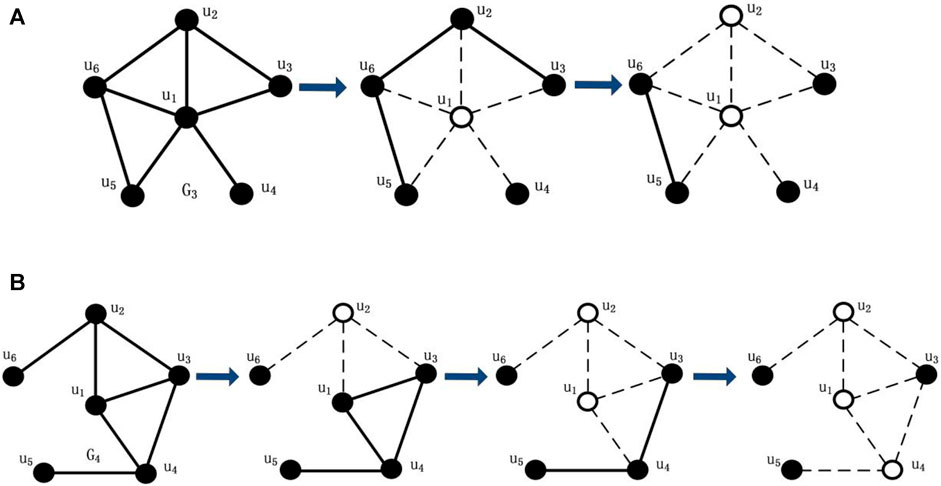
As shown in Figures 3A,B,
Compared with existing evaluation metrics [6, 20, 21, 39–42], our notion of improved tenacity is not to measure a single property performance such as giant component size or the number of components after destruction, which is insufficient to evaluate the network vulnerability by only considering whether or not it is a disconnected network, and how fragmental the network becomes, but to pay special attention to the potential equilibrium between the giant component size and the number of components under intentional attacks. As shown in definition (6), the number of components
Network Data
Data Description
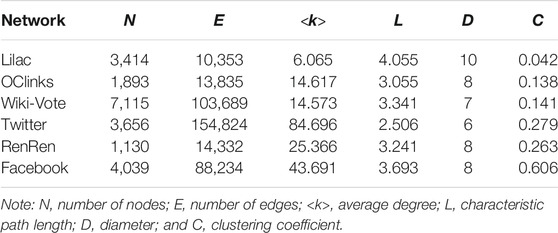
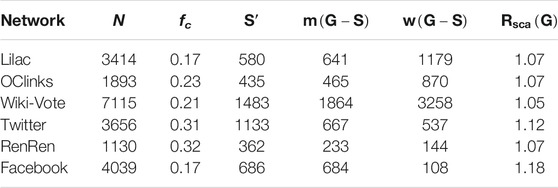
Because online social networks serve as much social function as other kinds of social interaction, including e-mail exchanging, text messaging, instant messaging, digital video sharing, and so on, each edge meaning a connection in online social networks is complex and changeable, whereas each node meaning an individual of online social networks is constant. To measure the vulnerability of networks more properly, our method will pay more attention to the importance of nodes, rather than edges. Our data set is composed of six undirected and unweighted networks, that is, networks that have a binary nature, where the edges between nodes are either present or not, and each edge has no directional character. Table 2 indicates that the six real social network include the following: OClinks is a representative online community network, where users are from the University of California, Irvine, which is from Panzarasa et al.’s [44]; Twitter, Wiki-Vote, and Facebook can be downloaded from the Stanford network dataset (http://snap.stanford.edu/data/index.html); and Lilac and RenRen are collected from the online social networks by us.
In Table 1, we show the main topological properties of a series of online social networks, belonging to two different types: the online community service based on group-centered service and the social network service based on individual-centered service. The first three networks, Lilac, OClinks, and Wiki-vote, are three examples of online community services, where the users have a common interest and purpose and can exchange information or seek help. In these networks, the nodes are the registered users, and the links represent a relationship between two users existing message exchange. In the latter part of Table 1, we show three examples of social network services. Twitter is a social news website, where users may mention other people or follow other people to make his/her posts, so the links imply communication between users existing mention or comment. RenRen is a real-name social networking internet platform in China, where users can connect and communicate with each other or enjoy a wide range of other features and services, so the links reflect different kinds of social relationships between the users. Facebook is an ego network consisting of friends lists from Facebook.
Structure of Networks
The most basic topological characterization of networks can be obtained in terms of the degree distribution
The empirical results demonstrate that the degree distributions
The similar trend is shown in Figure 4B, where the probability
As shown in Figure 4C, the probability
Otherwise, the insets in Figures 5A–C show the degree distributions of Twitter, RenRen, and Facebook, where

FIGURE 4. Cumulative degree distribution

FIGURE 5. Stretched exponential distributions of Twitter (A), RenRen (B), and Facebook (C) are clear. The insets exhibit the degree distribution
The stretched exponential distribution is obtained by inserting a fractional power law distribution into the exponential distribution: as
In this section, we have examined the static properties of a variety of online social networks empirically and found that two types of networks, the online community service and the social network service, have completely different structural properties. As shown in Figures 4A–C, Lilac network, OClinks network, and Wiki-Vote network exhibit a highly inhomogeneous degree distribution, where the simultaneous presence of a few nodes tending to link many other nodes, and a large number of poorly connected nodes. But in Figures 5A–C, the curves of degree distributions have witnessed that the nodes in Twitter, RenRen, and Facebook networks are more evenly distributed than those in Lilac, OClinks, and Wiki-Vote networks, where extreme value still runs at a relatively low level. As it can be noticed, Twitter, RenRen, and Facebook as social network services are mainly based on an individual-centered online platform for organizing feature and technical feature themselves and have lower centralization than the Lilac, OClinks, and Wiki-Vote network based on group-centered service.
Discussion
When the vast majority of real networks, especially online social networks, are fragmented into relatively tiny isolated components, these networks will lose transmission capacities between individual components, indicating the collapse of network is approaching. So, we only find an optimal threshold that can trigger the collapse of the network. In general, the problem can be analytically treated by using percolation theory, where one defines a critical probability fc below which the network percolates, and a set of critical exponents can characterize the phase transition. In Ref. [6], Albert et al. have studied how the properties of some networks with given order and size change when a fraction f of the nodes are removed, where the average characteristic path length as an order parameter displays for both errors and attacks a threshold-like behavior. In this section, we first study the changes in the improved tenacity
As shown by the curved lines in Figure 6, the performance of improved tenacity
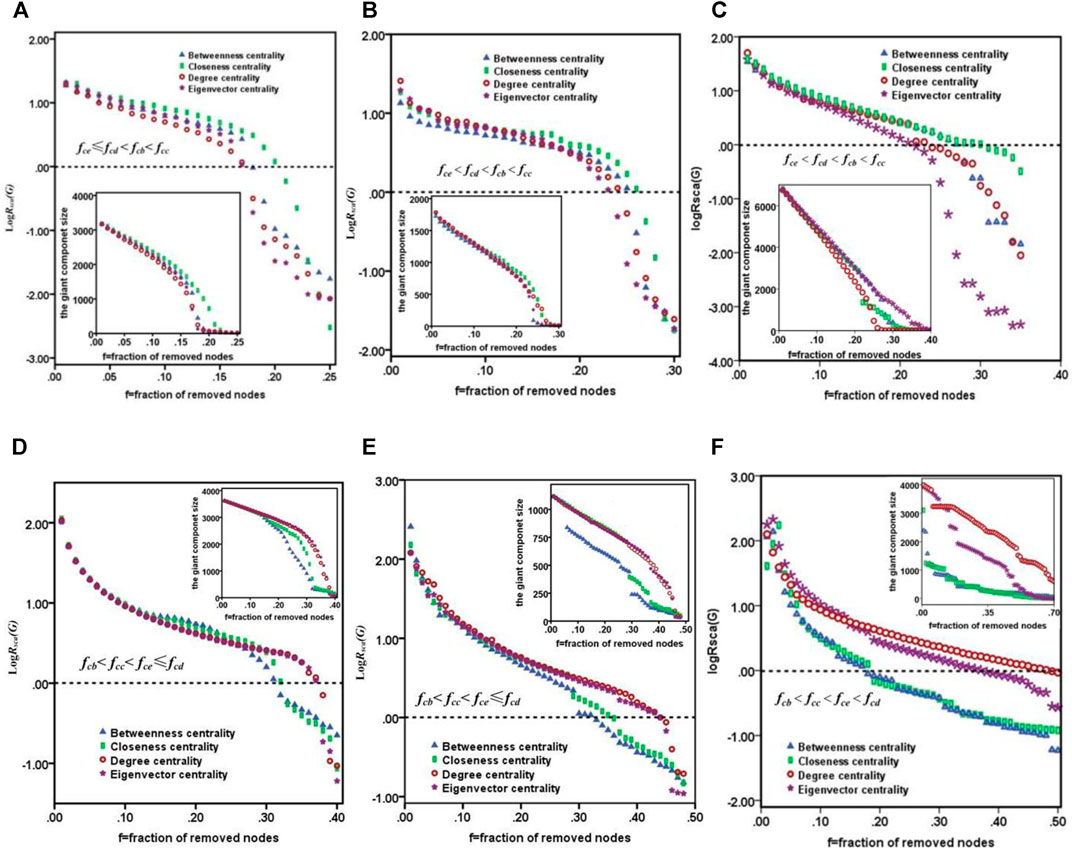
FIGURE 6. From (A–F), indicating the performance of improved tenacity
The centrality concept seeks to quantify an individual node’s prominence within a network by summarizing structural relations among the nodes. A node’s prominence reflects its greater visibility to the other network nodes. In online social networks, central nodes are likely to be more influential and have greater access to information and can communicate their opinions to others more efficiently. Further research indicates that the various roles of the same node based on different centrality indices show the striking difference in maintaining network connectivity. Looking at the changes in the critical fraction fc, from Figures 6A–F,
Another important conclusion that can be drawn from the results presented is that the performance of improved tenacity
Conclusion
In this article, we synthetically take account of the cost with which one can disrupt a network and the effect of, and a new evaluation method based on the concepts of scattering number and tenacity. Compared with existing evaluation metrics, our method focuses on the potential equilibrium between the attack effect and the attack cost. For this purpose, we first examined empirically the static properties of six online social networks, including three online community services and three social network services, that is, Lilac, OClinks, Wiki-Vote, Twitter, RenRen, and Facebook, and found that there are wide differences in the topological structure of networks.
Second, we studied the changes in the improved tenacity
Data Availability Statement
The original contributions presented in the study are included in the article/Supplementary Material; further inquiries can be directed to the corresponding authors.
Author Contributions
Conceptualization, DZ and CG; methodology, DZ and ZZ; validation, DZ and GL; formal analysis, DZ, ZZ, and CG; resources, DZ and GL; data curation, DZ; original draft preparation, DZ; revise and editing, DZ, ZZ, and CG; project administration, CG; funding acquisition, DZ and ZZ. All authors have read and agreed to the published version of the manuscript.
Conflict of Interest
The authors declare that the research was conducted in the absence of any commercial or financial relationships that could be construed as a potential conflict of interest.
Publisher’s Note
All claims expressed in this article are solely those of the authors and do not necessarily represent those of their affiliated organizations, or those of the publisher, the editors, and the reviewers. Any product that may be evaluated in this article, or claim that may be made by its manufacturer, is not guaranteed or endorsed by the publisher.
Acknowledgments
This work was partly supported by State Key Laboratory of Communication Content Cognition, People’s Daily Online (No. A12001) and Natural Science Foundation of Heilongjiang Province of China (No. LC2018031).
Supplementary Material
The Supplementary Material for this article can be found online at: https://www.frontiersin.org/articles/10.3389/fphy.2021.733224/full#supplementary-material
References
1. Leimeister J. M., Sidiras P., Krcmar H. Exploring Success Factors of Virtual Communities: the Perspectives of Members and Operators. J Organizational Comput Electron commerce (2006) 16:279–300. doi:10.1207/s15327744joce1603&4_7
2. Liu Z., Hu B. Epidemic Spreading in Community Networks. Europhys Lett (2005) 72:315–21. doi:10.1209/epl/i2004-10550-5
3. Deng X. L, Ding H., Chen Y., Chen C., Lv TJ. Novel Node Centrality-Based Efficient Empirical Robustness Assessment for Directed Network. Complexity (2020) 2020. 1-14. doi:10.1155/2020/8715619
4. Zeng Y., Xiao R. A Networked Approach to Dynamic Analysis of Social System Vulnerability. J Intell Fuzzy Syst (2015) 28:189–97. doi:10.3233/IFS-141289
5. Kuhnle A., Nguyen N. P., Dinh T. N., Thai M. T. Vulnerability of Clustering under Node Failure in Complex Networks. Soc Netw Anal Min (2017) 7:8. doi:10.1007/s13278-017-0426-5
6. Albert R., Jeong H., Barabási A.-L. Error and Attack Tolerance of Complex Networks. Nature (2000) 406:378–82. doi:10.1038/35019019
7. Holmgren A. J. Using Graph Models to Analyze the Vulnerability of Electric Power Networks. Risk Anal (2006) 26:955–69. doi:10.1111/j.1539-6924.2006.00791.x
8. Callaway D. S., Newman M. E. J., Strogatz S. H., Watts D. J. Network Robustness and Fragility: Percolation on Random Graphs. Phys Rev Lett (2000) 85:5468–71. doi:10.1515/9781400841356.510
9. Buldyrev S. V., Parshani R., Paul G., Stanley H. E., Havlin S. Catastrophic Cascade of Failures in Interdependent Networks. Nature (2010) 464:1025–8. doi:10.1038/nature08932
10. Gao J., Buldyrev S. V., Havlin S., Stanley H. E. Robustness of A Network of Networks. Phys Rev Lett (2011) 107:195701. doi:10.1103/PhysRevLett.107.195701
11. Cohen R., Ben-Avraham D., Havlin S. Percolation Critical Exponents in Scale-free Networks. Phys Rev E (2002) 66:36113. doi:10.1103/PhysRevE.66.036113
12. Vázquez A., Moreno Y. Resilience to Damage of Graphs with Degree Correlations. Phys Rev E (2003) 67:015101. doi:10.1103/PhysRevE.67.015101
13. Jalili M. Error and Attack Tolerance of Small-Worldness in Complex Networks. J Informetrics (2011) 5:422–30. doi:10.1016/j.joi.2011.03.002
14. Wu J., Tan S-Y., Liu Z., Tan Y-J., Lu X. Enhancing Structural Robustness of Scale-free Networks by Information Disturbance. Sci Rep (2017) 7:7559. doi:10.1038/s41598-017-07878-2
15. Grubesic T. H., Matisziw T. C., Murray A. T., Snediker D. Comparative Approaches for Assessing Network Vulnerability. Int Reg Sci Rev (2008) 31:88–112. doi:10.1177/0160017607308679
16. Estrada E., Hatano N. A Vibrational Approach to Node Centrality and Vulnerability in Complex Networks. Physica A: Stat Mech its Appl (2010) 389:3648–60. doi:10.1016/j.physa.2010.03.030
17. Chen B. Y., Lam W. H. K., Sumalee A., Li Q., Li Z.-C. Vulnerability Analysis for Large-Scale and Congested Road Networks with Demand Uncertainty. Transportation Res A (2012) 46:501–16. doi:10.1016/j.tra.2011.11.018
18. Morone F., Makse H. A. Influence Maximization in Complex Networks through Optimal Percolation. Nature (2015) 524:65–8. doi:10.1038/nature14604
19. Boccaletti S., Latora V., Moreno Y., Chavez M., Hwang D. Complex Networks: Structure and Dynamics. Phys Rep (2006) 424:175–308. doi:10.1016/j.physrep.2005.10.009
20. Latora V., Marchiori M. Efficient Behavior of Small-World Networks. Phys Rev Lett (2001) 87:198701. doi:10.1103/PhysRevLett.87.198701
21. Crucitti P., Latora V., Marchiori M., Rapisarda A. Error and Attack Tolerance of Complex Networks. Physica A: Stat Mech its Appl (2004) 340:388–94. doi:10.1016/j.physa.2004.04.031
22. Freeman L. C. Centrality in Social Networks: Conceptual Clarification. Social Networks (1979) 1:215–39. doi:10.1016/0378-8733(78)90021-7
23. Uddin S., Hossain L., Wigand R. T. New Direction in Degree Centrality Measure: Towards a Time-Variant Approach. Int J Info Tech Dec Mak (2014) 13:865–78. doi:10.1142/S0219622014500217
24. Newman M. E. J. A Measure of Betweenness Centrality Based on Random Walks. Soc Networks (2005) 27:39–54. doi:10.1016/j.socnet.2004.11.009
25. Wehmuth K., Ziviani A. DACCER: Distributed Assessment of the Closeness Centrality Ranking in Complex Networks. Computer Networks (2013) 57:2536–48. doi:10.1016/j.comnet.2013.05.001
26. Li X. J., Liu Y .Z., Jiang Y. C., Liu X. Identifying Social Influence in Complex Networks: A Novel Conductance Eigenvector Centrality Model. Neurocomputing (2015) 210:141–54. doi:10.1016/j.neucom.2015.11.123
27. Chen D., Lü L., Shang M.-S., Zhang Y.-C., Zhou T. Identifying Influential Nodes in Complex Networks. Physica A: Stat Mech its Appl (2012) 391:1777–87. doi:10.1016/j.physa.2011.09.017
28. Iyer S., Killingback T., Sundaram B., Wang Z. Attack Robustness and Centrality of Complex Networks. Plos One (2013) 8:e59613. doi:10.1371/journal.pone.0059613
29. Nguyen Q., Pham H. D., Cassi D., Bellingeri M. Conditional Attack Strategy for Real-World Complex Networks. Physica A: Stat Mech its Appl (2019) 530:121561. doi:10.1016/j.physa.2019.121561
30. Brin S., Page L. The Anatomy of A Large-Scale Hypertextual Web Search Engine. Comp Networks ISDN Syst (1998) 30:107–17. doi:10.1016/S0169-7552(98)00110-X
31. Zengin Alp Z., Gündüz Öğüdücü Ş. Identifying Topical Influencers on Twitter Based on User Behavior and Network Topology. Knowledge-Based Syst (2018) 141:211–21. doi:10.1016/j.knosys.2017.11.021
32. Erkol Ş., Castellano C., Radicchi F. Systematic Comparison between Methods for the Detection of Influential Spreaders in Complex Networks. Sci Rep (2019) 9:15095. doi:10.1038/s41598-019-51209-6
33. Nie T., Guo Z., Zhao K., Lu Z.-M. New Attack Strategies for Complex Networks. Physica A: Stat Mech its Appl (2015) 424:248–53. doi:10.1016/j.physa.2015.01.004
34. Liao H., Mariani M. S., Medo M., Zhang Y.-C., Zhou M.-Y. Ranking in Evolving Complex Networks. Phys Rep (2017) 689:1–54. doi:10.1016/j.physrep.2017.05.001
35. Eom Y. H., Jeon C., Jeong H., Kahng B. Evolution of Weighted Scale-free Networks in Empirical Data. Phys Rev E Stat Nonlin Soft Matter Phys (2008) 77:056105. doi:10.1103/PhysRevE.77.056105
36. Kujawski B., Hołyst J., Rodgers G. J. Growing Trees in Internet News Groups and Forums. Phys Rev E Stat Nonlin Soft Matter Phys (2007) 76:036103. doi:10.1103/PhysRevE.76.036103
37. Slanina F. Dynamics of User Networks in On-Line Electronic Auctions. Advs Complex Syst (2014) 17. 1–14. doi:10.1142/S0219525914500027
39. Bellingeri M., Bevacqua D., Scotognella F., Alfieri R., Nguyen Q., Montepietra D, et al. Link and Node Removal in Real Social Networks: A Review. Front Phys (2020) 8:228. doi:10.3389/fphy.2020.00228
40. Chvátal V. Tough Graphs and Hamiltonian Circuits. Discrete Maths (1973) 5:215–28. doi:10.1016/0012-365x(73)90138-6
41. Barefoot C. A., Entringer R., Swart H. Vulnerability in Graphs—A Comparative Survey. J Combin Math Combin Comput (1987) 1:13–22.
42. Cozzens M. B., Moazzami D., Stueckle S. Tenacity of Harary Graphs. J Combin Math Combin Comput (1994) 16:33–56.
43. Hendry G. R. T. Scattering Number and Extremal Non-hamiltonian Graphs. Discrete Maths (1988) 71:165–75. doi:10.1016/0012-365x(88)90069-6
Keywords: online social network, vulnerability, structural property, centrality index, vulnerability assessment
Citation: Zhang D, Guo C, Zhang Z and Long G (2021) Assessing the Structural Vulnerability of Online Social Networks in Empirical Data. Front. Phys. 9:733224. doi: 10.3389/fphy.2021.733224
Received: 30 June 2021; Accepted: 13 September 2021;
Published: 25 October 2021.
Edited by:
Chengyi Xia, Tianjin University of Technology, ChinaReviewed by:
Michele Bellingeri, University of Parma, ItalyZhen Wang, Hangzhou Dianzi University, China
Copyright © 2021 Zhang, Guo, Zhang and Long. This is an open-access article distributed under the terms of the Creative Commons Attribution License (CC BY). The use, distribution or reproduction in other forums is permitted, provided the original author(s) and the copyright owner(s) are credited and that the original publication in this journal is cited, in accordance with accepted academic practice. No use, distribution or reproduction is permitted which does not comply with these terms.
*Correspondence: Changyong Guo, Z3VvY3lAaGl0LmVkdS5jbg==; Zhaoxin Zhang, aGVhcnRAaGl0LmVkdS5jbg==
 Dayong Zhang1,2
 Changyong Guo
 Zhaoxin Zhang
