
94% of researchers rate our articles as excellent or good
Learn more about the work of our research integrity team to safeguard the quality of each article we publish.
Find out more
ORIGINAL RESEARCH article
Front. Phys., 31 August 2021
Sec. Medical Physics and Imaging
Volume 9 - 2021 | https://doi.org/10.3389/fphy.2021.724962
This article is part of the Research TopicClinical Applications of BiophotonicsView all 4 articles
 Konstantin Grygoryev 1*
 Huihui Lu 1
 Celina L. Li 1Alexander V. Zhdanov 2Ray Burke 1
 Stefan Andersson-Engels 1,3
Identification of tumour margins during resection of the brain is critical for improving the post-operative outcomes. Current methods of tumour identification use 5-ALA, an exogenous precursor, metabolized to fluorescent PpIX in tumour tissue. Although visible under fluorescent microscope, PpIX is easily photo-bleached and tumour tagging is subjective, resulting in tumour under-resection and accelerated recurrence. To address this issue, photo-bleaching resistant and quantitative method is required. This study describes the characterization of a pulsed, multi-wavelengths system designed to measure diffuse reflectance and auto-fluorescence under strong ambient illumination conditions. The performance was tested on n = 400 liquid tissue phantoms containing a wide concentration range of absorber, scatterer and two fluorophores as well as on ex-vivo samples of gray and white matter. The background subtraction technique was shown to be efficient for a range of ambient illumination intensities. A linear relationship was observed between system response and predicted fluorophore concentrations as well as 97.8% accuracy of tissue classification by 5-fold cross-correlation, linear SVM.
Glioblastoma multiforme (GBM) is the most common form of primary malignant brain cancer with an aggressive and infiltrative growth pattern into the normal brain parenchyma [1, 2]. The initial treatment of choice for newly diagnosed patients is maximal safe resection, usually followed by concurrent chemotherapy and fractionated radiotherapy [3]. However, due to the highly infiltrative nature of GBM and limited intraoperative visualization of the tumour margin, incomplete surgical resection has been observed to occur commonly among up to 80% GBM cases, leading to nearly universal recurrence at the resection margin and overall poor prognosis of 14.6 months median survival [4–7]. In order to improve margin detection of GBM intraoperatively, fluorescence guided resection (FGR) with the use of 5-aminolevulinic acid (5-ALA) has been developed over the past few decades and widely adopted by neurosurgeons. The technique allows the surgeon to distinguish between fluorescent tumour tissue and the non-fluorescent healthy brain [8, 9]. The use of 5-ALA has been shown to significantly improve the accuracy of tumour resection and increase the patient survival rates [10, 11]. Despite these improvements, definitive delineation between tumour infiltration zone and healthy brain tissue still remains challenging, primarily because the surgeon must make subjective decisions regarding resection margins based on perceived strengths of fluorescence [12–14].
To address this issue, many clinical studies have examined spectroscope-based systems designed to detect or quantify optical differences between tumour and healthy brain [13, 15–20]. Such instruments often utilize a fiber-optic probe and several light sources to measure tissue diffuse reflectance and the intensity of fluorescence induced by PpIX [13, 20] or endogenous fluorophores [15, 17]. One potential obstacle to clinical adoption is that the spectroscope-based instruments require long integration times to detect a low-level fluorescent signal making such systems more sensitive to strong background illumination of the operating room. Multi-source and detector systems, provide a strong alternative to the spectroscope-based setups for clinical measurements. Such system can become very compact for straight-forward adaptation to the clinical work flow [21, 22]. Also, illumination and signal acquisition of such systems can be modulated in kHz frequency range, allowing for more accurate background measurements and leading to improved SNRs and decreased photo-bleaching if used with 5-ALA. The photon detection efficiency can be improved by specifying the bio-marker spectral bands at the illumination stage with light sources of required wavelengths [23]. In addition rather than a single detector, using an array of avalanche photodiodes (APD) is an effective method of detecting low level fluorescent signals [24]. Finally, such instrument architecture allows for implementation of calibration algorithms that account for distorting factors such as tissue optical properties, auto-fluorescence and fluorescent photoproducts to derive bio-marker concentration [20, 25–33].
There are a number of challenges remaining with quantitative measurements of auto-fluorescence. First, the difference in signal strengths between diffuse reflectance and auto-fluorescence is in orders of magnitude. As such, the dynamic range of the whole instrument can be a limiting factor to quantification. Second, the molecular composition of tissues is complex and provides an opportunity to discriminate between tissue types with increased certainty by measuring concentration of more than one bio-marker with different fluorescence profiles in tissue.
Hence, this study presents a novel, fibre-based optical instrument with extended dynamic range, capable of continuously compensating for ambient illumination while performing contact point measurements. The instrument presented builds on our previous study [34]. The major novelty aspect of the system is its capability to measure concentrations of two independent fluorophores in diffuse media with large variation of absorption and scattering. This instrument was tested on n = 400 liquid optical tissue phantoms containing two GBM fluorescent biomarkers: flavin (FAD) excitation at 470–490 nm and emission at 505 nm and NAD(P)H with excitation at 340 nm and emission at 450 nm [35, 36].
As shown in Figure 1A, the light was delivered to the sample surface via 9-in-1 optical probe. (FibreTech Optica, Canada). The illumination fibres were 400 μm in diameter, numerical aperture (NA) of 0.22 and surface are of 0.12 mm2. Three fibers were coupled to LEDs with wavelengths of 300, 340 and 590 nm (Table 1). The multi-laser diode source with 390 nm, 440, 470, 530 and 680 nm wavelengths was coupled to a single fibre. The LEDs and laser diodes were modulated using dedicated, single channel drivers (LEDD1B, ThorLabs Inc. Newton, New Jersey, USA and FL500 on FL591 eval. board, Wavelengths Electronics, MT, USA, respectively). The source pulse lengths was 1.5 ms with a 1.5 ms gap between each to allow background measurement.
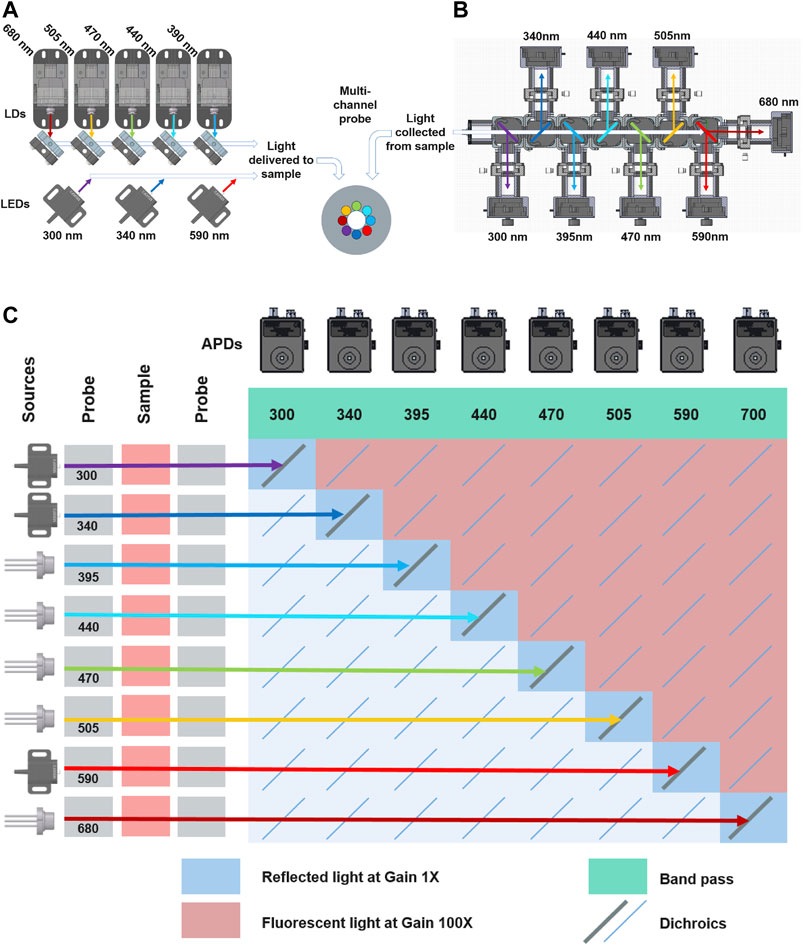
FIGURE 1. (A) Schematic of illumination sources. The laser diodes were coupled into a single fibre using the dichroic mirrors, while each LED was coupled to an individual fibre. Both illumination and collection fibre comprised the fibre-optic probe (B) Separation of collected light into distinct wavelengths bands. (C) The relationship between source and detector channels indication type of signal collected, amplifier gain as well as corresponding channel.
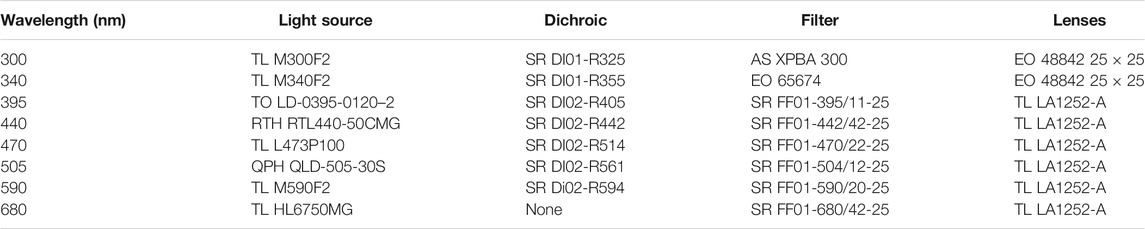
TABLE 1. TR system components. TL, ThorLabs; TO, TOptica; RTH, Roithner; EO, Edmund Optics; AS, ASAHI SPECTRA; SR, Semrock; QPH, QPhotonics.
As shown in Figure 1B, the reflected and fluorescent light was collected from the surface of the sample by the central, 600 μm, 0.22 NA fiber (surface area 0.28 mm2) of the probe. The combined fibre surface area and the source coupling scheme made up a total sampling area of 0.67 mm2. The individual source-detector pairs had a sampling area of 0.41 mm2. The collected light was guided into a collimator and then through an array of dichroic mirrors mounted inside interlocking cages (CM1-DCH, ThorLabs Inc. Newton, New Jersey, USA). The dichroics were positioned at 45° and 135° to the collimator. This arrangement allowed the collected light to be divided into its wavelengths components and then guided to an appropriate APD (APD4102A-M, ThorLabs Inc. Newton, New Jersey, USA). The APDs with Noise-equivalent power (NEP) of 0.09 pW/
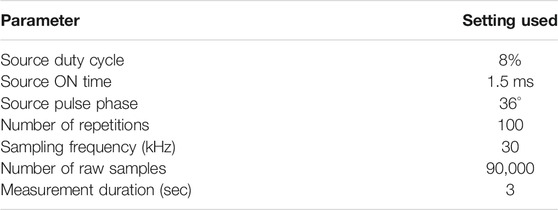
TABLE 2. TR system measurement settings.
The influence of increasing background illumination on reflectance measurements was investigated as follows. One spare 400 μm branch of the 9-in-1 probe was coupled to a UV-enhanced photodiode (S130VC, ThorLabs, UK) and a power meter (PM100D, ThorLabs, UK). The two remaining spare probe branches were coupled with two separate halogen light sources (HL2000HP, Ocean Optics, USA). The background intensity was increased using the lamp shutter adjustment screws in 0.5 μW steps from 0 to 0.573 μW. The background intensity was converted to luminous flux (lm) using Equation 1:
Where Flux is the luminous flux, PW is the measured optical power, ηeff is the luminous efficacy of halogen source estimated at 20 lmW−1, Am is the surface area of the spare collecting fibre calculated to 1.25 × 10⁻⁷ m2 and dm is the distance between the fibre and the surface of the standard estimated at 2 × 10⁻² m.
The dynamic range was evaluated for amplifier Gain = 1 and Gain = 100 by coupling the fibre-optic probe to an integrating sphere (4P4, ThorLabs, UK). The power of the collected light was controlled using a set of neutral density (ND) filters (25 mm diameter, NDUV, ThorLabs, UK) with values between OD 0.1-10 (Figure 1). The filters were mounted in two filter holders (CFH2/M, AD16F, ThorLabs, UK) with collimator/condenser (88181, Edmund Optics, UK) lenses on both sides. A single 600 μm UV-enhanced optical fiber (M114L02, ThorLabs, UK) was used to patch the light from the filters to the instrument’s APD array.
The combined stability of detectors and illumination sources was investigated by performing repeated measurements on a diffuse reflectance standard (SRS-99-010, Labsphere). In addition, a photodiode was installed inside the laser diode enclosure to record the source power output during measurements that is independent from APDs. The instrument was then set to automatically perform a measurement every 120 s for 4.5 h.
Four hundred liquid phantoms were prepared as aqueous mixture of intralipids 20% (Merck, Wicklow, Ireland) as scatterer; India ink (Winsor and Newton® black India ink, Cork, Ireland) as an absorber. NDAH and FAD (Merck, Wicklow, Ireland) were used as fluorophores. Four volume fraction of intralipids (4, 8, 12, 16%, v/v) were selected to simulate different scattering coefficient. A 1% stock solution of India ink in de-ionised water was prepared and four volume fractions (0.5, 1, 2 and 4%, v/v) were then used to simulate different absorption level coefficients. The scattering coefficient of intralipids and the absorption coefficient a of Indian ink were determined using the collimated transmittance setup in our previous work [37]. The concentration of NADH and FAD chosen to cover a typical range of that in biological tissue. Each fluorophores was dissolved in water to prepare NADH stock solution as 100 mg/ml and FAD stock solution as 10 mg/ml, a series of dilutions from this stock solution into aqueous mixture containing intralipids and ink were used to achieve the desired fluorophores concentrations (Table 3). The measurements on liquid phantoms were performed as follows. A 10 × 10, multi-well, aluminium plate was machined and anodized black to reduce specular reflectance. Three hundred (300) micro-liters of premixed phantom was sequentially added into each well of the plate. Figure 2A outlines the phantom arrangement. The fibre-optic probe was submerged into the each phantom by hand and a measurement was taken. After each measurement, the probe tip was cleaned by submersion in de-ionised water then dried with lint free tissue as to not contaminate consecutive phantoms. Since the plate could hold only 100 phantoms, this procedure was repeated four times.
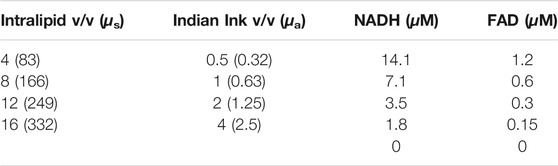
TABLE 3. Concentrations of all liquid phantom components including μs and μa of intralipid and Indian ink, respectively.
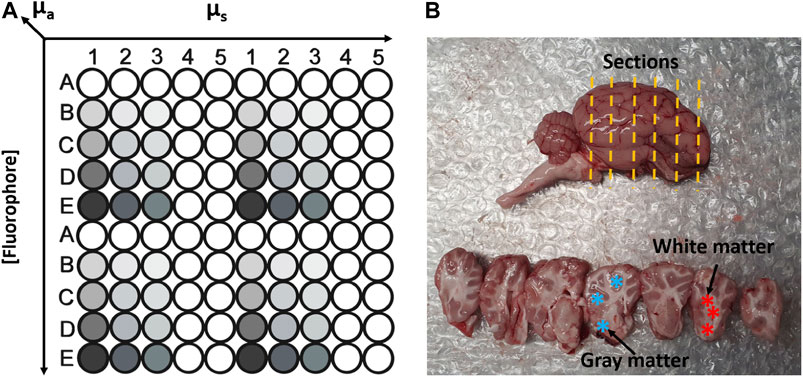
FIGURE 2. (A) Schematic sketch to illustrate phantom matrix layout in a customised multi-well plate. (B) Photograph of sheep brain (top) and brain sectiones (bottom). The yellow lines indicate the orientation of cut sections. Blue asterisk represent the areas of gray matter. Red asterisk represent white matter areas.
The Figure 2B shows the sheep brain and sections used for measurements. The tissue was sourced locally from a butchers. The sheep were slaughtered on the day preceding the measurements. The sheep cranium was cut in half along the medial plain without damaging the brain tissue which allowed the brain to be easily removed from the cranium after delivery. The whole brain was stored at 4°C overnight prior to the commencement of the experiment. Both hemispheres were sectioned with a scalpel as indicated by yellow dashed lines. Overall, n = 129 Gy and n = 101 white matter measurements were performed on n = 2 sheep brain samples on two separate days. The examples of gray and white matter sites of brain sections are highlighted by ∗ in Figure 2B.
The raw intensity data was processed into an 8 × 8 excitation-emission matrix (EEM) using MATLAB (Matlab 2016b, Mathworks, Nattick MA, USA). The EEM contained both the diffuse reflectance spectroscopy (DRS) signal for each source/detector pair (EEM diagonal) as well as auto-fluorescence values associated with each illumination source (all EEM values above the diagonal). During the processing, the background and amplifier switching artefacts were removed. The DRS values of the EEM were then used to account for phantom optical properties for the excitation wavelengths as shown in Eq. 2 and previously described in [38]:
where
Figure 3A shows fluorescence intensity of NADH (440 nm emission) and FAD (505 nm emission) fluorophores in response to 100 1.5 ms illumination pulses from 340 to 470 nm sources. The measurements were collected from one phantom mixture containing 0.5% absorber, 16% intralipid, 100 μg/ml NADH and 10 μg/ml FAD. No photo bleaching of NADH or FAD was observed in any of the 400 phantoms tested. Figure 3B shows the raw signal collected from biological tissue. In addition to DRS and fluorescence signals, indicated by a sequence of square pulses, the raw data also included ambient illumination and detector DC offset. Both of these artefacts were amplified × 100 at various periods during an illumination cycle. For example, in the 680 nm channel (red trace) the gain remains high, 10 × 10−1 V from the start of the illumination cycle up to 2.4 ms (data-point 600). It is also evident that at low gain, the DC offsets of each channel were also different (e. g., 300, 340 and 390 nm) showed baseline amplitudes if 3 × 10⁻⁴ V, 9 × 10⁻⁴ V and 1 × 10⁻³ V, respectively.
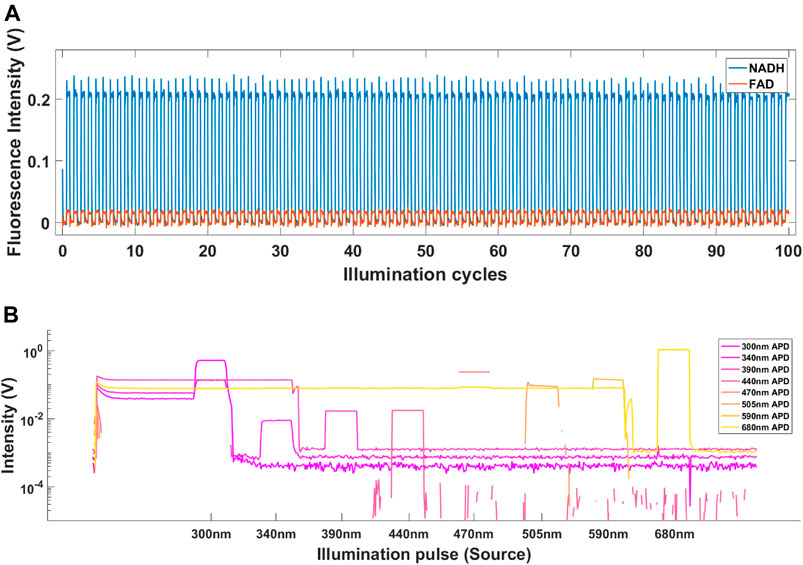
FIGURE 3. (A) The fluorescence intensity of NADH (blue) and FAD (red) in response to 100 illumination pulses from 340 to 470 nm sources measured in 440 and 505 nm channels, respectively. (B) Raw signal recorded from gray matter of sheep brain. The signal includes ambient background as well as positive and negative DC offsets caused by high amplifier gain.
Figure 4A shows the effect of increasing background illumination on light intensities collected at high and low gain settings for each illumination source. Figure 4B shows the same data after dynamic background has been subtracted. All diffuse reflectance values were noted to be of similar magnitude for all background intensities. The average measured intensity from eight illumination sources at zero ambient light and low gain was 0.045 V. Increasing the illumination intensity in stages up to 9,124 lm resulted in maximum APD signal of 0.63 V. Figure 5A shows that applying the background subtraction to this data resulted in a constant signal level of 0.044–0.045 V for all background intensities.
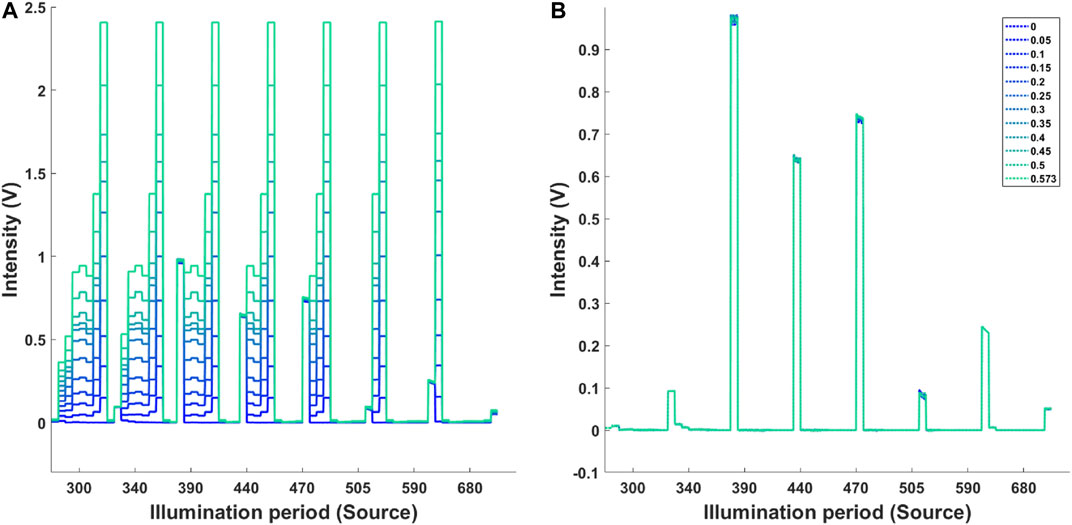
FIGURE 4. (A) Measured background intensity at high and low gain. The diffuse reflectance was measured at low gain setting. The increasing background illumination at high gain is highlighted by the colour coded plots. (B) Signal after background subtraction. Legend indicated the power of background illumination (W).
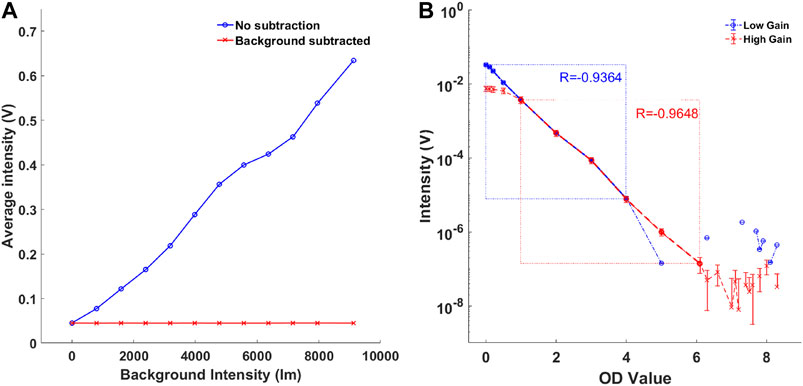
FIGURE 5. (A) The effect of background intensity on average signal intensity (blue). The background subtraction method was effective for all background intensities measured (red). (B) Comparison of TR system’s dynamic range at amplifier gain 1 (blue) and gain 100 (red).
At Gain 1 the TR system showed a linearity down to a signal level of 7.6 × 10⁻⁶ V (R = −0.934) which is consistent with the minimum detectable signal amplitude of the DAQ. The saturation of the APDs resulted in 3.9 V and was consistent with the APD’s manufacturer specification. Hence, at Gain 1, the dynamic range of the system was 7.6 × 10⁻⁶ to 3.9 V. The Gain 100 resulted in system linearity from 1.3 × 10⁻⁷ to 3.6 × 10⁻⁴ V (R = −0.9648). Hence, as shown in Figure 5B, the dynamic gain control resulted in combined dynamic range of 1.3 × 10⁻⁷ to 3.9 V.
Figures 6A,B shows the variation of laser diode power output and measured diffuse reflectance, respectively. The laser diodes show sub 1% variation in signal amplitude over the test period of 4.5 h with 505 nm diode failing to stabilize completely. The other four diode reach stable state at 2 h mark (Figure 6A). The stability of APD was shown to be significantly less. The 300 and 470 nm channels have not reached stability over the test period. In both of these channels, the signal increased by 50% while the remaining channels show signal deviation between 2 and 15% (Figure 6B).
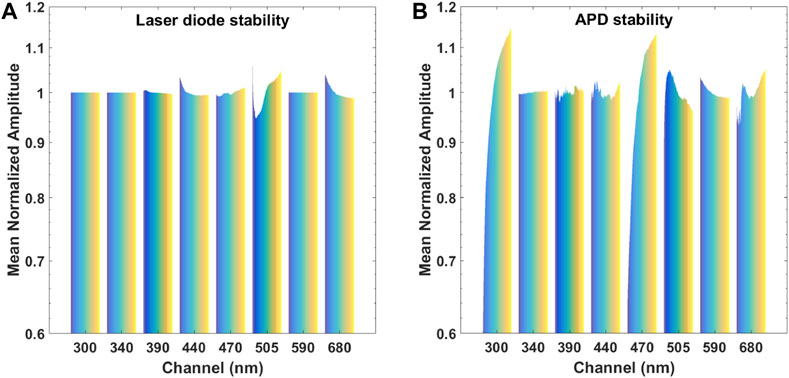
FIGURE 6. (A) The stability of laser diodes over a period of 4.5 h. Note: channels 300, 340, and 590 are LEDs, and were not measured with the photodiode. (B) The stability of APDs over a period of 4.5 h. Note: the instability of laser diodes has been accounted for in the chart.
The quantification response of the PLS regression model to predict concentrations of NADH and FAD, absorption coefficients µa and scattering coefficients µs are shown in Figures 7A–D. Based on mean squared errors generated by the PLS regression, the first six PLS components were selected to build the PLS model. The correlation coefficients R2 between the fitted response and actual values using LOOCV were 0.840, 0.981, 0.888, and 0.914 for µa, µs, FAD and NADH respectively. The detected fluorescence signals correlate linearly to the actual fluorophore concentrations.
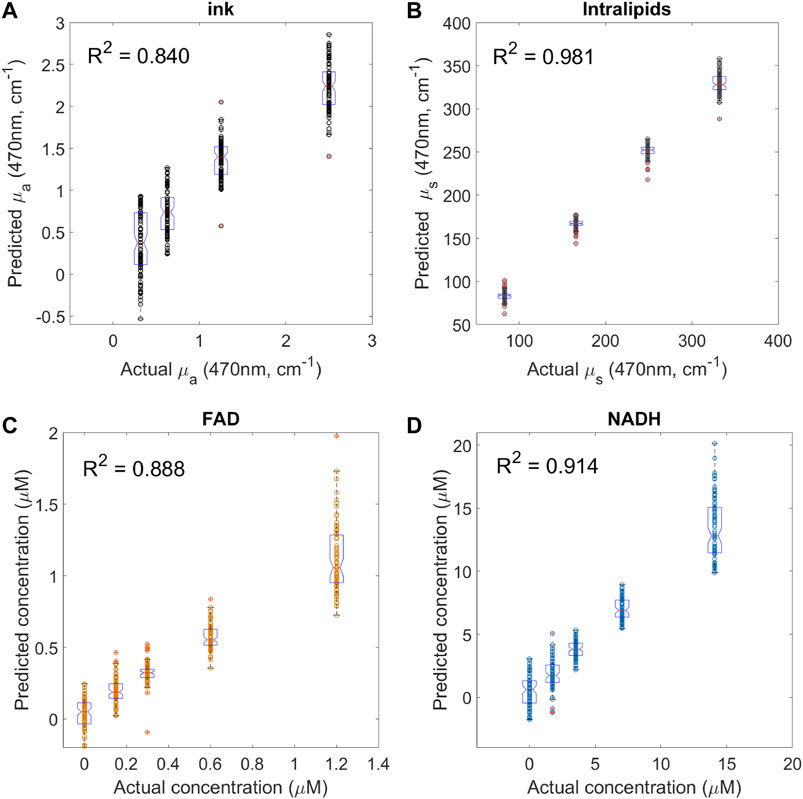
FIGURE 7. System validation using mixture of fluorophores in liquid phantoms with various optical properties. Each graph shows the prediction values versus actual values for (A) absorption coefficient using different ink volume fraction (n = 100 for each group), (B) scattering coefficient using different intralipids volume fraction (n = 100 for each group), (C) FAD (n = 80 for different FAD concentration group), and (D) NADH (n = 80 for different NADH concentration group). R2 is the correlation coefficient between the fitted responses (predicted values) and actual values using PLS regression with leave-one-out cross validation. Boxplots indicate the median value and data distribution in each group.
Figure 8 shows the average light intensities collected from white (n = 101) and gray (n = 129) matter regions of the sheep brain for 36 source detector pairs of the instrument. Using the “Classification Learner App” in Matlab, the five-fold cross-validation linear SVM was performed on this data. The SVM classified Gray and White matter with accuracy of 97.8%.
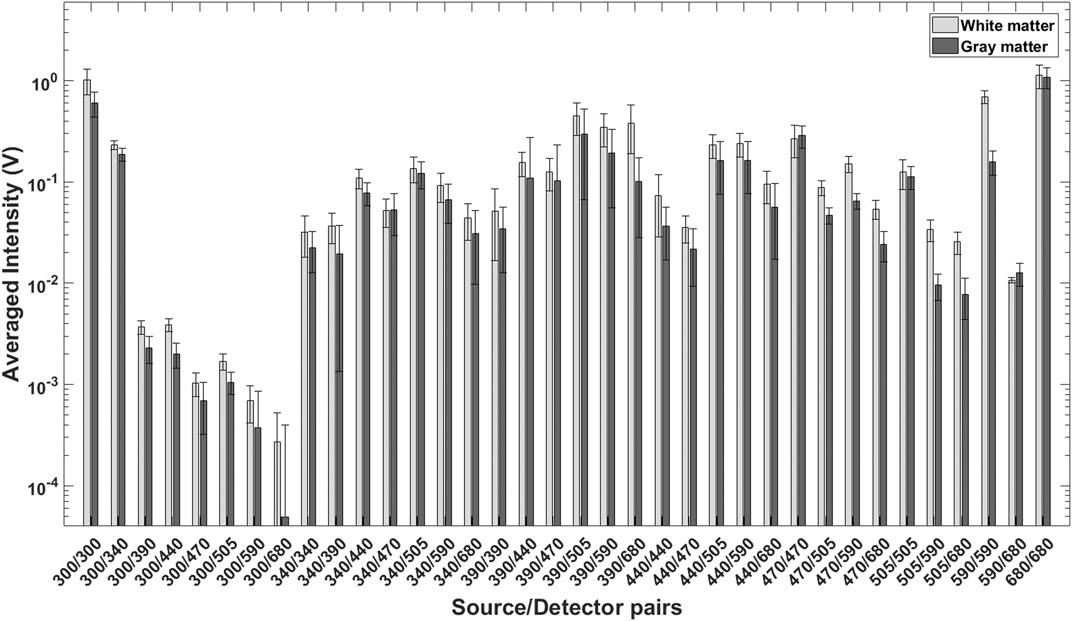
FIGURE 8. Average, mean normalized light intensities for 36 source detector pairs collected from White (n = 101) and Gray (n = 129) matter of sheep brain. This data was used for SVM classification.
The capability of an optical system to perform measurements under intense dynamic ambient illumination, such as encountered in the clinical operating rooms is paramount for acquiring quantitative data. The method of background measurement and subtraction tested showed that the average reflectance amplitude remained the same, despite increasing background illumination. It is important to point out that two, relatively small, fibre coupled halogen lamps are significantly less powerful as compared with a standard operating theater lamps. Hence, a more representative test should involve the probe in contact with a solid tissue phantom illuminated from a distance with an adjustable, powerful source with a minimum intensity of 4 × 10³ lm.
Widening the dynamic range of the system described in this manuscript was key requirement in order to be able to reliably measure the relatively high intensity diffuse reflectance signal and orders of magnitude weaker auto-fluorescence, that occurs in biological tissue.
To address this issue, the voltage output from each APD (channel) was patched through an a 1 kHz low pass filter and then through an amplifier stage with variable gain. As outlined previously, low gain was used in the channel measuring diffuse reflectance and high gain in channels measuring auto-fluorescence. Overall, the integration of passive low pass filters and the multi-channel, dynamic amplifier extended the dynamic range of the instrument, making it possible to detect optical signal with intensity in the range between 4 V and 1 × 10⁻⁷ V. It is important to point out that some of the drawbacks associated with such complexity. First, the combination of low pass filters and fast switching gain caused a temporary, large amplitude oscillation of the voltage signal in every channel immediately after the corresponding illumination source was switched off. This did not present a direct problem for this system because these oscillations stabilized within 0.75 ms, long before the next pulse from the light source, but it does highlight the limit frequency of illumination pulses. Second, to ensure precise control of illumination and gain switching, hardware synchronisation was implemented. This resulted in a secondary artefact where a short portion of the AO signal designated for modulating the light sources was observed in the recorded diffuse reflectance data. The relative duration of this artefact was approximately 150 μs followed by a short, 50 μs oscillation period. This portion of the data was omitted from the analysis but it does indicate that this system was pushing the limits of the NI DAQ chassis and the three DAQ modules. To potentially improve the quality of the data and systems dynamic range further, a custom control and data acquisition board is being built.
One of the main challenges of fluorescence based diagnostic methods is that tissue fluorescence correlates to not only the concentration of endogenous fluorophores but is also distorted by tissue absorption and scattering properties. Multiple excitation and detection bands employed in current system have the potential to improve the accuracy of intrinsic tissue fluorescence measurements by more accurately compensating for tissue absorption and scattering. Such approach could potentially improve the predicative algorithm for tissue recognition. In this work, reflectance-normalized fluorescence approach was used to compensate for the light attenuation to approach true auto-fluorescence characteristics. The performance of the instrument was evaluated using four hundred tissue-like liquid phantoms. Fluorophores used in this study were NADH and FAD, and they were premixed and added into the liquid phantom to validate the system performance. The particular challenge in this study is the system attempted to detect NADH and FAD in the mixture of low fluorophore concentration regime, and a wide range of both scattering (μs at 470 nm from 80 cm−1–350 cm−1) and absorption (μa at 470 nm from 0.3 cm−1–2.5 cm−1) have been covered. In general, the system has a good response for the estimation of FAD and NADH in tissue phantoms, as previously shown (Figures 7C,D). NADH and FAD detection deteriorated at high absorption and scattering coefficients range. The linearly correlation between predicated and actual fluorophore concentrations in the mixture fluorophores with the large variation optical properties indicate multivariate analysis, such as PLS regression, could be used as a classification method to construct predictive models from large multidimensional data sets. It is important to point out that at this stage with the current system it is unlikely that similar levels of sensitivity can be reached in actual biological tissue. Due to significant complexity of biological samples coupled with dynamic metabolic changes, such as oxidative phosphorylation, the instruments limitations (discussed below) will likely prevent it from discriminating between tumour and healthy brain tissue based on fluorophore concentration alone. Although, the SVM showed a relatively high certainty of discriminating between gray and white matter in ex vivo sheep brain, it is highly probable that this was achieved via significant differences in absorption and scattering of these tissue types, which are evident to the naked eye. Besides the fluorophore concentration, the PLS regression model accurately quantified the scattering coefficient (R2 = 0.981 in Figure 7B). The lowest correlation coefficient was observed when predicting the absorption coefficient (R2 = 0.840 in Figure 7A). The error observed in the PLS regression has likely originated from a number of sources. The first contributing factor was likely the instability of lasers/APDs, as discussed in the previous section. The second factor was the source-detector fibre distance. This distance was kept to a minimum, to allow the collection of diffuse reflectance from near-UV sources. These sources had much lower output power compared to visible laser diodes as well as wavelengths that are highly absorbed by biological tissue with high blood content. The insufficient inter-fiber distance is evident from ink (absorber) PLS plots that show overlap between predicted concentrations. It indicates that the increasing concentrations of absorber was insufficient to attenuate the more powerful, longer wavelengths to a significant degree, resulting in overlap and less prediction of absorber concentration.
The temporal stability of any measuring system is a critical requirement which ensures that measurements performed at different times can be compared reliably. The changes in signal magnitude of APDs were between +/− 1–15% for six out of eight channels while two channels failed to reach stability.
While it was possible to account for a portion of the signal variation by measuring laser source stability, it is highly probable that the instability of APDs significantly effected the performance of the system and its ability to predict fluorophore concentrations with greater accuracy.
The potential reason for large deviations in some channels could be two-fold. First, the APDs are sensitive devices that perform best in an environment free from strong, transient electromagnetic fields (EMF). Due to practical constraints, all APDs were in relatively close proximity to a number of power sources as well as LED and laser drivers. It is possible that EMF noise was coupled into the APD casing or cables carrying the signal to the DAQ. When testing the previous version of this system, it was possible to couple 50 Hz from the mains by changing the orientation of cables between the dynamic amplifier and the DAQ. A more deliberate cable management, component positioning and EMF shielding strategies are needed to eliminate the potential sources of instability, especially when translating into clinical environment. Second, the APDs used for the instrument had temperature compensation capability and it is likely that this function has failed in two of the APDs (300 and 470 nm) indicated by failure to stabilize.
The stability issues observed during this study have wider implications with respect to detection of tumour margins in a clinical setting. The tumour margins are areas that contain a “metabolic gradient” [39]. Such gradients add an additional challenge to tissue identification accuracy and require an instrument that is extremely stable at the level of its noise floor to avoid tissue miss-classification due to signal drift above or below a detection threshold.
The search for autofluorescent marker(s) of GBM, revealed several candidate molecules, including: 1) lipofuscin, 2) tryptophan and its derivatives, 3) collagens and 4) NAD(P)H (or NAD(P)H/FAD ratio). Sub-micromolar tissue levels of fluorescent vitamins such as cholecalciferol, folic acid, pyridoxine and riboflavin are most likely well below detection limits of the system described in this manuscript. It was assumed that no single molecule could unambiguously identify high grade gliomas, therefore at least two independent GBM identifiers are required. Lipofuscin, when found on the tumour surface, has been shown to serve as a risk factor of small melanocytic choroidal tumours [40]. However, this bio-molecule has low specificity as it’s levels in the brain are correlated with tissue aging and neurodegeneration [41]. Metabolism of tryptophan in gliomas strongly increases, and elevated levels of tryptophan and kynurenine become a signature of GBM [42]. Hence, the uptake of α[11C]-methyl-L-tryptophan analysed using positron emission tomography is clinically approved for GBM detection [43]. However, fluorescence signals of tryptophan, which is present in normal rat brain at 10–50 μM, or 2–10 mg/L [44] and its metabolites may be masked by stronger background signals from tryptophan residues incorporated in proteins (estimated 1.1 g/L in cells) [45]. Yet, spectroscopy analysis of tryptophan-specific autofluorescence (280 nm excitation and 300–350 nm emission) has been reported to discriminate between normal tissue and tumours [46], suggesting that tryptophan and its metabolites may still be used as a supplemental factor for GBM identification. In contrast to lipofuscin and tryptophan, collagens are not present in normal brain, except for the basement membranes of the brain meninges and blood vessels and other specialised structures. Cancer cells produce, release, interact with and remodel collagens as the principal proteins of extracellular matrix (ECM) [47]. Therefore, the development of collagen network would explicitly indicate tumorigenesis and tumour progression [48, 49]. Thus, expression by brain cells of COL6A1 gene encoding collagen VI modules, is considered as a hallmark and a prognostic factor of poor clinical outcome for GBM ([50], for review see [51]). Non-fibrillar collagens VI and XVI, fibrillar collagens I and III, and mesh-like network forming collagen IV are broadly accepted as major collagens associated with GBM [47, 49, 52, 53]. The intrinsic autofluorescence, common for all proteins containing aromatic amino acid residues (emission 250–300 nm), in collagens is complemented by the unique property to emit fluorescence at 350–450 nm upon excitation at 300–350 nm [45, 54]. Upon in vivo excitation at 340 nm collagens I and IV emit with maxima at 409 and 422 nm, respectively [55]. The “non-intrinsic” fluorescence is often attributed to the cross-linking factors hydroxylysyl pyridinoline and lysyl pyridinoline [54]. Together, the presence of collagen autofluorescence in the analysed samples can be considered the major GBM reporter. Importantly, collagen-specific signals are preserved in freshly excised tissue samples, thus facilitating method development in the ex vivo experiments. NAD(P)H fluorescence is one of the most common readouts (excited at 340 nm; emits at 450 nm) which enables snap shooting of rapidly changing metabolic state. Due to case-to-case variability, heterogeneity of cells within each tumour and high adaptability of cells to the changing environment and treatment, data on NAD(P)H levels in GBM and other gliomas are contradictive. However, mutations in the genes IDH1/2 encoding isocitrate dehydrogenases 1 and 2, found in almost 80% of grade II-III gliomas and secondary GBM in 12% of GBM patients in total [35, 36], could affect NADH/NAD+ and NADH/FAD ratios. IDH1 and IDH2, bearing mutations in RI32 and R172 residues (respectively), cannot conduct oxidation of isocitrate to α-ketoglutarate and produce NADPH. Instead, NADPH is consumed and an oncometabolite, 2-hydroxyglutarate (2-HG) is produced [56, 57]. Accumulation of 2-HG causes numerous changes in living cells, including decreased production of nicotinate phosphoribosyltransferase Naprt1 that is involved in NAD + production. As a result, one can expect a drop in total NAD(P)H fluorescence in tumours with IDH mutations. However, being highly dynamic, NAD(P)H/NAD + balance is very sensitive to microenvironment. Therefore, in ex vivo tissue samples, which will be used for optimisation of the platform, NAD(P)H signals may be mixed and artificial, and preliminary statistical data need to be collected using cell models and clinical samples in order to understand how informative it is for GBM detection.
As this study is very closely related to developing clinical systems for surgical guidance it is important to discuss the overall instrument’s ease of use and attempt to foresee potential issues in a clinical setting. The first issue was that two researchers had to be involved, one to physically hold the probe and the other to control the LabView software and start the measurement. Ideally, the person holding the probe should be able to trigger the measurement by pushing a button on the probe or in the other hand. This will make the data collection much more streamlined, especially since the naming and saving data files was automated to remove mistakes in naming large volumes of files. It will be a task for a future product development team to design a probe that would be accepted by clinicians. The second issue was the data display. At this stage of development, it was not possible for researchers to co-relate tissue type with the data plots displayed on the screen as there were no obvious indicators in real time. All the data processing had to be performed off-line. Any such system in the clinical setting would have to be equipped with a probe that can be moved across brain tissue without damage, while maintaining contact as well as capability to perform statistical analysis in real time and a visible indicator of tissue type or method of demarcating the “cut line”.
Having showed the potential of this combined tissue auto-fluorescence and DRS tool to quantify biomarkers, the DRS and auto-fluorescence measurement system described in this manuscript was built using mostly off-the-shelf components. This form factor and the complexity of wiring multiple channels through a number of stages is more suited to a bench system, rather than a clinical instrument. Overall reduction in complexity and size is possible by placing the amplifier and data processing circuitry on a single circuit board. APDs can be replaced with silicon photo-multipliers (SiPMT) with 1 mm2 footprint. The dichroic mirrors can be manufactured as a single component, with multiple dichroic surfaces, while the standard bandpass filters can be diced to match the SiPMT footprint. Stacking such components with a minimal air-gap on the PCB has the potential to create a miniaturized spacial wavelengths separator that is much faster than a conventional spectrometer, capable of simultaneous measurements of diffuse reflectance and auto-fluorescence under ambient light. Another critical aspect that miniaturization should address is the interference from external power sources or other equipment. The resulting embedded system must be built with sufficient shielding to minimize EMF coupling. Particular attention needs to be paid to the lengths and routing of the connections between surface mounted detectors and amplifiers. Since this is a multi-channel system, the data digitization relies on use of multiplexers and significant effort must be put into this aspect of data acquisition the minimize ghosting. Another important aspect of future studies is the type of tissue samples that the integrated system must be tested on. Specifically, DRS and auto-fluorescence data should be collected from areas of tissue margins. This will determine if the achieved stability and sensitivity is sufficient to detect significantly reduced concentrations of fluorophores in the margins. Finally, any miniaturized system could benefit from a series of pre-clinical studies on a xenographt animal model. Such a model will provide, in vivo healthy, diseased and tumour margin DRS/auto-fluorescence data. Although, ethical implications of such study must be considered due to requirement for a relatively large number of samples (animals) to account for inherent biological variations.
We have demonstrated a system that can quantify several fluorophores in tissue phantoms with highly varying optical properties, and that the system is developed in a way for straight forward miniaturisation to facilitate clinical adaption. This multi-spectral system consisted of eight illumination sources and eight APDs with variable gain output. The ability control the gain resulted in an increased the dynamic range and made it possible to measure relatively strong diffuse reflectance signals simultaneously with weak fluorescence. The modulation of multi-spectral illumination source allowed the measurements to be carried out under ambient light because it was possible to measure background level continuously, during each measurement. Finally, the system was tested on 400 liquid tissue phantoms with a large range of absorber and scatterer concentration mixed with two fluorophores, FAD and NADH. A linear correlation between true and predicted fluorophore concentrations indicate that a multivariate analysis, such as PLS, could be used as a classification method to construct predictive models in the future study. The system was also tested on biological tissue and showed high a relatively degree of classification accuracy that was based on tissue absorption and scattering properties, rather than fluorophore concentration.
The raw data supporting the conclusion of this article will be made available by the authors, without undue reservation.
KG—Corresponding author. Responsible for system design, assembly and programming as well as collection of data and SVM analysis. HL—Preparation of liquid ToF and LOOCV analysis. CL—Collocation of DRS and fluorescence data from tissue optical phantoms. AZ—In depth research into fluorophore selection. RB—Electronic design consultant SA-E—Principal Investigator, supervising the development, characterisation and sample studies with the system, as well as having inputs to the manuscript writing.
This work is supported by a research grant from the Science Foundation Ireland (SFI) under Grant Number SFI/15/RP/2828.
The authors declare that the research was conducted in the absence of any commercial or financial relationships that could be construed as a potential conflict of interest.
All claims expressed in this article are solely those of the authors and do not necessarily represent those of their affiliated organizations, or those of the publisher, the editors and the reviewers. Any product that may be evaluated in this article, or claim that may be made by its manufacturer, is not guaranteed or endorsed by the publisher.
The authors would like to sincerely thank Dr. Katarzyna Komolibus for helping with MATLAB batch file professing and proof reading the manuscript.
1. Ellingson BM, Bendszus M, Boxerman J, Barboriak D, Erickson BJ, Smits M. Consensus Recommendations for a Standardized Brain Tumor Imaging Protocol in Clinical Trials. Neuro Oncol (2015) 17:1188–98. doi:10.1093/neuonc/nov095
2. Capper D, Capper D, Jeibmann A, Habel A, Paulus W, Troost D. Addressing Diffuse Glioma as a Systemic Brain Disease With Single-Cell Analysis. Arch Neurol (2012) 69:523–6. doi:10.1001/archneurol.2011.2910
3. Hervey-Jumper SL, Berger MS. Maximizing Safe Resection of Low- and High-Grade Glioma. J Neurooncol (2016) 130:269–82. doi:10.1007/s11060-016-2110-4
4. Mischkulnig M, Kiesel B, Borkovec M, Wadiura LI, Benner D, Hosmann A. High Interobserver Agreement in the Subjective Classification of 5‐Aminolevulinic Acid Fluorescence Levels in Newly Diagnosed Glioblastomas. Lasers Surg Med (2020) 52:814–21. doi:10.1002/lsm.23228
5. Cramer SW, Chen CC. Photodynamic Therapy for the Treatment of Glioblastoma. Front Surg (2020) 6:1–11. doi:10.3389/fsurg.2019.00081
6. Sanai N, Berger MS. Glioma Extent of Resection and its Impact on Patient Outcome. Neurosurgery (2008) 62:753–66. doi:10.1227/01.neu.0000318159.21731.cf
7. Stupp R, Hegi ME, Mason WP, van den Bent MJ, Taphoorn MJ, Janzer RC. Effects of Radiotherapy With Concomitant and Adjuvant Temozolomide Versus Radiotherapy Alone on Survival in Glioblastoma in a Randomised Phase III Study: 5-year Analysis of the EORTC-NCIC Trial. Lancet Oncol (2009) 10:459–66. doi:10.1016/S1470-2045(09)70025-7
8. Picart T, Berhouma M, Dumot C, Pallud J, Metellus P, Armoiry X. Optimization of High-Grade Glioma Resection Using 5-ALA Fluorescence-Guided Surgery: A Literature Review and Practical Recommendations from the Neuro-Oncology Club of the French Society of Neurosurgery. Neurochirurgie (2019) 65:164–77. doi:10.1016/j.neuchi.2019.04.005
9. Yamamoto J, Kitagawa T, Miyaoka R, Suzuki K, Takamatsu S, Saito T. 5-Aminolevulinic Acid: Pitfalls of Fluorescence-Guided Resection for Malignant Gliomas and Application for Malignant Glioma Therapy. J Uoeh (2020) 42:27–34. doi:10.7888/juoeh.42.27
10. Stummer W, Pichlmeier U, Meinel T, Wiestler OD, Zanella F, Reulen H-J. Fluorescence-guided Surgery With 5-Aminolevulinic Acid for Resection of Malignant Glioma: a Randomised Controlled Multicentre Phase Iii Trial. Lancet Oncol (2006) 7:392–401. doi:10.1016/s1470-2045(06)70665-9
11. Sanai N, Polley M-Y, McDermott MW, Parsa AT, Berger MS. An Extent of Resection Threshold for Newly Diagnosed Glioblastomas. J Neurosurg (2011) 115:3–8. doi:10.3171/2011.2.jns10998
12. Hadjipanayis CG, Widhalm G, Stummer W. What Is the Surgical Benefit of Utilizing 5-Aminolevulinic Acid for Fluorescence-Guided Surgery of Malignant Gliomas? Neurosurgery (2015) 77:663–73. doi:10.1227/neu.0000000000000929
13. Richter JCO, Haj-Hosseini N, Hallbeck M, Wårdell K. Combination of Hand-Held Probe and Microscopy for Fluorescence Guided Surgery in the Brain Tumor Marginal Zone. Photodiagnosis photodynamic Ther (2017) 18:185–92. doi:10.1016/j.pdpdt.2017.01.188
14. Zhao S, Wu J, Wang C, Liu H, Dong X, Shi C. Intraoperative Fluorescence-Guided Resection of High-Grade Malignant Gliomas Using 5-Aminolevulinic Acid-Induced Porphyrins: A Systematic Review and Meta-Analysis of Prospective Studies. PloS one (2013) 8:e63682. doi:10.1371/journal.pone.0063682
15. Lin W-C, Toms SA, Johnson M, Jansen ED, Mahadevan-Jansen A. In Vivo Brain Tumor Demarcation Using Optical Spectroscopy. Photochem Photobiol (2001) 73:396–402. doi:10.1562/0031-8655(2001)073<0396:ivbtdu>2.0.co;2
16. Haj-Hosseini N, Richter J, Andersson-Engels S, Wårdell K. Optical Touch Pointer for Fluorescence Guided Glioblastoma Resection Using 5-Aminolevulinic Acid. Lasers Surg Med (2010) 42:9–14. doi:10.1002/lsm.20868
17. Butte PV, Fang Q, Jo JA, Yong WH, Pikul BK, Black KL. Intraoperative Delineation of Primary Brain Tumors Using Time-Resolved Fluorescence Spectroscopy. J Biomed Opt (2010) 15:027008. doi:10.1117/1.3374049
18. Brydegaard M, Haj-Hosseini N, Wårdell K, Andersson-Engels S. Photobleaching-Insensitive Fluorescence Diagnostics in Skin and Brain Tissue. IEEE Photon J. (2011) 3:407–21. doi:10.1109/jphot.2011.2141656
19. Richter JCO, Haj-Hosseini N, Andersson-Engel S, Wårdell K. Fluorescence Spectroscopy Measurements in Ultrasonic Navigated Resection of Malignant Brain Tumors. Lasers Surg Med (2011) 43:8–14. doi:10.1002/lsm.21022
20. Valdés PA, Jacobs V, Harris BT, Wilson BC, Leblond F, Paulsen KD. Quantitative Fluorescence Using 5-Aminolevulinic Acid-Induced Protoporphyrin Ix Biomarker as a Surgical Adjunct in Low-Grade Glioma Surgery. J Neurosurg (2015) 123:771–80. doi:10.3171/2014.12.jns14391
21. Shadfan A, Pawlowski M, Wang Y, Subramanian K, Gabay I, Ben-Yakar A. Design and Fabrication of a Miniature Objective Consisting of High Refractive Index Zinc Sulfide Lenses for Laser Surgery. Opt Eng (2016) 55:025107. doi:10.1117/1.OE.55.2.025107
22. Ansari R, Zhang EZ, Desjardins AE, Beard PC. Miniature All-Optical Flexible Forward-Viewing Photoacoustic Endoscopy Probe for Surgical Guidance. Opt Lett (2020) 45:6238–41. doi:10.1364/OL.400295
23. Brydegaard M, Merdasa A, Jayaweera H, Ålebring J, Svanberg S. Versatile Multispectral Microscope Based on Light Emitting Diodes. Rev Scientific Instr (2011) 82:123106. doi:10.1063/1.3660810
24. Xie H, Xie Z, Mousavi M, Bendsoe N, Brydegaard M, Axelsson J. Design and Validation of a Fiber Optic Point Probe Instrument for Therapy Guidance and Monitoring. J Biomed Opt (2014) 19:071408. doi:10.1117/1.jbo.19.7.071408
25. Bradley RS, Thorniley MS. A Review of Attenuation Correction Techniques for Tissue Fluorescence. J R Soc Interf (2006) 3:1–13. doi:10.1098/rsif.2005.0066
26. Müller MG, Georgakoudi I, Zhang Q, Wu J, Feld MS. Intrinsic Fluorescence Spectroscopy in Turbid Media: Disentangling Effects of Scattering and Absorption. Appl Opt (2001) 40:4633. doi:10.1364/ao.40.004633
27. Valdés PA, Leblond F, Kim A, Wilson BC, Paulsen KD, Roberts DW. A Spectrally Constrained Dual-Band Normalization Technique for Protoporphyrin IX Quantification in Fluorescence-Guided Surgery. Opt Lett (2012) 37:1817. doi:10.1364/ol.37.001817
28. Weersink R, Patterson MS, Diamond K, Silver S, Padgett N. Noninvasive Measurement of Fluorophore Concentration in Turbid Media With a Simple Fluorescence/Reflectance Ratio Technique. Appl Opt (2001) 40:6389. doi:10.1364/ao.40.006389
29. Valdes PA, Juvekar P, Agar NYR, Gioux S, Golby AJ. Quantitative Wide-Field Imaging Techniques for Fluorescence Guided Neurosurgery. Front Surg (2019) 6:31. doi:10.3389/fsurg.2019.00031
30. Huang Z, Shi S, Qiu H, Li D, Zou J, Hu S. Fluorescence-Guided Resection of Brain Tumor: Review of the Significance of Intraoperative Quantification of Protoporphyrin IX Fluorescence. Neurophoton (2017) 4:011011. doi:10.1117/1.nph.4.1.011011
31. Saager RB, Cuccia DJ, Saggese S, Kelly KM, Durkin AJ. Quantitative Fluorescence Imaging of Protoporphyrin IX Through Determination of Tissue Optical Properties in the Spatial Frequency Domain. J Biomed Opt (2011) 16:126013. doi:10.1117/1.3665440
32. Jermyn M, Gosselin Y, Valdes PA, Sibai M, Kolste K, Mercier J. Improved Sensitivity to Fluorescence for Cancer Detection in Wide-Field Image-Guided Neurosurgery. Biomed Opt Express (2015) 6:5063. doi:10.1364/boe.6.005063
33. Mousavi M, Moriyama LT, Grecco C, Saito Nogueira M, Svanberg K, Kurachi C. Photodynamic Therapy Dosimetry Using Multiexcitation Multiemission Wavelength: Toward Real-Time Prediction of Treatment Outcome. J Biomed Opt (2020) 25:1–14. doi:10.1117/1.JBO.25.6.063812
34. Lu H, Grygoryev K, Bermingham N, Jansen M, O’Sullivan M, Nunan G. Combined Autofluorescence and Diffuse Reflectance for Brain Tumour Surgical Guidance: Initial Ex Vivo Study Results. Biomed Opt Express (2021) 12:2432–46. doi:10.1364/boe.420292
35. Deng L, Xiong P, Luo Y, Bu X, Qian S, Zhong W. Association between Idh1/2 Mutations and Brain Glioma Grade. Oncol Lett (2018) 16:5405–9. doi:10.3892/ol.2018.9317
36. Parsons DW, Jones S, Zhang X, Lin JC-H, Leary RJ, Angenendt P. An Integrated Genomic Analysis of Human Glioblastoma Multiforme. science (2008) 321:1807–12. doi:10.1126/science.1164382
37. Gunther J, Lu H, Andersson-Engels S. Combination of Diffuse Reflectance and Transmittance Spectroscopy to Obtain Optical Properties of Liquid Phantoms. Opt Eng (2020) 59:024109. doi:10.1117/1.oe.59.2.024109
38. Valdés PA, Leblond F, Jacobs VL, Wilson BC, Paulsen KD, Roberts DW. Quantitative, Spectrally-Resolved Intraoperative Fluorescence Imaging. Sci Rep (2012) 2:798. doi:10.1038/srep00798
39. Randall EC, Lopez BGC, Peng S, Regan MS, Abdelmoula WM, Basu SS. Localized Metabolomic Gradients in Patient-Derived Xenograft Models of Glioblastoma. Cancer Res (2020) 80:1258–67. doi:10.1158/0008-5472.can-19-0638
40. Shields CL, Shields JA, Kiratli H, De Potter P, Cater JR. Risk Factors for Growth and Metastasis of Small Choroidal Melanocytic Lesions. Ophthalmology (1995) 102:1351–61. doi:10.1016/s0161-6420(95)30864-0
41. Moreno-García A, Kun A, Calero O, Medina M, Calero M. An Overview of the Role of Lipofuscin in Age-Related Neurodegeneration. Front Neurosci (2018) 12:464. doi:10.3389/fnins.2018.00464
42. Kesarwani P, Prabhu A, Kant S, Kumar P, Graham SF, Buelow KL. Tryptophan Metabolism Contributes to Radiation-Induced Immune Checkpoint Reactivation in Glioblastoma. Clin Cancer Res (2018) 24:3632–43. doi:10.1158/1078-0432.ccr-18-0041
43. Lukas RV, Juhász C, Wainwright DA, James CD, Kennedy E, Stupp R. Imaging Tryptophan Uptake With Positron Emission Tomography in Glioblastoma Patients Treated With Indoximod. J Neurooncol (2019) 141:111–20. doi:10.1007/s11060-018-03013-x
44. Fernstrom JD, Wurtman RJ. Brain Serotonin Content: Physiological Dependence on Plasma Tryptophan Levels. Science (1971) 173:149–52. doi:10.1126/science.173.3992.149
45. Wiśniewski JR, Hein MY, Cox J, Mann M. A "proteomic Ruler" for Protein Copy Number and Concentration Estimation Without Spike-In Standards. Mol Cel Proteomics (2014) 13:3497–506. doi:10.1074/mcp.M113.037309
46. Sordillo LA, Sordillo PP. Optical Spectroscopy of Tryptophan Metabolites in Neurodegenerative Disease. Neurophotonics Biomed Spectrosc (2019) 137–57. doi:10.1016/b978-0-323-48067-3.00007-x
47. Mammoto T, Jiang A, Jiang E, Panigrahy D, Kieran MW, Mammoto A. Role of Collagen Matrix in Tumor Angiogenesis and Glioblastoma Multiforme Progression. Am J Pathol (2013) 183:1293–305. doi:10.1016/j.ajpath.2013.06.026
48. Bellail AC, Hunter SB, Brat DJ, Tan C, Van Meir EG. Microregional Extracellular Matrix Heterogeneity in Brain Modulates Glioma Cell Invasion. Int J Biochem Cel Biol (2004) 36:1046–69. doi:10.1016/j.biocel.2004.01.013
49. Payne LS, Huang PH. The Pathobiology of Collagens in Glioma. Mol Cancer Res (2013) 11:1129–40. doi:10.1158/1541-7786.mcr-13-0236
50. Turtoi A, Blomme A, Bianchi E, Maris P, Vannozzi R, Naccarato AG. Accessibilome of Human Glioblastoma: Collagen-Vi-Alpha-1 Is a New Target and a Marker of Poor Outcome. J Proteome Res (2014) 13:5660–9. doi:10.1021/pr500657w
51. Gregorio I, Braghetta P, Bonaldo P, Cescon M. Collagen Vi in Healthy and Diseased Nervous System. Dis models Mech (2018) 11:dmm032946. doi:10.1242/dmm.032946
52. Makarov M, Storozheva M, Borovkova N. Collagen Fiber Autofluorescence Level in Evaluating the Biological Properties of Tissue Grafts. Mod Tech Medicie (2017) 9:83. doi:10.17691/stm2017.9.2.10
53. Senner V, Ratzinger S, Mertsch S, Grässel S, Paulus W. Collagen Xvi Expression Is Upregulated in Glioblastomas and Promotes Tumor Cell Adhesion. FEBS Lett (2008) 582:3293–300. doi:10.1016/j.febslet.2008.09.017
54. Richards-Kortum R, Sevick-Muraca E. Quantitative Optical Spectroscopy for Tissue Diagnosis. Annu Rev Phys Chem (1996) 47:555–606. doi:10.1146/annurev.physchem.47.1.555
55. McGee S, Mirkovic J, Mardirossian V, Elackattu A, Yu C-C, Kabani S. Model-based Spectroscopic Analysis of the Oral Cavity: Impact of Anatomy. J Biomed Opt (2008) 13:064034. doi:10.1117/1.2992139
56. Strickland M, Stoll EA. Metabolic Reprogramming in Glioma. Front Cel Dev Biol (2017) 5:43. doi:10.3389/fcell.2017.00043
Keywords: diffuse reflectance spectroscopy, auto-fluorescence, bio-marker concentration, surgical guidance, tissue optical phantoms
Citation: Grygoryev K, Lu H, Li CL, Zhdanov AV, Burke R and Andersson-Engels S (2021) Multi-Spectral Clinical Prototype for Fluorophore Detection. Front. Phys. 9:724962. doi: 10.3389/fphy.2021.724962
Received: 14 June 2021; Accepted: 09 August 2021;
Published: 31 August 2021.
Edited by:
Shu-Chi A. Yeh, Wellman Center for Photomedicine, United StatesReviewed by:
Benedict Edward Mc Larney, Memorial Sloan Kettering Cancer Center, United StatesCopyright © 2021 Grygoryev , Lu , Li , Zhdanov , Burke and Andersson-Engels . This is an open-access article distributed under the terms of the Creative Commons Attribution License (CC BY). The use, distribution or reproduction in other forums is permitted, provided the original author(s) and the copyright owner(s) are credited and that the original publication in this journal is cited, in accordance with accepted academic practice. No use, distribution or reproduction is permitted which does not comply with these terms.
*Correspondence: Konstantin Grygoryev , a29uc3RhbnRpbi5ncnlnb3J5ZXZAdHluZGFsbC5pZQ==
Disclaimer: All claims expressed in this article are solely those of the authors and do not necessarily represent those of their affiliated organizations, or those of the publisher, the editors and the reviewers. Any product that may be evaluated in this article or claim that may be made by its manufacturer is not guaranteed or endorsed by the publisher.
Research integrity at Frontiers
Learn more about the work of our research integrity team to safeguard the quality of each article we publish.