- 1CEA, DAM, DIF, Bruyères-le-Châtel, France
- 2UPS, CEA, LMCE, Bruyères-le-Châtel, France
- 3Department of Astrophysical and Planetary Sciences, University of Colorado, Boulder, CO, United States
- 4Laboratory for Atmospheric and Space Physics, University of Colorado, Boulder, CO, United States
- 5Space Science and Applications Group, Los Alamos National Laboratory, Los Alamos, NM, United States
- 6Department of Physics and Astronomy, University of Iowa, Iowa City, IA, United States
- 7School of Physics and Astronomy, University of Minnesota, Minneapolis, MN, United States
We study the propagation and attenuation of lightning-generated whistler (LGW) waves in near-Earth space (L ≤ 3) through the statistical study of three specific quantities extracted from data recorded by NASA’s Van Allen Probes mission, from 2012 to 2019: the LGW electric and magnetic power attenuation with respect to distance from a given lightning stroke, the LGW wave normal angle in space, and the frequency-integrated LGW refractive index. We find that LGW electric field wave power decays with distance mostly quadratically in space, with a power varying between -1 and -2, while the magnetic field wave power decays mostly linearly in space, with a power varying between 0 and -1. At night only, the electric wave power decays as a quadratic law and the magnetic power as a linear law, which is consistent with electric and magnetic ground measurements. Complexity of the dependence of the various quantities is maximal at the lowest L-shells (L < 1.5) and around noon, for which LGW are the rarest in Van Allen Probes measurements. In-space near-equatorial LGW wave normal angle statistics are shown for the first time with respect to magnetic local time (MLT), L-shell (L), geographic longitude, and season. A distribution of predominantly electrostatic waves is peaked at large wave normal angle. Conversely, the distribution of electromagnetic waves with large magnetic component and small electric component is peaked at small wave normal angle. Outside these limits, we show that, as the LGW electric power increases, the LGW wave normal angle increases. But, as the LGW magnetic power increases, the LGW wave normal angle distribution becomes peaked at small wave normal angle with a secondary peak at large wave normal angle. The LGW mean wave-normal angle computed over the whole data set is 41.6° with a ∼24° standard deviation. There is a strong MLT-dependence, with the wave normal angle smaller for daytime (34.4° on average at day and 46.7° at night). There is an absence of strong seasonal and continental dependences of the wave-normal angle. The statistics of the LGW refractive index show a mean LGW refractive index is 32 with a standard deviation of ∼26. There is a strong MLT-dependence, with larger refractive index for daytime 36) than for nighttime (28). Smaller refractive index is found during Northern hemisphere summer for L-shells above 1.8, which is inconsistent with Chapman ionization theory and consistent with the so-called winter/seasonal anomaly. Local minima of the mean refractive index are observed over the three continents. Cross-correlation of these wave parameters in fixed (MLT, L) bins shows that the wave normal angle and refractive index are anti-correlated; large (small) wave normal angles correspond with small (large) refractive indexes. High power attenuation during LGW propagation from the lightning source to the spacecraft is correlated with large refractive index and anti-correlated with small wave normal angle. Correlation and anti-correlation show a smooth and continuous path from one regime (i.e. large wave normal angle, small refractive index, low attenuation) to its opposite (i.e. small wave normal angle, large refractive index, large attenuation), supporting consistency of the results.
Introduction
Cloud-to-ground lightning flashes emit powerful electromagnetic radiation over a broad spectrum of electromagnetic waves, including waves in very low frequency (VLF) band (∼100 Hz - ∼20 kHz), which propagates with successive reflections within the Earth-ionosphere waveguide. Some of this power escapes into the magnetosphere in the form of VLF lightning-generated whistlers (LGW) (e.g. [1,2]). These waves travel in the magnetosphere from their injection point to the satellite location along different paths, with or without one or more magnetospheric reflections at the northern and/or southern hemisphere [3]. Lightning-generated whistlers interact through resonant wave-particle interactions with the trapped electrons in the inner magnetosphere (L ≤ 3), causing pitch angle diffusion and ultimately the scattering of those electrons into the atmosphere (e.g. [4–7]; [8,9, 51]). In doing so, LGW diminish the radiation levels encountered by satellites in low Earth orbits. Pitch angle diffusion is quantified through quasi-linear diffusion coefficients (e.g. [10]), which are directly proportional to the wave (electric or magnetic) power (defined as the square of the wave amplitude). Dependence of pitch angle diffusion coefficients on parameters treated in this article, including wave power but also wave-normal angle are discussed in Albert [11] (see also [12]). Recent derivation of LGW diffusion coefficients was carried by Albert et al. [9] based on the low Earth orbit (LEO) Detection of Electro-Magnetic Emissions Transmitted from Earth-quake Regions (DEMETER) micro-satellite [13, 14] measured LGW power in Colman and Starks [15] and the computation by ray-and-power tracing of the propagation of LGW through the ionosphere and into the magnetosphere [16]. Our work attempts to bypass the numerical complexity and cost of ray tracing simulation through the derivation of empirical attenuation laws (cf. section Electric and Magnetic Wave Power Attenuation Laws). More references on radiation belt physics and wave-particle interactions can be found in the review of Ripoll et al. [17].
The first detailed knowledge and variation of the LGW power in space [6] originates from measurements from the Combined release and Radiation Effects Satellite (CRRES), which sampled a limited range of magnetic local times. At that time, conversion from electric to magnetic field was made assuming a zero wave-normal angle (Eq. 3 of [6]) due to lack of knowledge of the LGW wave-normal angle. Our study will show that, in reality, LGW mean wave-normal angle is 42° with a standard deviation of 24°.There exists a strong and complex dependence of LGW properties including wave normal angle with respect to L-shell, magnetic local time (MLT), longitude and seasons. Median power spectral density measured by both the DEMETER satellite and the Van Allen Probes are discussed in Zahlava et al. [18]. Electric and magnetic field wave amplitudes of LGW measured by the two probes of the NASA Van Allen Probes mission (initially named the Radiation Belt Storm Probes (RBSP) mission) in the near-equatorial magnetic region during their entire mission, from 2012 to 2019, have been analyzed in Ripoll et al. [19]. Their study revealed strong dayside ionospheric damping of the LGW electric field. LGW amplitudes drop below L = 2, contrary to the Earth’s intense equatorial lightning activity (e.g [20, 21]) when mapped onto the projection of the Earth’s magnetic field lines at 100 km [22]. A related study focuses on the quantification of the electromagnetic power radiated on Earth and in space by extremely powerful lightning strokes, called superbolts [23].
In this study, we focus on LGW electromagnetic power propagation and attenuation in the near-Earth space, defined here as L < 3 within ± 20°degrees of the magnetic equator. We use observations from the two Van Allen Probes over their entire mission in order to assess LGW electric and magnetic wave power, similarly to Ripoll et al. [19, 23], although here we increase the planarity threshold criteria for the selected LGW in order to improve the accuracy of the wave-normal angle computation. Our analysis uses the World-Wide Lightning Location Network (WWLLN) databases (e.g. Dowden et al., 2002; [24–26]) established using ground VLF receiver stations. WWLLN provides the location and estimated VLF energy of the lightning source for waves later sensed in space by the Van Allen Probes, as is commonly done (19, 23, 27, 28, 50). Combining both datasets, we generate empirical electric and magnetic attenuation laws according to the distance (between the lightning source on Earth and the closest magnetic footprint of the spacecraft) and energy of the lightning source identified by WWLLN. We also present and discuss, for the first time, LGW wave-normal angle statistics from Van Allen Probes and their variation with respect to L-shell, magnetic local time (MLT), longitude and season. From the knowledge of the electric and magnetic field amplitudes as well as the wave-normal angle, we are able to generate statistics of the measured (frequency-integrated) LGW refractive index as defined from the ratio of the magnetic amplitude with the electric amplitude. Correlations between attenuation law parameters, wave normal angles and refractive index are also determined.
Materials and Methods
Van Allen Probes Data
Data from the Van Allen Probes mission [29] are used in this study. The Van Allen Probes are twin spin-stabilized spacecraft (A and B) that orbited Earth in similar geotransfer orbits (nominal perigee and apogee altitudes of ∼618 km and ∼5.8 Earth radii, respectively). The spacecraft launched in August of 2012. Probes A and B were decommissioned in July 2019 and October 2019, respectively. During their mission, they completed more than three full precessions about MLT. Their orbital period was ∼9 h, and spin period ∼11 s. Their orbits stayed within ∼20° of the geomagnetic equator.
This study makes use of data from the Electric and Magnetic Field Instrument Suite and Integrated Science (EMFISIS) instrument suite [30] and the Electric Fields and Waves (EFW) instrument [31]. The specific data used include the DC-coupled magnetic field from the Fluxgate Magnetometer (FGM) and AC-coupled magnetic fields from the Search Coil Magnetometer (SCM). EMFISIS calculates spectra and cross-spectra on-board using the SCM magnetic field data and electric field data from the EFW sensors as inputs. Differential electric field measurements are used. Specifically, we use the sum of the power spectra from the two spin-plane axes (orientated within ∼15°degrees of to perpendicular to the spacecraft-Sun line). Spin-axis electric field data are not used because of contamination by broadband spikes due to frequent shadowing of the anti-sunward sensor by spacecraft structures. All three orthogonal axes of SCM data are used. The survey spectral data consist of power spectral densities averaged over the first 0.5 s of every 6 s. The native sample rate of these data is 35,000 Samples/s. The on-board calculated spectra and cross-spectra span ∼2 Hz to ∼11 kHz, distributed in 65 pseudo-logarithmically spaced frequency bins.
Data Processing
The Van Allen Probes’ data described above are processed to isolate signatures of VLF plasma waves associated with lightning. This processing has several steps that are described in detail in Ripoll et al. [19] and only briefly summarized here: 1) noise floors are derived following a similar procedure to Malaspina et al. [32], 2) a signal to noise ratio (SNR) metric is used to determine whether or not it is possible to conclusively identify VLF plasma waves in a given frequency bin at a given time, 3) VLF wave observations are considered possible for SNR ≥5 magnetic field wave power spectral density data and SNR ≥13 electric field wave power spectral density data, 4) contaminated measurements of electric fields on Probe A by spacecraft-generated noise in several frequency bins (e.g. 2,243, 3555, 3988, 5633, and 7,956 Hz) are not used in this study.
To quantify the power of lightning-related VLF waves, we integrate the electric (magnetic) wave power spectral density between ∼2 kHz and ∼11 kHz, multiplied by the frequency bandwidth in each bin, to obtain a single frequency-integrated electric (magnetic) power for each sample. All wave data beyond L = 3 are excluded from consideration due to lower lightning activity and a decay of the lightning power as ∼1/L [22]. This study uses electric and magnetic field measurements made after October 1, 2012. We do not use magnetic power spectra after May 31, 2018 on Probe B and after June 30, 2018 on Probe A. We do not use electric power spectra data after June 30, 2019 for Probe B and after June 30, 2016 for Probe A. Data from thruster firings, intense spacecraft charging, and EFW calibration bias sweeps are always excluded.
Method for Associating Lightning-Generated Whistlers Observed by Van Allen Probes With Lightning Sources on Earth
We use the WWLLN database (e.g Dowden et al., 2002; [24–26,33]) to obtain the lightning location on Earth and its estimated energy. For each measurement {i} of the Van Allen Probes (abbreviated RBSP in the following equation subscripts) survey spectral database for which both the electric and magnetic power are defined, we seek all lightning strokes in the WWLLN files that existed during dt around their time of occurrence, tRBSP{i}, and could have caused the wave, with dt defined by:
The expression of tdelay as a function of the Van Allen Probes L-shell,
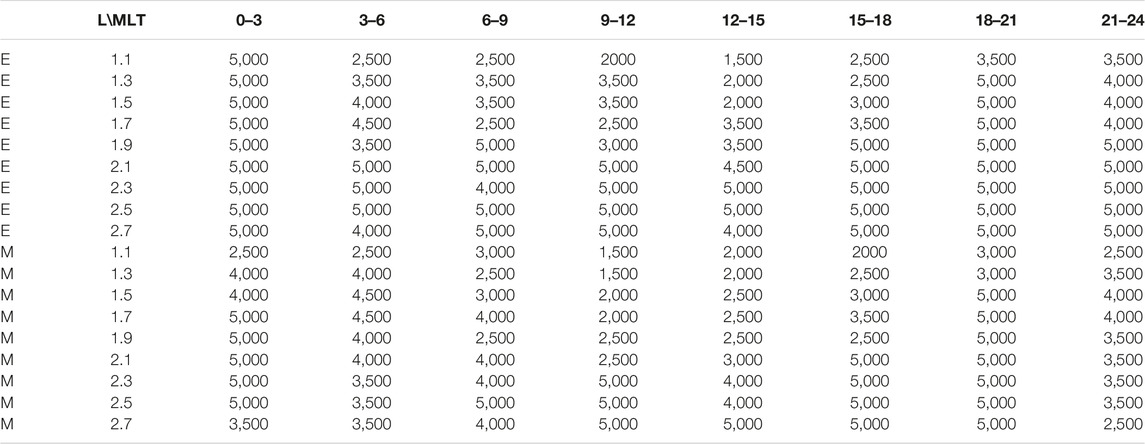
TABLE 1. Maximal distance, dmax (in km) used for fitting the (M) magnetic power distribution and the (E) electric power distribution for a given L-MLT bin (for all seasons).
The full Van Allen Probes VLF wave database has 9,561 997 (8,346 691) survey measurements, but a large number of them fall below the SNR thresholds. Among these measurements, we find ∼2.5 M (∼1.4 M) electric (magnetic) measurements that exceed the respective SNR threshold and allow a power to be defined. Of these ∼1.8 M (∼0.9 M) are associated with a unique WWLLN source satisfying
Results
Electric and Magnetic Wave Power Attenuation Laws
We assume that the wave power (normalized by the lightning energy) follows a decaying power law as it travels from its source to the satellite footprint. Two applications of these empirical attenuation laws are 1) to provide a predictive law for the electric and magnetic VLF wave power that will be sensed in space (near the equator) at a given L-shell and MLT (equivalently LT) for a given season from a source of energy (W in kJ) located at d km from the magnetic footprint and 2) to provide a way to rescale lightning power at a given location in space from WWLLN activity to derive the mean lightning magnetic power over a drift period and to be able to compute mean LGW effects on trapped electrons [22].
Such a power law with respect to the distance from the stroke to the closest spacecraft magnetic footprint 4) was derived by Burkholder et al. [28] based on the measurements of the electric wave power by the Communication/Navigation Outage Forecast System satellite (C/NOFS). The power law derived by Burkholder et al. [28], with power, −2.34, is valid for nighttime MLT (see also [27]). Similar power laws have been also derived from DEMETER observations for daytime and nighttime in [50], with a power of −1.76 (less attenuation than Burkholder’s law). Ripoll et al. [23] derived specifically attenuation power laws of superbolt electric power both on the ground (power of −2) and in space (power of −1.7) from Van Allen Probes as well as an attenuation power law for superbolt magnetic power in space from Van Allen Probes (power between −1.2 and −1.6).
The Burkholder et al. [28] power law is used in Ripoll et al. [22] to connect the total lightning power on Earth (see a world-wide map in their Figure 1(top)) with an estimation of the electromagnetic power that should be sensed by the Van Allen Probes (see the map in their Figure 1(middle)). One parameter of this law was later modified in Ripoll et al. [19] to include MLT dependence extracted from the day/night differences observed in Van Allen Probes LGW measurements in order to better agree with these observations and to account for the strong effect of the dayside ionosphere on lightning wave attenuation (e.g. [34]). None of these aforementioned laws had a dependence on L-shell while the L-shell dependence of both the electric and magnetic power is anticipated to be strong and complex (e.g. [35]). None of the previously derived empirical power laws had either a fine MLT (or LT) resolution or a seasonal variation, while both parameters have a significant importance on the wave amplitude [19]. Fiser’s and Burkholder’s attenuation laws also concern only the electric wave power but not the magnetic power (not measured by C/NOFS, for instance). Current understanding is that VLF wave magnetic power decays linearly on Earth [36], while VLF wave electric power decays quadratically both on Earth and in space (23, 27, 28, 50).
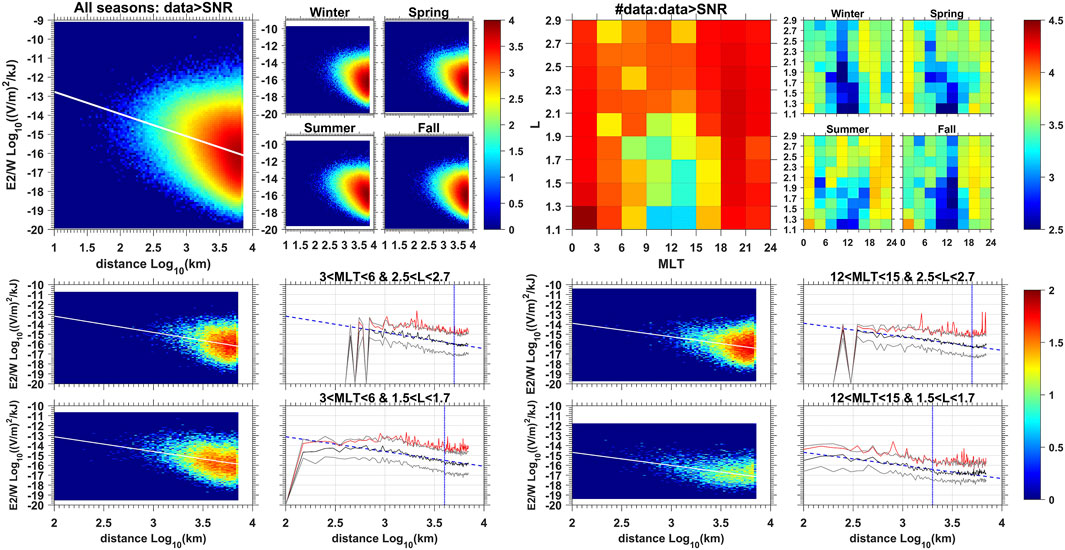
FIGURE 1. (top left) Statistics of LGW Electric power (V/m)2 (in log10 of number of events), rescaled by WWLLN lightning energy (kJ) and plotted versus distance between the lightning location (from WWLLN) and the spacecraft for the full database of Van Allen Probe A and B mission (2012–2019), with full distribution and distribution per season. The distribution is spread over many orders of magnitude due to the different behaviors in (L, MLT) (top right) Number of events (in log10) sorted by (L, MLT) and (season, L, MLT) (bottom) Same statistics (in log10) as top left but limited to (left) a night bin of at MLT = [3,6] and L = [2.5,2.7] and [1.5,1.7] and (right) a day bin at MLT = [12,15] and L = [2.5,2.7] and [1.5,1.7]. White line plots represent linear regression (left bottom panels only). Line plots represent (black) the median, (grey) the upper (84%) and lower (16%) quartiles defining one sigma, (red) the mean, (blue) the linear regression which equates the median. We find the mean equates the median plus one sigma. The vertical blue dashed line indicates the maximal distance used for the fits given in Table 1.
The goal of this article is thus to derive empirical electric and magnetic LGW attenuation laws with a dependence on local time, L-shell, and seasons from Van Allen Probes and WWLN measurements. The Van Allen Probes measurements are near-equatorial measurements, within ±20° latitude, so that the attenuation laws may differ from the ones derived from LEO satellites due to the propagation between the footprint and the satellite position at the magnetic equator. Attenuation laws are taken to have the common form
with a law for each of the electric or magnetic power,
Figures 1, 2 (top left) give the global distribution of E2/W and B2/W with respect to the distance d to the WWLLN lightning location. The distribution is spread over many orders of magnitude, too many to make the mean or any regression law to be relevant. This is in agreement with the wide standard deviation shown in Burkholder et al. [28]. The wide spread is caused by mixing measurements taken at all (L, MLT, s) and indicates that there is too much variation if a single law is derived without differentiating for L-shell, MLT, and seasons. When separation in (L, MLT) is applied, as shown in the bottom row of Figures 1, 2, the variability is reduced significantly. The top-right panels of Figures 1, 2 confirm that the resolution (i.e. number of events per bin) remains sufficient for relevant statistics. The smallest data set (few hundreds of events) is found at the lowest L-shells (L < 1.5) and around noon, for which LGW are the rarest in Van Allen Probes measurements [19].

FIGURE 2. Same as Figure 1 for the LGW magnetic power (in nT2).
Interestingly, these statistics show that the mean (red line plot in Figures 1, 2 bottom) of the distribution is equal to the median (black line plot) plus one standard deviation (grey line plot) at a given distance for all (L, MLT) bins (only shown for four bins in Figures 1, 2 bottom row). This is a property of log-normal distributions and could thus indicate the distribution follows a log-normal law. The regressions with respect to distance in log-log space (blue line plot) generally agree with and fit with the median of the distribution. Regressions are performed up to a maximal distance, dmax (L,MLT) (vertical dashed line in Figures 1, 2) after which we see the distribution becomes flat (as visible in Figures 1, 2).
Statistics are binned by (L, MLT, s) and a power law following Eq. 1 is fitted for each bin, yielding the α(L, MLT, s) and
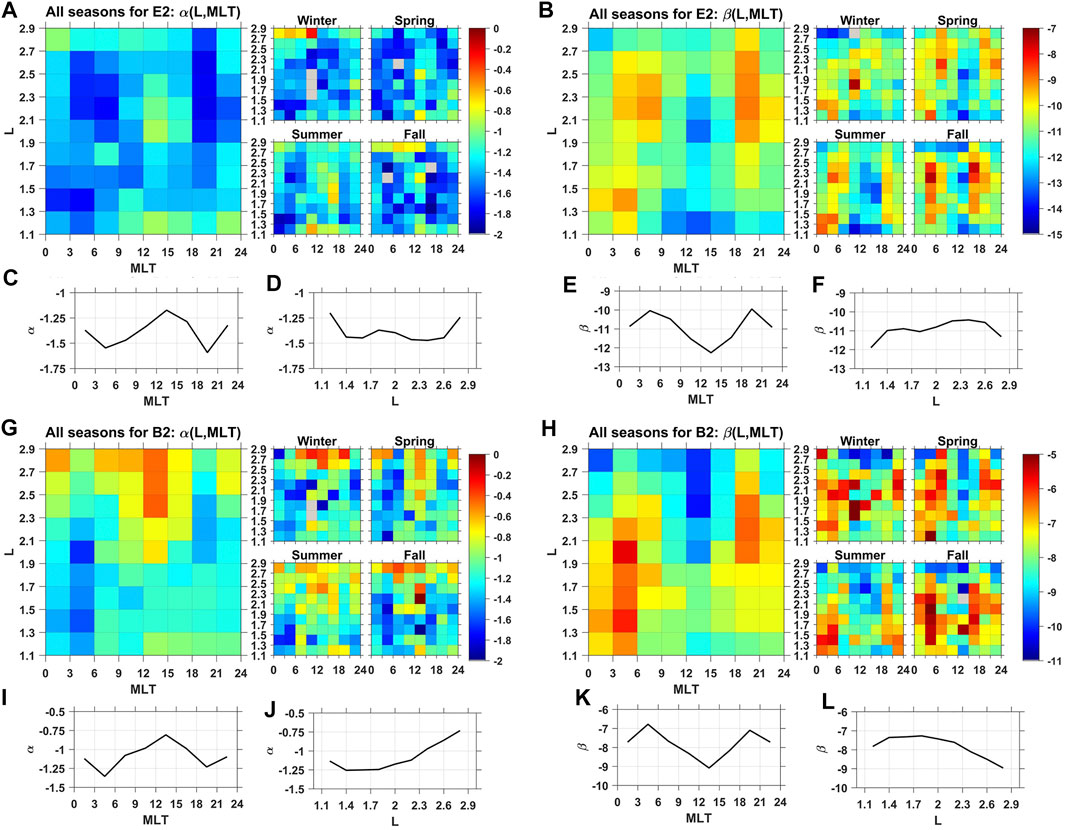
FIGURE 3. (A–F) Electric and (G-I) magnetic attenuation law parameters (A,G) α and (B,H) β parameters of the attenuation laws for (A,B) (E2/W) (D) and (G,H) (B2/W) (D) attenuation laws. Unidimentional plots show the average with respect to (C,E,I,K) L-shell and (D,F,J,L) MLT of the (C,D,I,J) α and (E,F,K,L) β parameters. Decay of E2/W follows more a quadric law, with ∼−2<α<∼−1 (blue to green in a). Decay of B2/W follows more a linear law, with ∼−1<α<∼0 (green to red in g). Day/night difference is well-marked. The α and β parameters behave oppositely in MLT as shown in C,E,I,K.
Statistics of the Wave-Normal Angle of Lightning-Generated Whistlers Observed by the Van Allen Probes
The wave normal angle is the angle between the wave vector of a given emitted LGW at a frequency, f, and the magnetic field vector at the point of observation. In a homogeneous/isotropic medium, the wave normal angle points in the direction of propagation of the wave energy. In the magnetosphere, which is an inhomogeneous/anisotropic medium, the wave energy propagates in the ray direction, which differs from the direction pointed by the wave normal angle (e.g. [3]).
LGW wave normal angles are taken from Level 4 EMFISIS data. Their computation relies on the Singular Value Decomposition method [37, 38], which requires high wave planarity, applied on on-board calculated cross-spectral data. Data described in section Materials and Methods 2 and in the subsection Electric and Magnetic Wave Power Attenuation Laws of the section Results 3 are thus down-selected such that the LGW planarity, P(f), remains above 0.5 for each frequency bin. This leads to a slightly reduced set of 9,324,651 values compared with the database used in section Electric and Magnetic Wave Power Attenuation Laws. In order to compute the wave normal angle, both electric and magnetic components have to be defined simultaneously and be above their respective SNR thresholds. This reduces the time period of the data to November 1, 2012 to May 31, 2018 for Probe B and to November 1, 2012 to June 30, 2016 for Probe A. Taking then both electric and magnetic power above SNR reduces the data to 1,781,179 measurements (∼20% of the wave power database). Such a large reduction in number is expected due to the low number of lightning-generated VLF waves in space caused by their natural occurrence rate on Earth, explaining the large number of values having low SNR. Lightning occurrence rate is seven stroke per second according to WWLLN (e.g. [22]), which measures the strongest strokes reaching space, and ∼7 times more (∼50 #/s) observed by the Lightning Imaging Sensor on board the TRMM satellite (e.g., [20, 39]). The mean amplitude of the electric field measurements that pass the planarity and SNR thresholds is 48.1 μV/m, with a standard deviation of 132 μV/m and median of 28.5 μV/m. The minimum (threshold) electric field amplitude associated with the noise level is 2 μV/m (cf [32]. for the noise floor definition). The sample mean of the magnetic field distribution is 3.77 pT with a standard deviation of 6.23 pT and the median is 2.16 pT. The minimum (threshold) magnetic field amplitude associated with the noise level is 0.5 pT. Differences between these sample statistics and the ones in Ripoll et al. [19] are due to 1-the change of planarity threshold from 0.2 to 0.5 (without great impact), two- the absence of considering the zeros (measurements with data below the SNR threshold) for both E and B (i.e. the sample statistics in this article are conditioned on the signals passing the SNR threshold whereas the statistics in the previous work are not) in order to be able to compute the wave-normal angle. The last change causes the mean magnetic power to be ∼3 times larger on average than in Ripoll et al. [19]. Percentile and associated values of the statistics are given in Table 2.
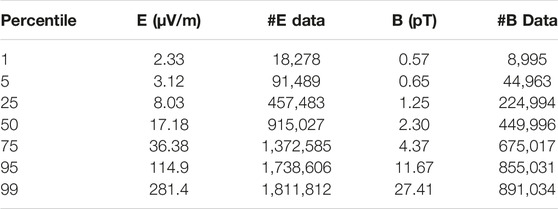
TABLE 2. electric and magnetic field threshold values and number of electric and magnetic field data for a given percentile of the data.
The wave normal angle as a function of frequency for a single wave is further processed by integration over frequency, from fmin = 2 kHz to fmax = 12 kHz, using a power weighted integral,
Figure 4 bins the power-averaged wave normal angle (
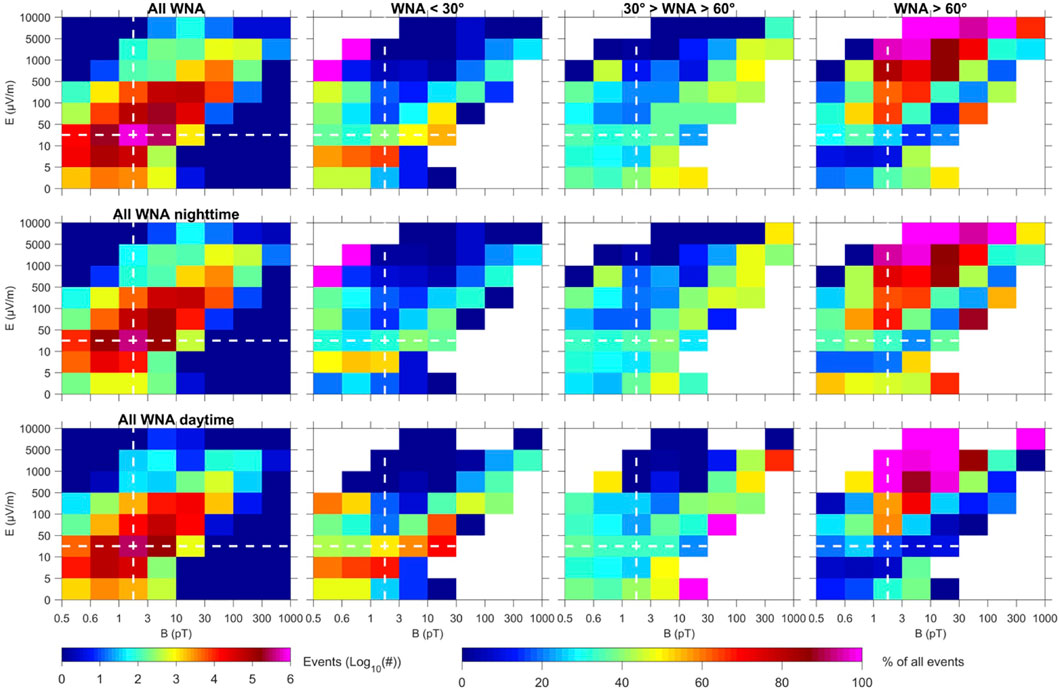
FIGURE 4. Distributions of the wave-normal angle with respect to electric field and magnetic field amplitudes for (column 1) all (
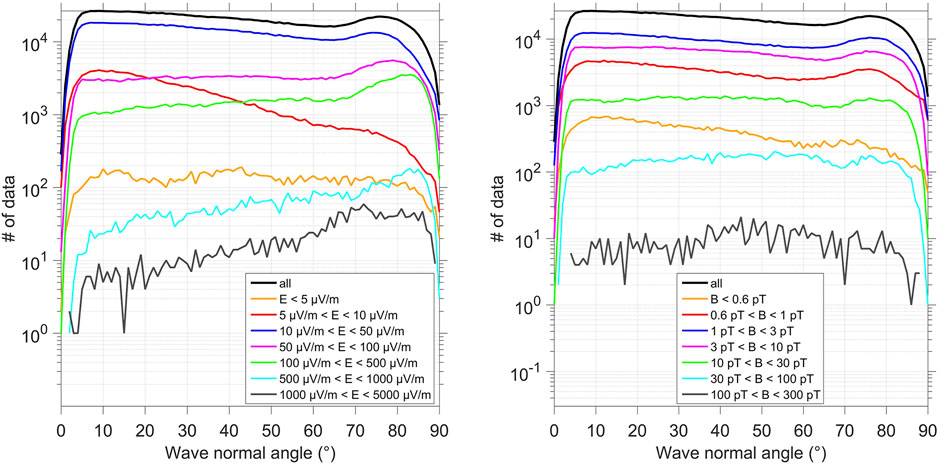
FIGURE 5. Distribution (log10) of wave normal angle values sorted with respect to (left) the electric amplitude and (right) the magnetic amplitude for different bins of amplitude.
To further investigate the variation of the wave normal angle with respect to the wave properties, we determine the statistics of electrostatic waves, defined such that their electric amplitude is large, i.e. values are above the 50 percentile (cf. Table 1), and their magnetic amplitude is small, i.e. values are below the 50 percentile. Similarly, we define a subpart of electromagnetic waves such that they have a large magnetic amplitude (above the 50 percentile) and a small electric amplitude (below the 50 percentile). These two double conditioned distributions are presented in Figure 6. Note also for the discussion on the refractive index in section 3.3 that the electrostatic limit implies a low refractive index (low B/E ratio) and the electromagnetic waves with both large/small magnetic/electric amplitudes implies a high refractive index (large B/E ratio). Figure 6 unambiguously shows large wave-normal angles are preferred for electrostatic waves. Conversely, electromagnetic waves with a large magnetic amplitude and small electric amplitude primarily have small wave-normal angles. However, the plots in Figure 6 represent only a small portion of the total data: 11% of the waves are electrostatic and 13% are electromagnetic waves using the definition above. The distributions of Figure 5 are thus made more complex by inclusion of data for which E and B are both of the same order (as shown in Figure 4). In other words, electrostatic LGW are more oblique and electromagnetic LWG are more field aligned. Another quantity to explore is the proportion of electrostatic waves at day and night. The dashed-line distributions of Figure 6 show 75% of electrostatic waves occur for nighttime and 43% of the electromagnetic waves with a large magnetic power and small electric power occur for daytime. These nighttime distributions determine the shape of the total distribution with respect to wave-normal angle. For daytime (not shown), and although either the electric or magnetic component are above the average value, the distribution develops a small tail of the opposite behavior with respect to wave normal angle. This signifies the dense daytime atmosphere complicates the distributions. With about twice more lightning for daytime than for nighttime, one reason could be that more different waves are locally mixed and sensed.
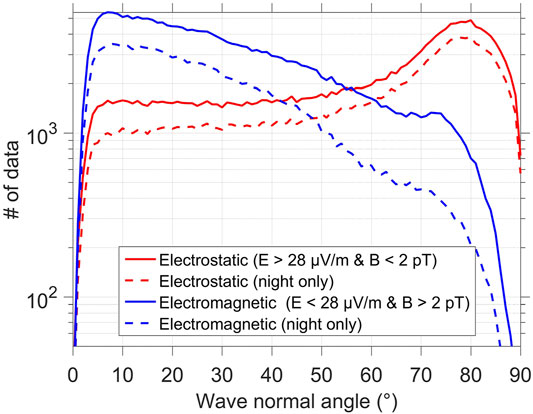
FIGURE 6. Distribution (log10) of wave normal angle values for (red) electrostatic and (blue) electromagnetic waves. Electrostatic (electromagnetic) waves are more oblique (field-aligned). Dashed line is the distribution for nighttime only.
Full statistics are presented in Figure 7 with a column table of graphic duos. Each duo has a large map depicting the Van Allen Probes mean wave normal angle and a lower right auxiliary map depicting data coverage. Columns correspond to four seasons, and rows show the Van Allen Probes mean wave normal angle marginalized over MLT (i.e., plotted versus longitude and L-shell), longitude, and L-shell, respectively. Statistics are generated per 10° longitude, 0.1L, 3 months, and 0.25 MLT. Such statistics can directly be used in the computation of pitch angle diffusion coefficients (e.g. [7]; [40]; [49]) that are used afterward in Fokker-Planck codes for space weather predictions. Although Figure 7 presents average values, the high (L, MLT, s) resolution of Figure 7 is auspicious for event-driven simulations of pitch angle diffusion (e.g. [40, 42, 51]) as one can choose the average conditions for an event occurring at a given (L, MLT) for a given season.
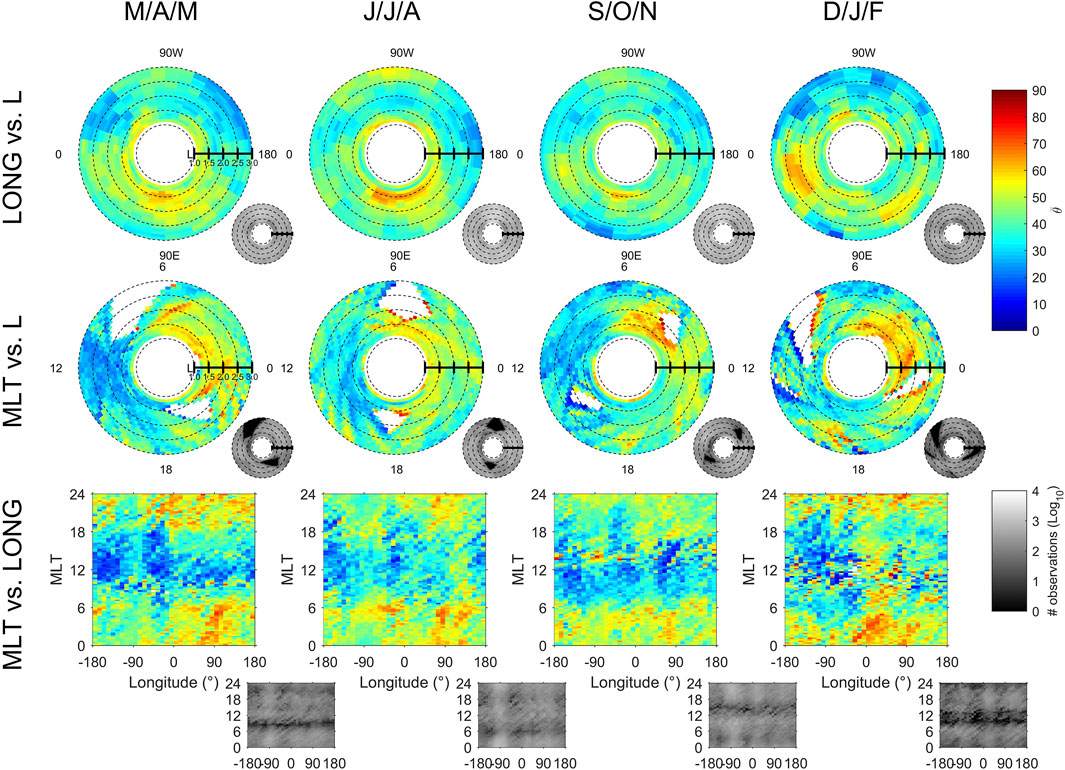
FIGURE 7. Column table of graphic pairs. Each pair has a large map depicting the Van Allen Probes mean wave-normal angle (
Wave normal angles cover the whole range from 0 to 90° in Figure 7. White regions are the rare regions not covered during the ∼7 years of the Van Allen Probes mission. Assuming a zero wave-normal angle (as in Eq. (3) of [6]) in the conversion from CRRES electric to magnetic field to generate LGW magnetic power cannot be justified from the simple observation point of view. Larger wave-normal angles are found at lower L-shells (but not only), with an overall complex L-shell dependence. Larger wave-normal angles at lower L-shells seem to be consistent with the magnetic field being more oblique to the ionospheric density gradient at lower L. Over America (90 W°), the wave normal angle is rather field aligned, mostly below 40° for L > 1.5, with smaller values in winter and larger in summer (Figure 7 top row). On the contrary, wave normal angles are large over Africa (20 E°) and Asia (120 E°) in winter. The strong diurnal dependence with the wave normal angle smaller for daytime is the most apparent variation (Figure 7 middle and bottom rows). This is confirmed in Figure 8 in which more global averages are plotted. Daytime LGW (6–17 MLT) are more field-aligned and nighttime LGW (18–5 MLT) are more oblique, by up to 20° on average. The statistics is oriented toward smaller wave normal angle on average for daytime since we just showed (cf. Figure 5) that small electric amplitude of LGW are predominantly field aligned. Wave normal angles of LGW are similarly larger during nighttime because larger electric amplitude are propagated in space during the night (cf. Figure 1 in [19]), which shifts the wave normal angle statistics toward large wave normal angles (from Figure 5). Next section will address the variation of B/E. The fact that the LGW wave normal distribution sorted by magnetic amplitude has two peaks seems to indicate that the magnetic amplitude does not strongly correspond to the value of the wave-normal angle. The LGW mean wave-normal angle computed over the whole data set is 41.6° (34.4° at day and 46.7° at night), a ∼12° difference between day and night on average, and its median is 39.1° (29.7° at day and 47.3° at night). The standard deviation is: 24.5° (22.8° at day and 24.6° at night).
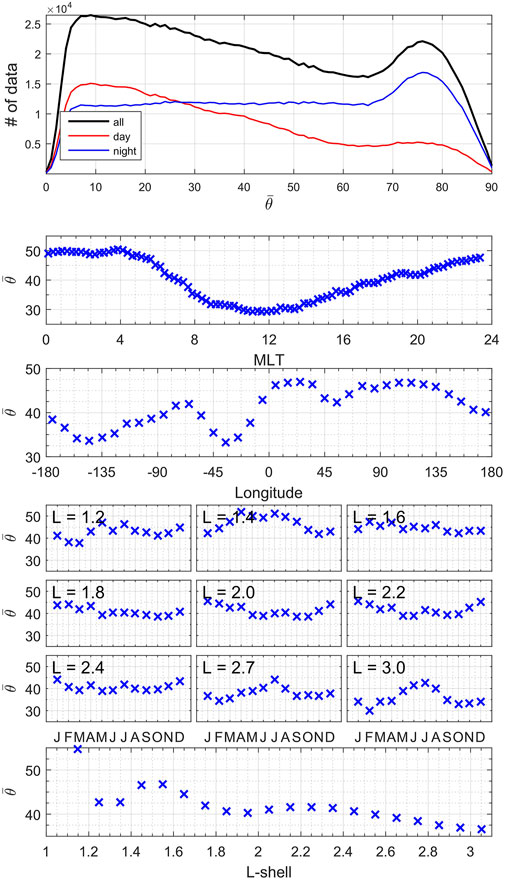
FIGURE 8. (first panel) Distributions of the wave normal angle (
There is an absence of strong seasonal dependence of the wave-normal angle in Figures 7, 8. This should be compared with the dependence of E (and B) shown in Figure 1 (and 2) of Ripoll et al. [19], where it was shown that a seasonal dependence is evident for the electric amplitude, with larger electric amplitude during Northern hemisphere summer. This earlier work might lead one to expect larger wave normal angles in Northern hemisphere summer. We do see larger wave normal angle in Northern hemisphere summer at some L-shells (L ≤ 1.4 and for L ≥ 2.7), but not all of them. The seasonal dependence of the magnetic amplitude is much weaker than the electric amplitude, with only a slight increase in Northern hemisphere summer (cf. Figure 2 in [19]). The combination of both leads to wave-normal angle statistics without an emerging clear seasonal dependence.
The continental dependence is well marked for both the LGW electric and magnetic amplitudes with larger amplitudes over the American (90 W°), African (20 E°), and Asian/Australian continents (120 E°) (Figures 1, 2 of [19]). Both electric and magnetic amplitudes being large over continents, this cannot skew the wave-normal angle statistics predominantly toward either large or small wave-normal angles. This causes an undetermined behavior of the wave normal angle statistics over continents in Figure 7 with LGW wave normal angle that can be as large over seas than over land.
Statistics of the Refractive Index of Near-Equatorial Magnetospheric Plasma When Lightning-Generated Whistlers are Observed by the Van Allen Probe
The refractive index, µ, is defined by µ(ω, θ, L) = c×k (ω, θ, L)/ω, where θ is the wave normal angle, c is the speed of light, k is the wave number, and ω = 2πf is the wave pulsation for a frequency f [41]. In general and using cold plasma theory, the refractive index is only expressed in terms of the ambient plasma density, Ne(L), in which a wave of frequency, f, travels with a wave normal angle θ(f) within a given background magnetic field. That way µ = µ(f, θ, Ne(L)) with µ that is proportional to Ne(L). The refractive index is then determined from the ambient media only and whistler-mode wave electric and magnetic components can be computed, for instance, by ray tracing (e.g. [3]). Thanks to cold plasma theory, the refractive index of whistler-mode waves can also be written as a function of E and B when the wave is known. Such refractive index becomes then a probe of the local environment. For parallel waves,
Here, we will compute
The advantages of selecting only field aligned waves is double. First, the law is significantly more complex for general wave-normal angles as it involves the full dispersion relation [41]. Second, the validity of the SVD method requires the plane wave approximation, which does not apply for large wave normal angle [38]. This leads to the choice of computing the refractive index only for small wave normal angles. The refractive index statistics presented and discussed in Figures 9, 10 below constitute an improvement of the refractive index published in the Supplementary Information of Ripoll et al. [19] (Figures S4 and S5) in which the refractive index was also computed with the use of µ∼B/E but without filtering for small wave-normal angle because wave-normal data was unavailable at that time. Comparing both allows to understand the bias caused by large wave-normal angle in the statistics of Figures S4 and S5 of Ripoll et al. [19].
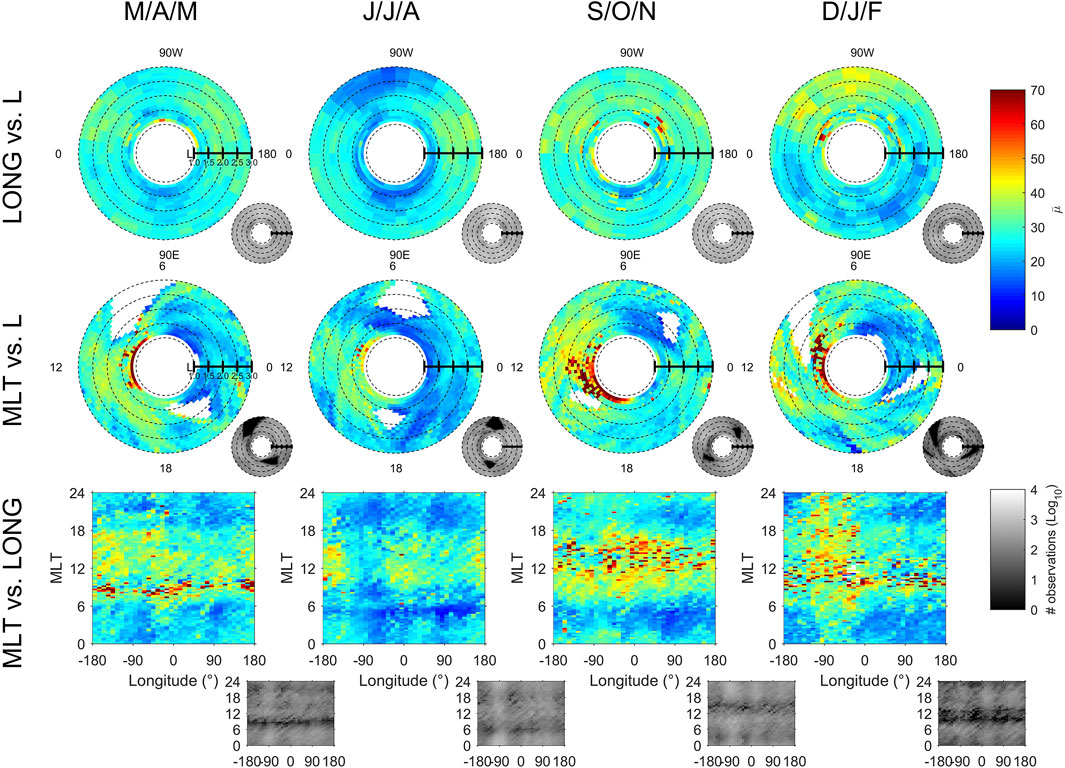
FIGURE 9. Column table of graphic pairs. Each pair has a large map depicting the Van Allen Probes refractive index,
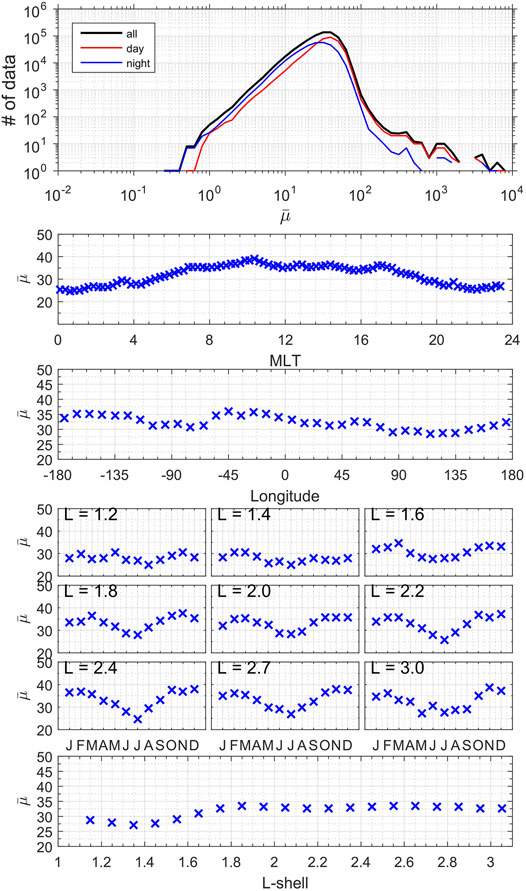
FIGURE 10. (first panel) Distributions of the refractive index (
Refractive index statistics are presented with respect to (L, MLT, Longitude, seasons) in Figure 9 (same format as Figure 7). The most apparent difference is the diurnal dependence. There is larger refractive index for daytime than for nighttime (Figure 9, middle/bottom rows), with highest indexes in Northern hemisphere Fall for daytime. This is consistent with µ∼Ne(L) and a higher electron density for daytime. There is no clear continental dependence visible in Figure 9 (both E and B that are large over continents). Largest refractive indexes are found over the continental North America and its coastal regions (20–120 W) during winter (Figure 9 first row) and smallest refractive index are found over the same geographic region during summer. If one expects higher electron density in Northern hemisphere summer than in Northern hemisphere winter from Chapman ionization theory, this result is inconsistent with µ∼Ne(L). However, this result becomes consistent with what is referred as the winter anomaly. The winter (a.k.a seasonal) anomaly occurs when the electron density in the F2 layer of the ionosphere is not controlled by the solar zenith angle, which leads to an electron density abnormally greater in winter than in summer, as we observe. This anomaly is widely reported in the literature (e.g. [43] and references in it; [44, 45]). The winter anomaly is stronger during solar maximum period and almost nonexistent at solar minimum [46], with our data (2012–2018) covering indistinctly a range of solar activity (solar maximum from 2012 to 2016).
Figure 10 presents more global statistics (same format as Figure 8). The mean refractive index of LGW varies between 25–30 at night and 40–45 at day, consistent with µ∼Ne(L). For comparison, refractive indexes between 10 and 100 are considered for LGW in Bortnik et al. [3]. There is a well-marked seasonal variation with smaller refractive index (by a factor ∼1.5–2) during summer for L-shells above 1.8. An extremum in summer is consistent with the LGW electromagnetic power which peaks in August (L ≥ 1.8) and Earth lightning activity. However, a minimum of refractive index during summer is only consistent with the seasonal anomaly discussed above. The mean continental dependence remains complex but it shows local minima, between ∼30 and ∼35 are reached over the three continents, at 90W°, 20 E° and 120°E. The mean annual refractive index shows two regimes of variation with respect to L-shell. There is first a decay with respect to L-shell decreasing for L-shells below 2. This decay has to be related to the observed decay of both E and B at L < 2 (Figure 3 in [19]) that is attributed to a difficulty of lightning VLF waves to penetrate, or/and to propagate, or/and to remain at low L-shells. The mean refractive index also decays with respect to L-shell increasing from L = 2 to L = 3 as both E and B do [19]. Mean refractive index computed over the whole data set is 32.2 (35.7 at day and 28.0 at night) with a standard deviation of 26 (27.3 at day and 23.6 at night). Median refractive index is 30.1 (34.9 at day and 26.2 at night).
Discussion
This section is devoted to the cross-comparison of the above quantities based on the recognition that both L and MLT are determinant parameters in order to perform a synthesis of the various observations. Figure 11 represents the wave normal angle and the refractive index on a (MLT,L) grid similarly to the attenuation laws shown in Figure 3. Plotting the refractive index as a function of the wave normal angle for a given (MLT,L) bin in Figure 11 (bottom) shows a distinct high anti-correlation between both, with a high Pearson correlation coefficient R2 = -80% (-89% if waves below L = 1.3 are excluded), with small wave normal angle found at large refractive index (or equivalently large ratio of B over E) and vise-versa. This is consistent with the limits discussed in section Electric and Magnetic Wave Power Attenuation Laws: the electrostatic limit implies a low refractive index and had a distribution peaked at large wave-normal and the limit of electromagnetic waves with both large/small magnetic/electric amplitudes implies a high refractive index and had a distribution peaked at large wave-normal (cf. Figure 6). This means the peak of distribution of electrostatic waves will fall in the lower right corner (small
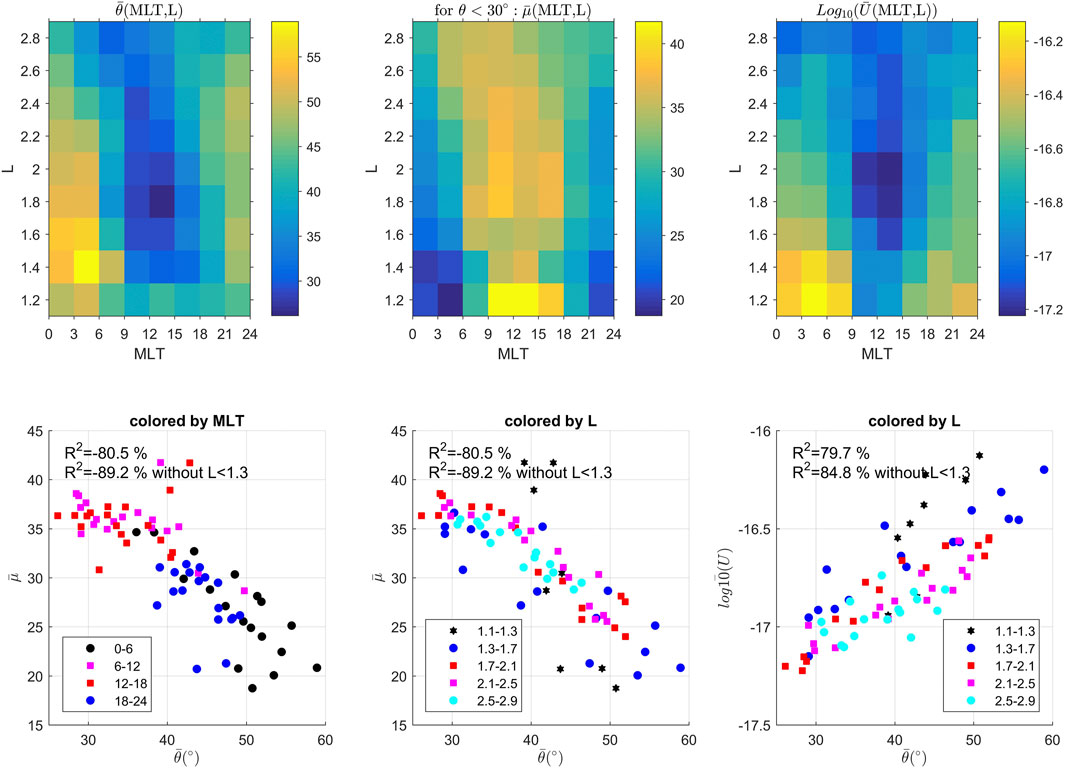
FIGURE 11. (top, left) Wave normal angle (
Figure 12 shows the α and β parameters of the power law attenuation generated in section 3.1 plotted with respect of wave-normal and the refractive index, with the Pearson correlation coefficient given. The two first row of Figure 12 show the same data as the two last rows of Figure 12, with only the color code changing to illustrate the (top) L-shell and (bottom) MLT dependence.
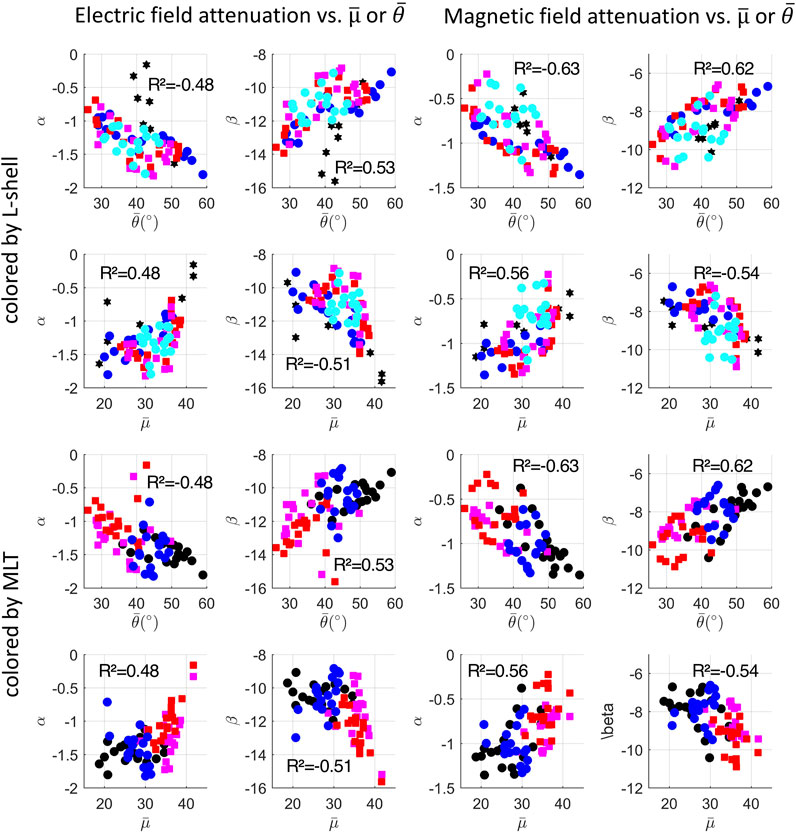
FIGURE 12. (four left of two first rows) Electric and (four right of two first rows) magnetic α-β-parameters of the attenuation laws plotted with respect to (first row) the wave normal angle and (second row) the refractive index colored by (2 first row) MLT. (2 last rows) Figures of the two first rows are repeated but colored by L-shell. Pearson correlation coefficient R2 is given for each figure. Colored codes are given in Figure 10 with dark colors for night sectors and small L-shells.
Some correlations and anti-correlations are visible although the Pearson coefficients are much smaller. On average, the Pearson correlation in Figure 12 is 45%. Limiting the data to above L = 1.3 and below 2.7, the mean Pearson correlation between the α and β parameters and the wave normal angle increases to 53% but it remains at 42% for the refractive index. The correlation coefficients therefore deteriorate below L = 1.3, which have their own regime, and by the winter anomaly affecting the refractive index. Limiting the refractive index to low wave normal angle may also deteriorate the correlations. These overall low correlation factors indicate no direct and strict correlations between the (α, β) parameters and the (
Figure 12 shows large absolute values of the β scaling factor occurring for daytime (more attenuation) are correlated with large refractive index and anti-correlated with small wave normal angles. Small absolute values of the β scaling factor occurring for nighttime (less attenuation) are correlated with small refractive index and anti-correlated with large wave normal angles.
The α power factor, which attenuates more the wave for large absolute values, shows opposite correlations to the β scaling factor. The large absolute values of the α power factor occurring for nighttime (more attenuation) are correlated large refractive index and anti-correlated with small wave normal angles. Small absolute values of the α power factor occurring for daytime (less attenuation) are correlated with small refractive index and anti-correlated with large wave normal angles. As discussed above, the α power factor behave inversely to what could be expected with more attenuation at night than at day, but with a law that matches the attenuation behavior on Earth at night. Nevertheless, we can conclude high attenuation (regardless if caused from large absolute values of either the β scaling factor for daytime or the α power factor for nighttime) is more correlated with large refractive index and more anti-correlated with small wave normal angles. Correspondence between large (low) refractive index with large (low) attenuation is consistent with µ∼Ne(L). This means the winter anomaly, which exists in our statistics (cf. section 3.3), is not strong enough in order to reverse the global dependence (but likely contributes to lower the Pearson correlation coefficients). Interestingly, using a single constant dmax of 5,000 km or 7,000 km (results not shown) causes to include a flat tail (more pronounced for complex (L, MLT) regions) which lowers the slope of the fits and increases the role of (L, MLT). As a consequence, the (α, β) parameters vary more within their respective range and all the Pearson correlation coefficients of Figure 12 increase by +10% on average. This confirms the correlation coefficients only illustrate the consistent dependence of all quantities with respect to (L, MLT). Finally, deducing an effective ambient plasma density from the computed refractive index is possible. First attempts show the obtained density falls in the range of commonly known values (e.g. [47, 48]) and this subject is left for another contribution.
Conclusion
We presented the analysis of propagation, attenuation, and dispersion of lightning-generated whistlers (LGW) observed from the two spacecraft of the NASA Van Allen Probes mission, from 2012 to 2019, through the statistic of three specific quantities; the (electric and magnetic) LGW power decay with distance from the lightning source, the LGW wave-normal angle, and the LGW refractive index.
Attenuation (power) laws of both the electric and magnetic field power of LGW, E2/W and B2/W, rescaled by the WWLLN-estimated lightning energy, W, are derived. We conserve the L-shell, magnetic local time (with MLT ∼ LT), and seasonal dependences in these laws as these parameters are highly influential, which generalizes existing global laws (23, 27, 28, 50). The derived attenuation laws (Eq. (2) with parameters given in Figure 3) can serve to provide a prediction of LGW power present in space (near the equator) for a source of energy (W in kJ) located at d km away from the closest satellite magnetic footprint. These laws are also useful to derive the mean lightning power in space over a drift period at constant L-shell as done with Burkholder’s law in [22]. We find that the LGW electric power decays mostly quadratically in space, with α(L, MLT, s) in Eq. 2 varying between α = -1 and α = -2, while the magnetic power decays mostly linearly in space, with α(L, MLT, s) varying between α = 0 and α = -1. At night, E2 decays as a quadratic law and B2 as a linear law, which is consistent with ground measurements (cf. section Electric and Magnetic Wave Power Attenuation Laws). This is the first time, to our knowledge, that the characterization of the magnetic power decay in space is performed. There is a strong attenuation of the (electric and magnetic) power during daytime (MLT = 9–18) due to the denser ionosphere, with a strong decay of the scaling factor of the power law (i.e.
Statistics of the LGW wave-normal angle, i.e. the angle between the emitted wave and the Earth magnetic field line, which is a key parameter in the computation of pitch angle diffusion coefficients for radiation belt physics, are presented for the first time. We find that, as the wave becomes more electrostatic its wave normal angle increases. As the wave becomes electromagnetic, the wave normal angle distribution is peaked at small wave normal angle but also has a second peak at large wave normal angle. Predominantly electrostatic waves and electromagnetic waves with large magnetic amplitude and small electric amplitude are both well-identified at night. The distribution of electrostatic waves is peaked at large wave normal angle while the distribution of electromagnetic waves with large/small magnetic/electric amplitudes is peaked at small wave normal angle. LGW wave normal angles cover the whole range from 0 to 90°. The LGW mean wave-normal angle computed over the whole data set is 41.6° (34.4° at day and 46.7° at night) with a ∼24° standard deviation. The strong diurnal dependence is the clearest dependence, with the wave normal angle smaller for daytime. There is an absence of strong seasonal and continental dependences of the wave-normal angle in comparison with the well-marked dependence of both the Van Allen Probes electric and magnetic amplitude with seasons/continents.
We also analyze the statistics of an approximated LGW refractive index (frequency integrated), with this quantity computed for the first time with the knowledge of the wave-normal angle, which allows to compute
Cross-correlation established at fixed (MLT, L) bins shows that there is a direct high anti-correlation between wave normal angle and refractive index; large (small) wave normal angle anti-correlates with small (large) refractive index. We find overall low Pearson correlation factors (∼50%) between the (α, β) parameters of the attenuation laws and the (
Data Availability Statement
The datasets presented in this study can be found in online repositories. The names of the repository/repositories and accession number(s) can be found below: http://www.space.umn.edu/rbspefw-data/, https://emfisis.physics.uiowa.edu/data/index, https://www.rbsp-ect.lanl.gov/science/DataDirectories.php.
Author Contributions
J-FR led the study, performed the data analysis, and wrote the manuscript. TF processed WWLLN and Van Allen Probes data, and performed the data analysis. DM treated the EFW and EMFISIS survey data and contributed to the analysis of Van Allen Probes data. GC contributed to the data analysis. GH and CK contributed to the quality check of EMFISIS data used in this article. JW contributed to the quality check of EFW data. TF, DM, EL, GC, GH, CK, and JW contributed to writing of the manuscript through reviews and edits.
Funding
DM was supported for this work by NASA grant 80NSSC18K1034. The work of GSC was supported in part by the Defense Threat Reduction Agency (DTRA).
Conflict of Interest
The authors declare that the research was conducted in the absence of any commercial or financial relationships that could be construed as a potential conflict of interest.
Publisher’s Note
All claims expressed in this article are solely those of the authors and do not necessarily represent those of their affiliated organizations, or those of the publisher, the editors and the reviewers. Any product that may be evaluated in this article, or claim that may be made by its manufacturer, is not guaranteed or endorsed by the publisher.
Acknowledgments
The authors wish to thank the World Wide Lightning Location Network (http://wwlln.net), a collaboration among over 50 universities and institutions, for providing the lightning location data used in this paper. We thank the Satellite Situation Center Locator operated on-line by NASA for providing Van Allen Probes trajectories. This work was performed under the auspices of an agreement between CEA/DAM and NNSA/DP on cooperation on fundamental science. The authors acknowledge the International Space Sciences Institute (ISSI) and the participants in a 2020 ISSI workshop in Bern. The authors thank the entire Van Allen Probes team, and especially the EFW and EMFISIS teams for their support. The EMFISIS wave data (survey-mode magnetic and electric power and L4 wave normal angle) used in this work are accessible from https://emfisis.physics.uiowa.edu/data/index. The EFW wave data (survey-mode magnetic and electric power) used in this work are accessible from http://www.space.umn.edu/rbspefw-data/.
References
1. Carpenter DL. Ducted Whistler-Mode Propagation in the Magnetosphere; a Half-Gyrofrequency Upper Intensity Cutoff and Some Associated Wave Growth Phenomena. J Geophys Res (1968) 73(9):2919-28. doi:10.1029/ja073i009p02919
2. Helliwell RA. Low-Frequency Waves in the Magnetosphere. Rev Geophys (1969) 7(1):2. doi:10.1029/rg007i001p00281
3. Bortnik J, Inan US, Bell TF. Temporal Signatures of Radiation Belt Electron Precipitation Induced by Lightning-Generated MR Whistler Waves: 1. Methodology. J Geophys Res (2006) 111:A02204. doi:10.1029/2005JA011182
4. Abel B, Thorne RM. Electron Scattering Loss in Earth's Inner Magnetosphere: 1. Dominant Physical Processes. J Geophys Res (1998) 103:2385–96. doi:10.1029/97JA02919
5. Rodger CJ, Brundell JB, Holzworth RH, Lay EH. Growing Detection Efficiency of the World Wide Lightning Location Network. In: NB Crosby, T-Y Huang, and MJ Rycroft, editors. CP1118, Coupling of Thunderstorms and Lightning Discharges to Near-Earth. American Institute of Physics (2009). 978-0-7354-0657-5/09.
6. Meredith NP, Horne RB, Glauert SA, Anderson RR. Slot Region Electron Loss Timescales Due to Plasmaspheric Hiss and Lightning-Generated Whistlers. J Geophys Res (2007) 112:A08214. doi:10.1029/2007JA012413
7. Meredith NP, Horne RB, Glauert SA, Baker DN, Kanekal SG, Albert JM. Relativistic Electron Loss Timescales in the Slot Region. J Geophys Res (2009) 114:A03222. doi:10.1029/2008JA013889
8. Ripoll J-F, Chen Y, Fennell JF, Friedel RHW. On Long Decays of Electrons in the Vicinity of the Slot Region Observed by HEO3. J Geophys Res Space Phys (2014) 120:460–78. doi:10.1002/2014JA020449
9. Albert JM, Starks MJ, Selesnick RS, Ling AG, O'Malley S, Quinn RA. VLF Transmitters and Lightning-Generated Whistlers: 2. Diffusion of Radiation Belt Electrons. J Geophys Res Space Phys (2020) 125:e2019JA027030. doi:10.1029/2019JA027030
10. Albert JM. Evaluation of Quasi-Linear Diffusion Coefficients for Whistler Mode Waves in a Plasma with Arbitrary Density Ratio. J Geophys Res (2005) 110:A03218. doi:10.1029/2004JA010844
11. Albert JM. Dependence of Quasi-Linear Diffusion Coefficients on Wave Parameters. J Geophys Res (2012) 117:A09224. doi:10.1029/2012JA017718
12. Ripoll J-F, Albert JM, Cunningham GS. Electron Lifetimes from Narrowband Wave-Particle Interactions within the Plasmasphere. J Geophys Res Space Phys (2014) 119:8858–80. doi:10.1002/2014JA020217
13. Parrot M, Berthelier JJ, Lebreton JP, Treumann R, Rauch JL. DEMETER Observations of EM Emissions Related to Thunderstorms. Space Sci Rev (2008) 137:511–9. doi:10.1007/s11214-008-9347-y
14. Berthelier JJ, Godefroy M, Leblanc F, Malingre M, Menvielle M, Lagoutte D, et al. ICE, the Electric Field experiment on DEMETER. Planet Space Sci (2006) 54:456–71. doi:10.1016/j.pss.2005.10.016
15. Colman JJ, Starks MJ. VLF Wave Intensity in the Plasmasphere Due to Tropospheric Lightning. J Geophys Res Space Phys (2013) 118:4471–82. doi:10.1002/jgra.50217
16. Starks MJ, Albert JM, Ling AG, O'Malley S, Quinn RA. VLF Transmitters and Lightning-Generated Whistlers: 1. Modeling Waves from Source to Space. J Geophys Res Space Phys (2020) 125:e2019JA027029. doi:10.1029/2019JA027029
17. Ripoll JF, Claudepierre SG, Ukhorskiy AY, Colpitts C, Li X, Fennell JF, et al. Particle Dynamics in the Earth's Radiation Belts: Review of Current Research and Open Questions. J Geophys Res Space Phys (2020) 125:e2019JA026735. doi:10.1029/2019JA026735
18. Záhlava J, Němec F, Santolík O, Kolmašová I, Hospodarsky GB, Parrot M, et al. Lightning Contribution to Overall Whistler Mode Wave Intensities in the Plasmasphere. Geophys Res Lett (2019) 46:8607–16. doi:10.1029/2019GL08391810.1029/2019gl083918
19. Ripoll JF, Farges T, Malaspina DM, Lay EH, Cunningham GS, Hospodarsky GB, et al. Analysis of Electric and Magnetic Lightning-Generated Wave Amplitudes Measured by the Van Allen Probes. Geophys Res Lett (2020) 47:e2020GL087503. doi:10.1029/2020GL087503
20. Christian HJ, Blakeslee RJ, Boccippio DJ, Boeck WL, Buechler DE, Driscoll KT, et al. Global Frequency and Distribution of Lightning as Observed from Space by the Optical Transient Detector. J Geophys Res (2003) 108(D1):4005. doi:10.1029/2002JD002347
21. Cecil DJ, Buechler DE, Blakeslee RJ. TRMM LIS Climatology of Thunderstorm Occurrence and Conditional Lightning Flash Rates*. J Clim (2015) 28(16):6536–47. doi:10.1175/JCLI-D-15-0124.1
22. Ripoll JF, Farges T, Lay EH, Cunningham GS. Local and Statistical Maps of Lightning-Generated Wave Power Density Estimated at the Van Allen Probes Footprints from the World-Wide Lightning Location Network Database. Geophys Res Lett (2019) 46:4122–33. doi:10.1029/2018GL081146
23. Ripoll J-F, Farges T, Malaspina DM, Lay EH, Cunningham GS, Hospodarsky GB, et al. Electromagnetic Power of Lightning Superbolts from Earth to Space. Nat Commun (2021) 12:3553. doi:10.1038/s41467-021-23740-6
24. Holzworth RH, McCarthy MP, Brundell JB, Jacobson AR, Rodger CJ. Global Distribution of Superbolts. J Geophys Res Atmos (2019) 124:9996–10005. doi:10.1029/2019jd030975
25. Hutchins ML, Holzworth RH, Brundell JB, Rodger CJ. Relative Detection Efficiency of the World Wide Lightning Location Network. Radio Sci (2012) 47:RS6005. doi:10.1029/2012RS005049
26. Hutchins ML, Holzworth RH, Rodger CJ, Brundell JB. Far-Field Power of Lightning Strokes as Measured by the World Wide Lightning Location Network. J Atmos Oceanic Technol (2012) 29:1102–10. doi:10.1175/JTECH-D-11-00174.1
27. Jacobson AR, Holzworth RH, Pfaff RF, McCarthy MP. Study of Oblique Whistlers in the Low-Latitude Ionosphere, Jointly with the C/NOFS Satellite and the World-wide Lightning Location Network. Ann Geophys (2011) 29:851–63. doi:10.5194/angeo-29-851-2011
28. Burkholder BS, Hutchins ML, McCarthy MP, Pfaff RF, Holzworth RH. Attenuation of Lightning-Produced Sferics in the Earth-Ionosphere Waveguide and Low-Latitude Ionosphere. J Geophys Res Space Phys (2013) 118:3692–9. doi:10.1002/jgra.50351
29. Mauk BH, Fox NJ, Kanekal SG, Kessel RL, Sibeck DG, Ukhorskiy A. Science Objectives and Rationale for the Radiation Belt Storm Probes Mission. Space Sci Rev (2013) 179(1–4):3–27. doi:10.1007/s11214-012-9908-y
30. Kletzing CA, Kurth WS, Acuna M, MacDowall RJ, Torbert RB, Averkamp T, et al. The Electric and Magnetic Field Instrument Suite and Integrated Science (EMFISIS) on RBSP. Space Sci Rev (2013) 179:127–81. doi:10.1007/s11214-013-9993-6
31. Wygant JR, Bonnell JW, Goetz K, Ergun RE, Mozer FS, Bale SD, et al. The Electric Field and Waves Instruments on the Radiation Belt Storm Probes Mission. Space Sci Rev (2013) 179:183–220. doi:10.1007/s11214-013-0013-7
32. Malaspina DM, Jaynes AN, Hospodarsky G, Bortnik J, Ergun RE, Wygant J. Statistical Properties of Low-Frequency Plasmaspheric Hiss. J Geophys Res Space Phys (2017) 122:8340–52. doi:10.1002/2017JA024328
33. Holzworth RH, McCarthy MP, Pfaff RF, Jacobson AR, Willcockson WL, Rowland DE. Lightning-generated Whistler Waves Observed by Probes on the Communication/Navigation Outage Forecast System Satellite at Low Latitudes. J Geophys Res (2011) 116:A06306. doi:10.1029/2010JA016198
34. Němec F, Santolík O, Parrot M, Rodger CJ. Relationship between Median Intensities of Electromagnetic Emissions in the VLF Range and Lightning Activity. J Geophys Res (2010) 115:A08315. doi:10.1029/2010JA015296
35. Bortnik J, Inan US, Bell TF. Ldependence of Energetic Electron Precipitation Driven by Magnetospherically Reflecting Whistler Waves. J Geophys Res (2002) 107(A8):1150. doi:10.1029/2001JA000303
36. Chang S-C, Hsu R-R, Huang S-M, Su H-T, Kuo C-L, Chou J-K, et al. Characteristics of TLE-Producing Lightning in a Coastal Thunderstorm. J Geophys Res Space Phys (2014) 119:9303–20. doi:10.1002/2014JA019819
37. Santolík O, Pickett JS, Gurnett DA, Storey LRO. Magnetic Component of Narrowband Ion Cyclotron Waves in the Auroral Zone. J Geophys Res (2002) 107(A12):17–1. doi:10.1029/2001JA000146
38. Santolík O, Parrot M, Lefeuvre F. Singular Value Decomposition Methods for Wave Propagation Analysis. Radio Sci (2003) 38(1):1010. doi:10.1029/2000RS002523
39. Cecil DJ, Buechler DE, Blakeslee RJ. Gridded Lightning Climatology from TRMM-LIS and OTD: Dataset Description. Atmos Res (2014) 135-136:404–14. doi:10.1016/j.atmosres.2012.06.028
40. Ripoll JF, Santolík O, Reeves GD, Kurth WS, Denton MH, Loridan V, et al. Effects of Whistler Mode Hiss Waves in March 2013. J Geophys Res Space Phys (2017) 122:7433–62. doi:10.1002/2017JA024139
42. Ripoll J-F, Loridan V, Denton MH, Cunningham G, Reeves G, Santolík O, et al. Observations and Fokker-Planck Simulations of the L-Shell, Energy, and Pitch Angle Structure of Earth’s Electron Radiation Belts during Quiet Times. J Geophys Res Space Phys (2019) 124, 1125–42. doi:10.1029/2018ja026111
43. Liu L, Zhao B, Wan W, Ning B, Zhang M-L, He M. Seasonal Variations of the Ionospheric Electron Densities Retrieved from Constellation Observing System for Meteorology, Ionosphere, and Climate mission Radio Occultation Measurements. J Geophys Res (2009) 114:A02302. doi:10.1029/2008JA013819
44. Tulasi Ram S, Su S-Y, Liu CH. FORMOSAT-3/COSMIC Observations of Seasonal and Longitudinal Variations of Equatorial Ionization Anomaly and its Interhemispheric Asymmetry during the Solar Minimum Period. J Geophys Res (2009) 114:A06311. doi:10.1029/2008JA013880
45. Sai Gowtam V, Tulasi Ram S. Ionospheric Annual Anomaly-New Insights to the Physical Mechanisms. J Geophys Res Space Phys (2017) 122:8816–30. doi:10.1002/2017JA024170
46. Burns AG, Wang W, Qian L, Solomon SC, Zhang Y, Paxton LJ, et al. On the Solar Cycle Variation of the winter Anomaly. J Geophys Res Space Phys (2014) 119:4938–49. doi:10.1002/2013JA019552
47. Gallagher DL, Craven PD, Comfort RH. Global Core Plasma Model. J Geophys Res (2000) 105(18):18819–33. doi:10.1029/1999JA000241
48. Ozhogin P, Tu J, Song P, Reinisch BW. Field-Aligned Distribution of the Plasmaspheric Electron Density: An Empirical Model Derived from the IMAGE RPI Measurements. J Geophys Res (2012) 117:A06225. doi:10.1029/2011JA017330
49. Ripoll J-F, Reeves GD, Cunningham GS, Loridan V, Denton M, Santolík O, et al. Reproducing the Observed Energy-Dependent Structure of Earth's Electron Radiation Belts during Storm Recovery with an Event-specific Diffusion Model. Geophys Res Lett (2016) 43:5616–25. doi:10.1002/2016GL068869
50. Fiser JC, Diendorfer G, Parrot M, Santolik O Whistler intensities above thunderstorms. Ann Geophys (2010) 28:37–46.
Keywords: lightning-generated whistlers, wave propagation, wave-normal angle, refractive index, attenuation laws, WWLLN database, radiation belts, Van Allen Probes
Citation: Ripoll J-F, Farges T, Malaspina DM, Cunningham GS, Hospodarsky GB, Kletzing CA and Wygant JR (2021) Propagation and Dispersion of Lightning-Generated Whistlers Measured From the Van Allen Probes. Front. Phys. 9:722355. doi: 10.3389/fphy.2021.722355
Received: 08 June 2021; Accepted: 29 July 2021;
Published: 19 August 2021.
Edited by:
Ioannis A. Daglis, National and Kapodistrian University of Athens, GreeceReviewed by:
Yuri Shprits, German Research Centre for Geosciences, Helmholtz Centre Potsdam, GermanyArnaud Masson, European Space Astronomy Centre (ESAC), Spain
Copyright © 2021 Ripoll, Farges, Malaspina, Cunningham, Hospodarsky, Kletzing and Wygant. This is an open-access article distributed under the terms of the Creative Commons Attribution License (CC BY). The use, distribution or reproduction in other forums is permitted, provided the original author(s) and the copyright owner(s) are credited and that the original publication in this journal is cited, in accordance with accepted academic practice. No use, distribution or reproduction is permitted which does not comply with these terms.
*Correspondence: J.-F. Ripoll, amVhbi1mcmFuY29pcy5yaXBvbGxAY2VhLmZy
 J.-F. Ripoll
 T. Farges
 D. M. Malaspina
 G. S. Cunningham5