 Francesco Maria De Collibus
 Alberto Partida
  Matija Piškorec
  Claudio J. Tessone
94% of researchers rate our articles as excellent or good
Learn more about the work of our research integrity team to safeguard the quality of each article we publish.
Find out more
ORIGINAL RESEARCH article
Front. Phys., 27 October 2021
Sec. Social Physics
Volume 9 - 2021 | https://doi.org/10.3389/fphy.2021.720708
This article is part of the Research TopicCryptocurrency Transaction Analysis from a Network PerspectiveView all 12 articles
In this study, we analyse the aggregated transaction networks of Ether (the native cryptocurrency in Ethereum) and the three most market-capitalised ERC-20 tokens in this platform at the time of writing: Binance, USDT, and Chainlink. We analyse a comprehensive dataset from 2015 to 2020 (encompassing 87,780,546 nodes and 856,207,725 transactions) to understand the mechanism that drives their growth. In a seminal analysis, Kondor et al. (PLoS ONE, 2014, 9: e86197) showed that during its first year, the aggregated Bitcoin transaction network grew following linear preferential attachment. For the Ethereum-based cryptoassets, we find that they present in general super-linear preferential attachment, i.e., the probability for a node to receive a new incoming link is proportional to kα, where k is the node’s degree. Specifically, we find an exponent α = 1.2 for Binance and Chainlink, for Ether α = 1.1, and for USDT α = 1.05. These results reveal that few nodes become hubs rapidly. We then analyse wealth and degree correlation between tokens since many nodes are active simultaneously in different networks. We conclude that, similarly to what happens in Bitcoin, “the rich indeed get richer” in Ethereum and related tokens as well, with wealth much more concentrated than in-degree and out-degree.
Bitcoin and Ethereum are the two pioneering blockchain-based platforms. Nakamoto [1] created Bitcoin: the first and most popular cryptocurrency system since its launch in January 2009 and, so far, the one with the highest market capitalisation according to coinmarketcap [2]. Launched in 2015, Ethereum [3] is the second most popular public permissionless blockchain platform and the second most capitalised according to coinmarketcap [2]. Ethereum is considered “the world’s distributed computer”: the first platform to implement smart contracts, i.e., Turing-complete programs. This is pivotal for many new decentralised applications such as decentralised finance (DeFi).
At the intersection among economics, technology, and social sciences, Popper [4] states that blockchains constitute an inspiring and emerging research field since the original inception of Bitcoin by Nakamoto [1]. The use of blockchain-based distributed ledgers in our society grows steadily. On one side, Bitcoin is one of the fastest-growing assets in history, with market capitalisation records broken successively in the past. On the other side, blockchain is being successfully introduced in a wide array of use cases, ranging from secure voting to supply chain tracking. The vast majority of currently available crypto-currencies uses a public distributed ledger based on a blockchain to transact and exchange value [5,6]. All transactions are registered in a readable distributed ledger, in such a way that anyone connected to the peer-to-peer network can verify independently the validity of the executed transactions.
Blockchains offer a new research opportunity to better analyse and understand complex social and economic systems. Access to transactions occurring in traditional payment systems is usually restricted: traditional exchanges remain confidential, protected by privacy laws, or trade secrets. Digital payments with credit cards and wire transfers carry a similar limitation, while payments with physical cash are de facto impossible to track on a massive scale. In contrast, transactions in a public blockchain are visible by definition, only limited by the pseudo-anonymity of the users as described by Reid and Harrigan [7]. The additional research boundary is the considerable amount of data that blockchain implementations produce when they are massively adopted. Extant research by [8–11] shows that market value growth has accelerated in parallel to the number of users and transactions. While in some cases, like in Bitcoin, the rate of data production is currently bounded by the limits imposed by design choices (block size, inter-block time), and in other systems, transaction data increase massively throughout time (like in Ethereum). The use of networks to describe interactions is a powerful resource: in our case, we represent Ethereum transaction data using a network of nodes (public addresses) interconnected by edges (transactions).
Network science refers to an interdisciplinary approach that helps to characterise complex systems composed of many interacting constituents. This approach permitted to unveil large-scale emergent properties in the most varied disciplines, ranging from biology to social sciences, and specifically socio-technical and economic and financial systems [12–17].
Growth in a wide range of networked systems presents a network version of the “rich-get-richer” effect. In terms of degree, this mechanism implies that nodes with a higher degree accrue links at a higher rate than lower-degree nodes. Price [18] calls this effect as “cumulative advantage”; Barabási and Albert [19]; Albert and Barabási [20]; Barabási and Pósfai [12] refer to it as “preferential attachment” (PA). This effect usually creates power-law degree distributions, facilitating the mathematical characterisation of a growth pattern in complex networks [21]. In practice, preferential attachment refers to the specific case in which the probability of receiving a new link is directly proportional to the node’s degree k, producing a scale-free network characterised by a power-law degree distribution pk ∼ k−γ with exponent 2 ≤ γ ≤ 3, as in Barabási and Pósfai [12]; Alstott et al. [22]. However, extensions of the model such as Krapivsky et al. [23] show that the emergent topology changes when the probability of a node to receive new links is a nonlinear function of the node’s degree: while highly connected nodes in networks with sublinear PA do not play such a decisive role in network growth, in the case of networks showing super-linear PA, few nodes act like hubs and tend to connect to most network nodes (i.e., the network topology concentrates around superhubs).
Public blockchains are current examples of complex systems which are increasingly researched through complex network approaches Vallarano et al. [11]. By analysing a complete and unique dataset encompassing the first 5 years of Ethereum platform, i.e., 856,207,725 transactions and 87,780,546 addresses, we show that the native cryptocurrency of the Ethereum platform, Ether, and the most active tokens on it show a form of preferential attachment, with signs of super-linear PA.
This study is structured as follows. In Section 2, we review related literature on complex network approaches to understand cryptocurrencies and blockchain-based systems. Section 3 presents the analysed dataset. In Section 4, we introduce the methodology while in Section 5, we display the results of empirical distributions of wealth and in- and out-degrees. We share the results for the nonlinear preferential attachment analysis in Section 6. Finally, in Section 7, we present the conclusions of this analysis.
In [24,25], the authors analyse aggregated representations of the Bitcoin transaction network. They observe that highly connected nodes increase their connectivity with new edges either by receiving new transactions (in-degree) or starting new transactions (out-degree). Using a statistical approach based on rank, they conclude that the growth of the degree distribution in the Bitcoin transaction network displays linear preferential attachment (PA). They also identify that addresses with high balance increase their wealth more than addresses with low balance displaying a sublinear preferential attachment. In addition, they find that the in-degree of a node, i.e., the number of transactions received by an address, is positively correlated with the Bitcoin balance of that address. Wealth distribution per address is highly heterogeneous, but this distribution is stable at different points of time. Instead of a power-law distribution, Kondor et al. [24] find for the majority of the samples a better approximation in the stretched exponential distribution. With a focus on wealth, the Gini coefficient is computed over time, and they find that G ≈ 0.9.
Bovet et al. [9] analyse more properties of the Bitcoin transaction network. The study includes more than 283M transactions between 304M addresses which can be reduced to around 16M users. The technical process to analyse data of this size is explained in Sommer [26]. They observe that when many users behave similarly by creating the same connectivity pattern (i.e., they display a sharper degree distribution with an increase in both number of links and number of nodes), then there are price surges. Once the price peak of a bubble is passed, the heterogeneity of the degree distribution of different participants widens. In their introduction, Bovet et al. [9] present four graphs that show features of the Bitcoin network: number of nodes, number of links, density, and price along a temporal axis. We follow a similar approach to introduce the four Ethereum-based transactions networks that we study in Figure 2 and Figure 3.
A basic although crucial lesson learned from the literature review on Ethereum network analysis is indeed the very fast pace of change in this platform. Liang et al. [27] present a dynamic network analysis of three representative blockchain-based crypto-currencies: Bitcoin, Ethereum, and Namecoin. The authors construct separate networks on a monthly basis, and they trace changes of typical network characteristics over time, including degree distribution, degree assortativity, clustering coefficient, and the largest connected component. They compare the three networks and conclude that the degree distribution of these monthly transaction networks cannot be fitted well by a power-law distribution. In addition, they find that both Bitcoin and Ether (ETH) networks are heavy-tailed with disassortative mixing; however, only the former can be treated as a “small world”, i.e., most vertices can be reached from the others through a small number of edges. These network properties reflect the evolutionary characteristics and competitive power of these three cryptocurrencies. The dataset comprises of approximately 80M transactions from 2015 to late 2017. They identify a continuously increasing average degree except for a decrease in October 2016, when the network showed instability caused by several denial-of-service (DoS) attacks. They study the transaction volume and state that most of the users have limited incoming transactions while a small population receives a large amount of ETH. Liang et al. [27] identify that these cryptocurrency networks do not obey the densification law, and they argue that a plausible explanation is the minimal reuse of addresses (which is a standard practice in UTXO-based systems). They find that almost all degree distributions cannot be accepted as a power-law but still as a clear heavy-tailed distribution, which means that the majority of addresses have low degrees, while a small but not negligible number of addresses have relatively high degrees. Guo et al. [28] use a more reduced ETH datasets, one containing 100,000 blocks from 2015, and ca. 680,000 transactions and another containing 610,000 transactions from 2017. They find that the typical distance between any pair of anonymous users is extremely small, and the Ether paid by one node may return at a relatively high speed. As a result, they claim that ETH enjoys a good level of liquidity. Somin et al. [29] provide the first analysis of the network properties of ERC-20 protocol-compliant tokens trading data. They analyse the properties of the transaction network by considering all trading wallets (i.e., addresses) as network nodes and constructing its edges using buy–sell trades. They examine several time periods and several data aggregation variants to demonstrate that the transaction network displays strong power-law properties. Both outgoing and incoming degrees present a power-law distribution. This means that most tokens are traded by an extremely small number of users. Only a few popular tokens are traded by a very large group of users during the examined time span. These results coincide with current network theory expectations. Somin et al. [29] provide the first scientific complex network validation for the ERC-20 trading data. The data they examine are composed of over 30 million ERC-20 tokens trades, performed by over 6.8 million unique wallets, encompassing a 2-year period between February 2016 and February 2018. Even studies that use a very limited ETH datasets such as Ferretti and D’Angelo [30], which in some cases used just a 1-h slot to study transactions, i.e., only around 240 blocks, conclude that the degree distribution is heavy-tailed suggesting that those degrees follow a power-law function. Somin et al. [31] analyse the dynamic properties of trading data from ERC-20 protocol compliant tokens using network theory. They examine the dynamics of ERC-20-based networks over time by analysing a meta-parameter of the network, i.e., the power of its degree distribution and their analysis demonstrates that this parameter can be modelled as an under-damped harmonic oscillator over time, enabling a year forward of network parameters predictions. Lin et al. [32] model the ETH transaction records as a complex network by incorporating time and amount features of the transactions and then design several flexible temporal walk strategies for random-walk-based graph representation of this large-scale network. Their experiments of temporal link prediction on real ETH data demonstrate that temporal information and multiplicity characteristic of edges are indispensable for accurate modelling and understanding of ETH transaction networks.
A blockchain is a time-ordered sequence of blocks, each of them composed by a set of verified transactions. Transactions can change permanently the state of the Ethereum blockchain by transferring value through the native token (Ether) or by creating and executing smart contracts. Tokens built on top of Ethereum consist of a smart contract, i.e., a program run by the Ethereum Virtual Machine (EVM). The EVM is the distributed run-time environment of the Ethereum blockchain. Transactions are inserted in blocks, which are then mined, i.e., verified, using a proof of work-based consensus. For an overview of the different approaches, see Tasca and Tessone [5].
In our study, we analyse the Ethereum blockchain since its launch in 2015 until October 6, 2020 (block 11,000,000). In total, it contains 87,780,546 addresses and 856,207,725 transactions.
The data required to build the networks were extracted from the Ethereum blockhain using ethereum-etl tool from Medvedev [33]. Ethereum-etl performs ETL operations (Extract, Transform and Load) on raw Ethereum data. It enables the extraction of transactions, mined blocks, and token transfers in csv format from a fully synced Ethereum client with archive mode. Other data pipeline options are available as well. For this analysis, we use transactions with a nonzero value to reconstruct the Ether network. Transactions with zero value are usually smart contract calls. We use block extraction to assign timestamps to both native Ether and token transactions. We then aggregate transfers per token to conduct the analysis. There are thousands of tokens, but only few of them have a worth-analysing number of transactions. The vast majority of tokens have very few or no transactions at all. For this analysis, we selected three tokens, the most successful in market capitalisation at the time of writing. The other tokens were extracted but not used for this specific analysis. For further details, see the data availability statement section (Section 7). For market capitalisation data, we use quotations publicly available on coinmarketcap [2].
Table 1 compares the size of the datasets analysed by some of the authors mentioned in the literature review with our dataset, to underline the comprehensive scale of our analysis.
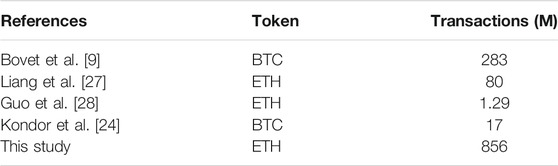
TABLE 1. Summary of the different datasets analysed by different authors.
We study the dynamics of the aggregated transaction network in Ether (ETH), the native token of Ethereum, and in three key ERC-20 tokens built on top of Ethereum: Binance (BNB), Tether (USDT), and Chainlink (LNK). In our representation, the transaction network is composed of addresses (nodes) and directed edges representing transactions. A directed edge between two nodes means that there is at least one transaction from the sender address to the destination address. We create the networks and perform network calculations using the entire timeline mentioned in this section. In our analysis, repeated edges are disregarded. We additionally consider the timestamp of the transactions to analyse the time-based evolution of the network. We analyse as well balances of addresses at a certain point in time to study wealth distribution. The summary of the datasets used in this study is in Table 2.
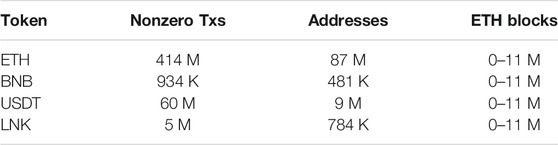
TABLE 2. Summary of the datasets analysed in this study.
As of this writing, according to coinmarketcap [2], ETH is the second most capitalised cryptocurrency (over USD 170 B) behind Bitcoin. We also analyse three ERC-20 tokens with the highest market capitalisation according to etherscan.io [34] in early March 2021: Binance (over USD 36 B), Tether (over USD 35 B), and Chainlink (over USD 11B).
ERC-20 Tokens: According to its specification [35], ERC-20 is the Ethereum standard for fungible tokens, where fungible means that every token of the same type behaves exactly the same and is completely interchangeable (in contrast to non-fungible tokens (NFT) where every token can be unique). ERC-20 is the interface that a smart contract (i.e., a program deployed on the Ethereum blockchain) can implement to exchange this kind of tokens. The interface provides functionalities such as token transfer from one account to another, current token balance of an account, total supply of the token available on the network, or approval for a specific token amount from an account to be spent by a third party account. An ERC-20 token contract is a smart contract that implements this interface. ERC-20 offers a viable and very successful standard to interact with non-native tokens. Non-native means not devised as part of the original protocol but implemented on top of it.
Ether (ETH): It is Ethereum’s native token. In its foundational whitepaper Buterin [3], it is stated that Ethereum’s mission is “to create an alternative protocol to build decentralised applications”. Ethereum introduces a public blockchain with a built-in Turing-complete scripting language. Anyone can write smart contracts and decentralised applications to create their own arbitrary rules for ownership and value transaction. Ethereum, launched in 2015, constitutes an evolution from the pioneer Bitcoin blockchain. Bitcoin is based on unspent transaction outputs while Ethereum uses balance-based accounts, Turing-complete scripting, and smart contracts with their own address. Ether (ETH) is the native token that fuels the Ethereum network. With Ether, users buy “gas” that enable transactions and smart contracts calls to run. Gas is used as well to reward miners for incorporating transactions into the blocks, in addition to the usual mining block reward.
Binance Coin (BNB): The currency unit issued by Binance and—at the time of writing—the ERC-20 token based on Ethereum with the highest market capitalisation according to etherscan. io [34]. Binance was founded in 2017 and is at the time of writing the largest cryptocurrency exchange by trading volume. “Binance” stems from “Binary Finance”, as a portmanteau word of a whole new paradigm in finance. To sustain this vision, Binance launched in 2017 the Binance Coin (BNB), an initial coin offering (ICO) to fund the exchange activities, described in Binance [36]. BNB can be used to pay any fees on the exchange platform. Two important events affect BNB: First, the Binance team destroys BNB coins (a coin burn) on a quarterly basis to avoid coin value loss. Second, in April 2019, ERC-20 BNB coins were swapped with BNB coins based on the Binance Chain mainnet (BEP-2 BNB) to avoid ETH fees. BNB is currently no longer solely hosted on Ethereum but as well on its proprietary blockchain Binance Chain.
Tether (USDT): Originally proposed in 2012 as a “colored coin” inside Bitcoin and effectively launched in that network between 2014 and 2015, USDT since 2017 is traded as well as an ERC-20 token inside Ethereum. More recently, USDT has been made available even on further blockchains such as EOS, Algorand, or Tron. The philosophy and the vision behind this token are described in Tether [37]. It ranks second in market capitalisation for tokens based—among others—on Ethereum [34]. Tether is a stablecoin and can be described as a digital version of the USD, originally designed to be worth exactly $1.00, allegedly maintaining for this purpose the exact amount of reserves as USDT that are in circulation. This claim proved controversial in April 2019 when an official investigation was carried out. However, its current capitalisation indicates that markets still accept its role as digital USD, to whom it is “tethered” (hence its name “Tether”).
Chainlink (LNK): It is the third most capitalised ERC-20 Ethereum-based token according to coinmarketcap.com [39] as of the time of writing. It has a high potential given its bridging nature between APIs, off-chain events, and smart contracts. Since 2020, as in coinmarketcap.com [38], LNK lists as the most capitalised decentralised finance (DeFi) token. The whitepaper by Ellis et al. [39] assigns to Chainlink the mission of building a decentralised oracle network connecting smart contracts with real-world data. Chainlink held an ICO in September 2017, raising 32 million USD, with a total supply of one billion LNK tokens. The ChainLink network utilises the LNK token to pay ChainLink node operators for the retrieval of data from off-chain data feeds (oracles), the formatting of data into blockchain readable formats, the off-chain computations, and the uptime guarantee they provide as operators. In order for a smart contract to use a ChainLink node, it needs to pay the chosen ChainLink node operator using LNK tokens, with prices usually being set by the node operator based on the demand for the off-chain resource their ChainLink node provides and the availability of other similar resources. The LNK token is an ERC-20 token, with the additional ERC-223 “transfer and call” functionality, allowing tokens to be received and processed by contracts within a single transaction.
As explained in Section 1, the core of our study is the characterisation of the network growth in the four transaction networks that we analyse: Ether (ETH), Binance (BNB), Tether (USDT), and Chainlink (LNK).
In the Ethereum network, we distinguish two kinds of accounts: externally owned accounts (EOA) and smart contracts. The former ones are controlled through their public/private key pairs and the latter ones via the logic of the code stored together with their account. We consider EOAs as human-controlled accounts while smart contracts are programs executed inside the blockchain. Smart contracts publish functions that can be invoked by EOAs or by other contracts. Smart contracts are created by EOAs by sending a contract creation transaction to the special 0x0 address.
EOAs have one or more private/public key pairs that allow them to control (receive, send, etc.) the native cryptocurrency or tokens by signing transactions with their private key. Smart contracts do not initiate transactions: they are executed when they are invoked. In their execution, smart contracts can call other contracts (they often need to for complex cases). There is always a transaction initiated by an EOA at the beginning of an smart contract execution chain.
Addresses (accounts) are the way agents are uniquely identified inside the blockchain. EOAs obtain their address from their public key. Smart contracts obtain their address as a function of the public key of their creator EOA and their specific “nonce”. For further details about the functioning of Ethereum, see Antonopoulos and Wood [40].
All the interactions we see in the Ethereum blockchain occur between addresses (accounts): in our specific area of interest, tokens and cryptocurrencies are exchanged from one address to another. Both EOAs and smart contracts have addresses and balances: regardless of whether or not the account stores code, the two types are treated equally inside the Ethereum network; therefore, we do not distinguish between them in our network analysis. Native ETH tokens can be exchanged directly inside transactions. As ERC-20 tokens are built as smart contracts, any exchange of value has to pass by the smart contract address by invoking the dedicated ERC-20 transfer function.
In this study, we construct an aggregated transaction network
We also define the wealth
where α > 0. If α = 1, then it is said that preferential attachment is linear. If α < 1 (α > 1), then it is sublinear (resp., super-linear). Preferential attachment is linked to the growth mechanism of the network. We focus on the evolution of the network (and degree accruing process) where any existing network node can create links to others (regardless of their arrival or not).
When the probability of forming the new link is linear, i.e., α = 1, then preferential attachment leads to a scale-free network. A scale-free network is a network whose degree distribution follows a power-law function
In a sublinear preferential attachment, the effect of nodes connecting with high-degree nodes is less patent. The degree distribution is a stretched exponential and not a power-law:
When a new, directed edge is added to the network (from an unspecified node), we assume that the destination node j is selected with a probability which is a function (solely) of its in-degree
where δ(⋅, ⋅) represents the Kronecker delta, and—therefore—its sum yields the total number of nodes with in-degree k at time t, denoted by nin (k, t). Given that Π(k*, t) is a time-dependent function, following Kondor et al. [24], we use the rank function
In the first expression, the function Θ (⋅) is the Heaviside function, equal to one if the argument is positive, and zero otherwise. Thus, the sum in the denominator runs for all nodes whose degree is lower than
Thus, if αo is the exponent of the non-preferential attachment, adding new edges is equivalent to a process of inverse transform sampling Devroye [43] on R (αo; k*, t).
To obtain the value of αo, we measure the corresponding K-S (Kolmogorov-Smirnoff) goodness of fit, i.e., the difference between the empirical distribution function (ECDF) calculated with different exponents α and the theoretical linear CDF distribution. The value αo that minimises the distance to the uniform distribution is the best fit for the exponent. That specific value will be informative of the type of PA present in each of the transaction networks that we study.
As explained in Section 3, the size of the analysed data renders this task computationally demanding. To make the calculation more scalable, we only analyse each edge with a probability p(R) ≪ 1. We repeat the process multiple times to confirm results. The exact parameters used are detailed in chapter 6.
We start by analysing wealth distribution across addresses for the four tokens considered. We compare native tokens (ETH) with second-level tokens built on top of the Ethereum network (BNB, USDT, LNK). For all the nodes that appear once in the evolution of the network, we extract their final wealth, i.e., their balance at block 11 M (October 6, 2020) and show the distribution in Figure 1.
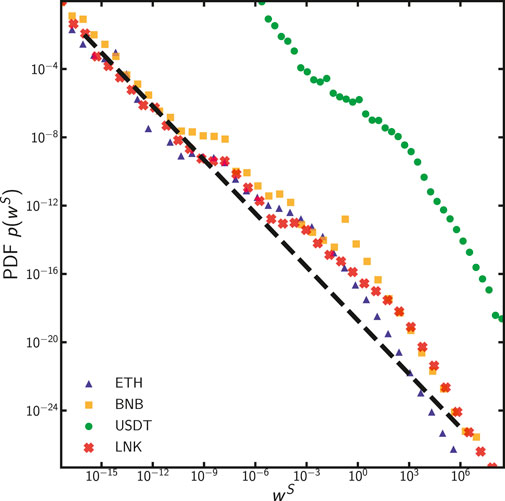
FIGURE 1. PDF of wealth wS for wS > 0 in various tokens: ETH, BNB, USDT, and LNK. The dashed line (w−1) is just added for visual reference.
We do this programmatically by extracting wealth data for all the nodes involved in the transaction network. This way we obtain the basic unit of account: for the Ether Network, the output of getBalance is the unit of account known as “wei” (equivalent to 10–18 Ether), while for BNB, USDT and LNK are the unit returned from the ERC-20 method balanceOf, which is custom-defined for every token. To obtain the well-known and traded token value we are commonly referring to, we have to divide the output of balanceOf method by the value specified in the Decimal field of the ERC-20 Contract. This value is 1018 for LNK and BNB (the same as ETH) and 106 for USDT (see Figure 1). All four tokens seem to follow a power-law distribution. Ether (ETH), BNB, and LNK display a similar behaviour while Tether (USDT) exhibits a cutoff at a lower value. The very broad distributions with power-law compatible behaviour (spanning 14 orders of magnitude) are by itself quite remarkable, independent of the nature of the token considered.
While in this study, we do not dig into the mechanism that generates this emergence, it reflects a similar behaviour to the wealth distribution in real-world economies as shown in Levy and Solomon [44] and Brzezinski [45]. However, in this case, the distribution is much broader. This implies the existence of systemic agents in the system. When computing the Gini indices at the end of the period analyses Bovet et al. [9], we find out that the values for all distributions are often above 0.99. The reason for this excessive inequality is the underlying wealth distribution. The results of model selection—as in Clauset et al. [46]—for wealth distribution are pretty similar for all of the tokens, with strong evidence in support of power-law against exponential (p-values of 10–15, 10–4, 10–3, and 10–9 for ETH, BNB, USDT, and LINK tokens, respectively), and not enough conclusive evidence against lognormal and truncated power-law (p-values larger than 0.3 with very weak support for lognormal and truncated power-law). The exponents γw of power-law are 1.81, 1.70, 2.14, and 1.97 for ETH, BNB, USDT, and LINK, respectively. Due to the high computational costs of fitting the distributions and performing model selection, only a random sample of around 1% of ETH and 8% of USDT nonzero balance addresses was used in analysis for these tokens.
As an introduction to the analysis of the four tokens that we study, i.e., ETH, BNB, USDT, and LNK, in Figure 2 we display a set of basic statistics: the market price of the tokens analysed, number of new daily nodes, and number of new daily edges as a function of time. We also list basic network properties fow the four tokens in Table 3. In the upper panel of Figure 2, we show the market price (in US Dollars), which is—arguably—a reasonable proxy measure to show the success of these tokens. Due to its stablecoin design, the daily market price for USDT fluctuates only minimally (around 1 USD) in comparison with other “traditional” cryptoassets, which show a high volatility.
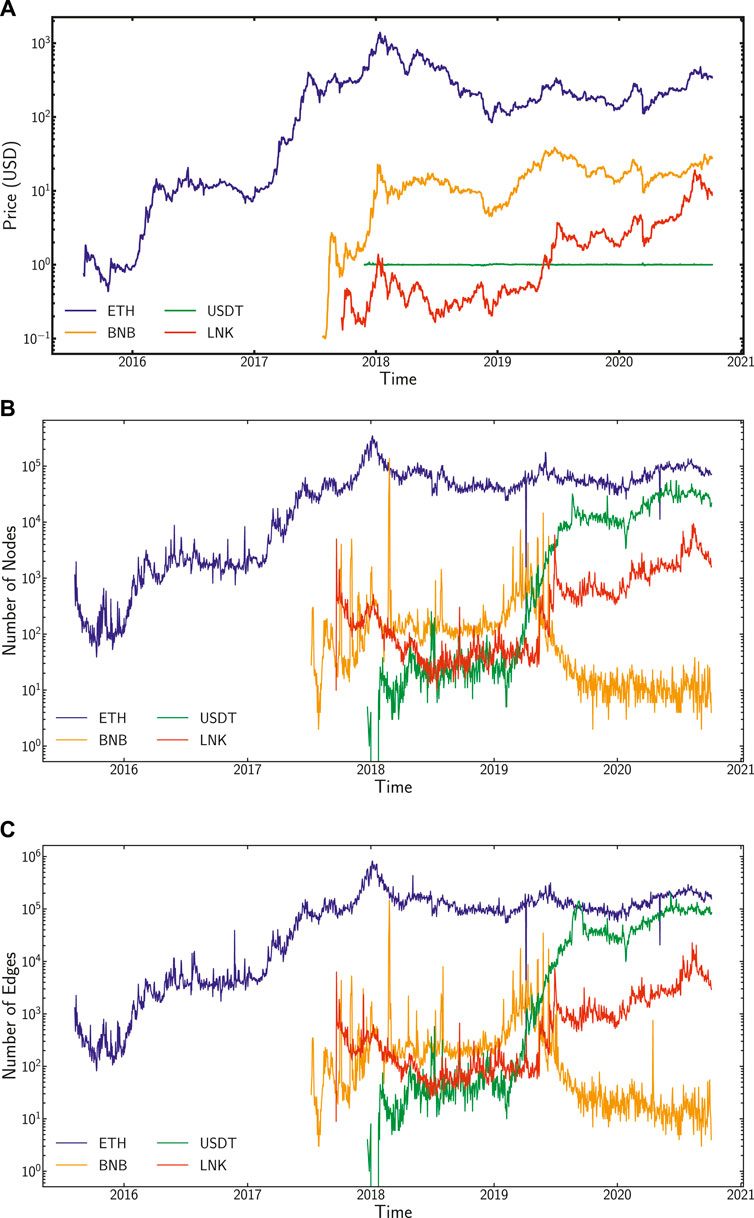
FIGURE 2. We plot basic statistics of the data analysed. In the (A), we show, as a function of time the closing daily market price of ETH, BNB, USDT, and LNK in US Dollars. For the tokens, the time series begins with the deployment of the smart contract into the blockchain. In the (B,C), we show the number of new nodes (resp., edges) every day for the aggregate network introduced in this study.
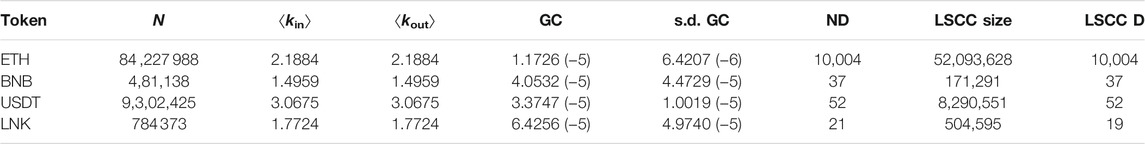
TABLE 3. Basic Network properties for the different tokens. N is the number of nodes, ⟨kin⟩ is the average in-degree, ⟨kout⟩ is the average out-degree, GC is the Global Clustering Coefficient while s.d. GC is the standard deviation for the Global Clustering coefficient. ND is the network diameter, LSCC Size is the Largest Strongly Connected Component Size expressed in nodes while LSCC D is the Largest Strongly Connected Component Diameter.
We observe that the daily number of active nodes (i.e., the number of addresses) and the daily number of active edges (i.e., the number of transactions) in ETH have been steadily growing until the end of the bullish market in 2018 (Figures 2B,C). We identify a peak in both nodes and edges coinciding with the end of the 2018 bullish market for cryptocurrencies. A similar gradually growing scenario, although not covered by our graphs, has taken place during the first months of 2021. At the end of our data collection period, i.e., October 6, 2020, there were 87,780,546 Ethereum addresses and 856,207,725 transactions, of which 414,743,169 with a nonzero “value” field, i.e., with current transfers of native Ether. The remaining transactions with a zero “ETH value” transfer value are smart contract transactions, which could transfer ERC-20 tokens (when calling the right smart contracts) but not directly native ETH. Regarding BNB, we observe how the move of their servers out of China in March 2018 triggered a temporary traffic peak, and the launch of the Binance Mainnet in April 2019 was decisive to bring the number of BNB nodes and edges on top of ETH to a very low number, almost constant as displayed in Figures 2B,C.
With regard to USDT and LNK, we observe as well an increase in activity since early 2019, in spite of the investigation by New York’s Attorney General in 2019. Considering Figure 2A, USDT seems to have reached the status of a worth-investing stablecoin. For LNK, its growth in activity corresponds to the fast growth of DeFi in late 2020. On a qualitative basis, it is worth mentioning that price and new daily nodes/edges seem to follow a correlated dynamics (as apparent by the profile of local extremes).
We then compute the link density d = L/N(N − 1) where L is the number of edges and N is the number of nodes. We compute link density figures using the number of active nodes and edges within daily timeframes.
Figure 3 shows the results for the network density in our data. The left panel shows the evolution of network density as a function of time. The overall trend is a steady decrease in density during the initial phase of ETH until 2018. Since then, its density has remained constant at very low values. BNB and LNK, starting from their launch in 2017, show a similar behaviour in Figure 3 but with a steeper fall. USDT density decreases rapidly in early 2018 since its start as ERC-20 token on top of Ethereum and, later on, in mid 2019, but this time at a slower pace, coinciding seemingly with an external event: the investigation in 2019 by New York’s Attorney General (NY Attorney General Press Release [47]).
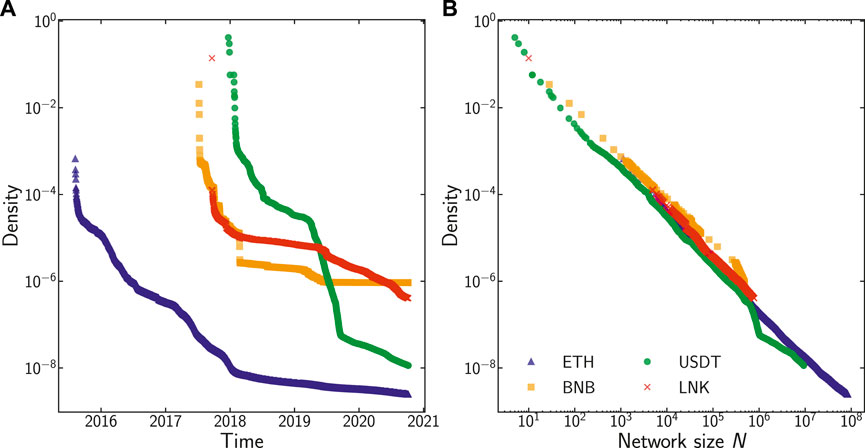
FIGURE 3. On the (A), we show the time evolution of network density, while on the (B), we have the density as a function of the network size. Both figures show the results for all the cryptoassets considered.
Figure 3A shows a parametric plot of the network density as a function of network size. Here, a common scaling d ∝ N−1 is apparent, showing that the number of edges grows linearly with network size which shows that each new node produces a limited amount of new connections in the aggregate network. Given that the transactions keep growing, this implies—from the aggregated network representation we consider—that transactions take place mostly across already existing links. This result is important for the modelling approach we consider: in preferential attachment models, the network density shows the same scaling as the one we observe in our data.
The simplest measure to characterise complex networks is its first-order node statistics, i.e., its degree distribution. The results are shown in Figure 4. First, in the left panels, we show the PDF and the CCDF of the in-degree of the network nodes, which is the focus of our extensive analysis in the next section. We observe that the distributions for in-degree and out-degree of the network nodes are heavy-tailedmeaning that the network contains nodes with degrees spanning several orders of magnitude, the largest of which is commonly referred to as hubs. Specifically, for the largest networks ETH and USDT, the results are largely compatible with a power-law distribution. This result is remarkable, considering the long evolution of the networks (for a period of six and 3 years, respectively) and the changing environment for its evolution (price, number of users, usage, etc.). In these plots, we see that LNK departs the most from this behaviour. In the right panels, it is possible to observe that the out-degree distribution exhibits a similar pattern. Common to all distributions is the existence of deviations from the power-law behaviour for very large values of in- and out-degrees kin and kin, and this means that nodes with large in- and out-degree are more common than those found in networks with scale-free degree distribution. This is characteristic of networks that have super-linear preferential attachment which leads to the formation of super-hubs.
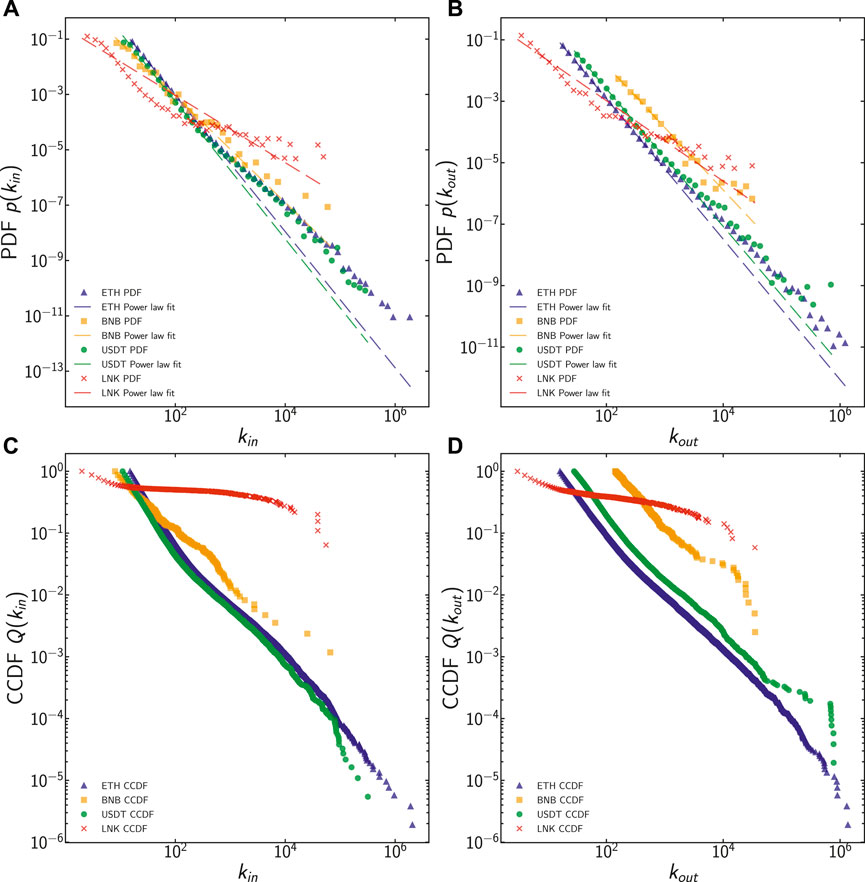
FIGURE 4. PDF and CCDF for in-degree and out-degree in ETH, BNB, USDT, and LNK at the end of the observation period.
The model selection process, as in Clauset et al. [46], shows that in ETH, both for in-degree and out-degree, the power-law is the best fit against exponential, lognormal, lognormal positive, stretched exponential. Only with truncated power-law, the advantage slightly diminishes (model selection: both for in-degree and out-degree < 10–4, but with p-values (0.99 for in-degree and 0.98 for out-degree)) so high that the results do not bear significance. The fitted power-law exponents for ETH are γin = 2.4 for the in-degree (xmin = 15) and γout = 2.29 for the out-degree (xmin = 16). Value xmin designates a minimum degree where the scaling relationship of the power-law begins, and it is determined automatically by repeatedly performing a power-law fit on all unique degrees in the data and then choosing the one with the minimum Kolmogorov-Smirnov distance between the data and the fit (Clauset et al. [46]; Alstott et al. [22]).
The same pattern for in-degree and out-degree applies as well for USDT, where a similar pattern for truncated power-law applies. Additionally, USDT seems to have a better fit for lognormal (1.74, but with a p-value that is hardly meaningful 0.28). The fitted power-law exponents for USDT are γin = 2.485 for the in-degree (xmin = 11.0) and γout = 2.242 for the out-degree (xmin = 28.0).
Similar behaviour applies to BNB in-degree and out-degree. Power-law seems to fit better than truncated power-law, but with high p-values. Lognormal seems to fit better for in-degree, but with an inconclusive p-value (0.278), while for out-degree, the lognormal fit better (1.604) with a 0.102 p-value, almost significant, but still a bit too high. The fitted power-law exponents for BNB are γin = 1.927 for the in-degree (xmin = 8.0) and γout = 2.028 for the out-degree (xmin = 142.0).
LNK token in-degree behaves very similarly to ETH, with the same inconclusive behaviour for truncated power-law. Given the fact that all the better fits were inconclusive for too high p-values, we took as reference for in-degree and out-degree always power-law fits. The fitted power-law exponents for LNK are γin = 2.955 for the in-degree (xmin = 6.0) and γout = 3.352 for the out-degree (xmin = 6.0).
Kondor et al. [24] find that the in-degree of a node, i.e., the number of transactions received by an address is positively correlated with the BTC balance of that address. In our analysis, for the largest Ethereum-based cryptoassets, we obtain wealth in-degree and wealth out-degree correlation plots with wealth. The results are depicted in Figure 5. In the panels, we have first binned (logarithmically) the wealth and then computed the mean value of the in- and out-degree of the nodes within each range of wealth.
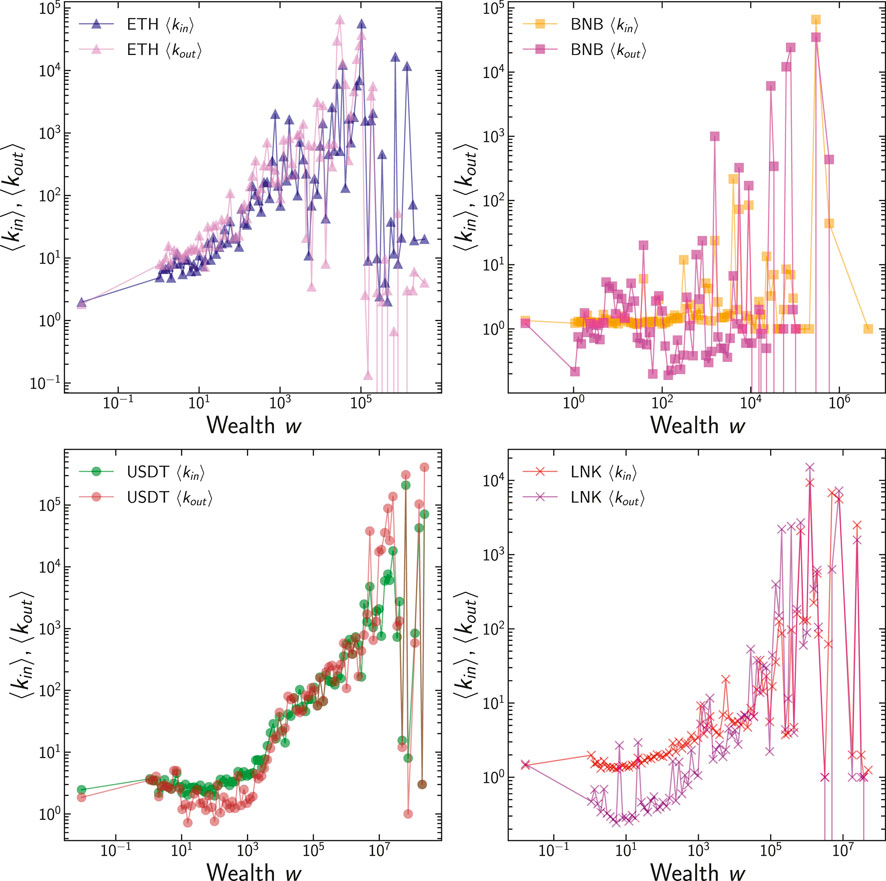
FIGURE 5. Plot of mean for ETH, BNB, USDT, and LNK. ⟨kin⟩ (in-degree), ⟨kout⟩ (out-degree), ⟨wS⟩ (wealth of the specific token).
Overall, the trend is that for increasing wealth, the in- and out-degrees of the nodes are also larger. The sole exception seems to be ETH, but the reason for this is the large multitude of addresses with a nonzero value of wealth, but nominally small in Wei (because of leftovers of transactions execution). The bump in the relationship (at around 10–3 ETH) is explained by the actual usage of ETH as a medium of exchange, with the upwards, monotonic trend. We argue that very small values of w in the plot correspond to automated usage. A similar pattern is observed on all cryptoassets analysed.
Table 4 shows the comparison of the Spearman correlation measures between kin (in-degree), kout (out-degree), and wS (wealth) for each asset. The results show always a positive and significant correlation in the wealth of all cryptoassets.
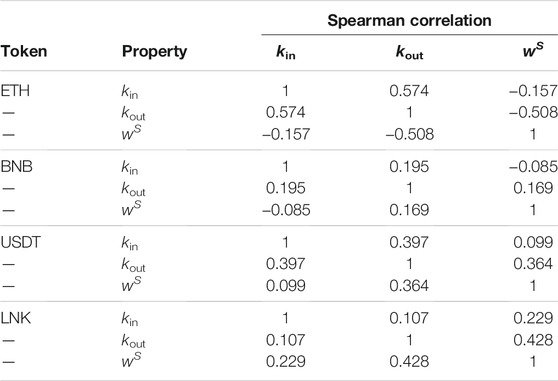
TABLE 4. Spearman correlation between kin (in-degree), kout (out-degree), wS (wealth) for each cryptoasset. All p-values are lower that 10–10, implying that we can reject the null hypothesis that the variables are not correlated.
Also, Table 5 shows the correlation between cryptoassets for each measurement considered so far. All tokens built on Ethereum are smart contracts, differently from the Ether token which is natively built inside the Ethereum network. Tokens built on top of Ethereum do not require nonzero-valued Ether transactions, i.e., Ethereum transactions moving Ether tokens. This means that addresses holding tokens built on Ethereum (such as BNB, USDT and LNK) are not always present in Ether network transactions (i.e., nonzero values transactions exchanged in Ethereum for Ether token), even though they eventually need some Ether to pay transaction fees. They might participate in just zero-valued transactions (i.e., smart contract calls). Consequently, the networks might overlap, but they do not coincide, so we can calculate the correlation between two studied tokens only based on the intersection subset of addresses, which appears on both token networks. Interestingly, as shown in Table 5, we find that in- and out-degree and wealth across cryptoassets are always positively correlated.
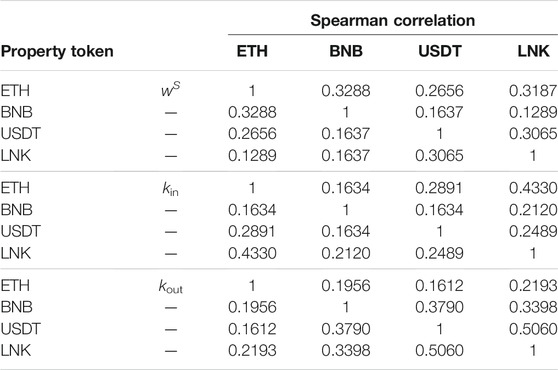
TABLE 5. Spearman ρ correlation measures between cryptoassets for the measures of kin (in-degree), kout (out-degree), and wS (wealth). All p-values are lower that 10–10, implying that we can reject the null hypothesis that the variables are not correlated.
In this section, we complement our previous analysis on the in-degree distributions with an estimation of the exponent α in Eq. (1). We calculate value of α that brings the K-S distance (or error) between the empirical distribution function and the theoretical one, in this case, a pure power-law function, to the minimum possible. If that error is minimum when α = 1, then we can confirm that the preferential attachment we observe in the corresponding blockchain transaction network is linear. If α > 1, then we identify to super-linear attachment, i.e., very few nodes in the network (superhubs) tend to connect to most nodes of the network. We perform a similar calculation for ETH, BNB, USDT, and LNK.
For ETH, we sample the network by running various iterations at p(R) = 10–3 or p(R) = 10–4, a value influenced by the network size, to decrease the computational demand, and we repeated the process at least 10 times to confirm the consistency of the results. For all the other tokens except USDT, we considered the complete dataset.
In Figure 6 we plot the rank function presented in Section 4.2, and then, we calculate the value of α that minimises the error between the fit and the empirical function. The error to fit this function of probability is minimum with the exponent α = 1.1. This means that we identify a slightly super-linear preferential attachment for ETH, which implies that very few nodes tend to connect to all nodes of the network.
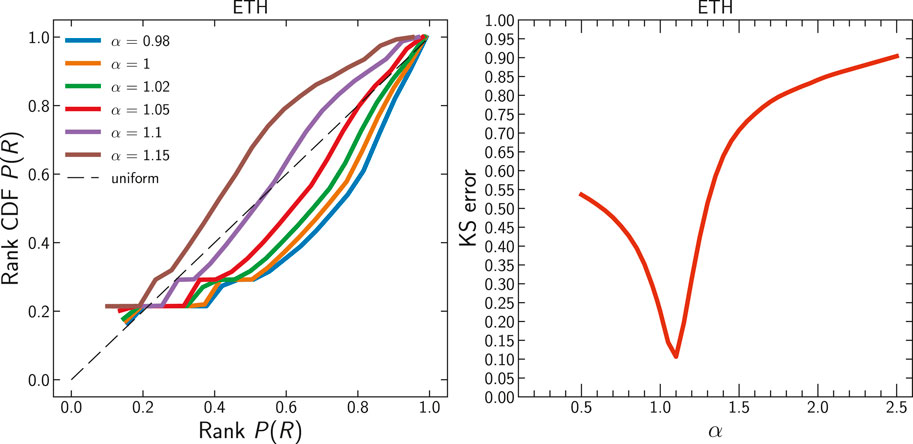
FIGURE 6. ETH. Rank function for different α. KS distance. α value minimising error.
We perform an identical exercise with the entire BNB transaction set, and without sampling, we took the whole dataset, since the smaller size made the required computations manageable. We reach a similar conclusion: preferential attachment in BNB is super-linear as well, but now with a larger value of α = 1.2 which minimises the error in the rank function. As an additional methodological verification, we repeated the calculation with a reduced sample (pR = 0.05) and obtained the same results, as in Figure 7. When we analyse the network dynamics for LNK, we also obtain a super-linear as with a value between 1.15 ≤ α ≤ 1.2 (because both minimise the error in the rank function in the compatible manner). These results are similar to those obtained for BNB. For LNK as well the full network dynamic was used to compute the rank function. The results are presented in Figure 8. Interestingly, when we analyse the stablecoin Tether/USDT, the results of the analysis change. Because of the size of the data, we sample the USDT network by taking a pR = 0.1. We confirm a preferential attachment, in this case closer to linear preferential attachment than in any other studied case. The value of α that minimises the error in the rank function is α = 1.05. The results are shown in Figure 9.
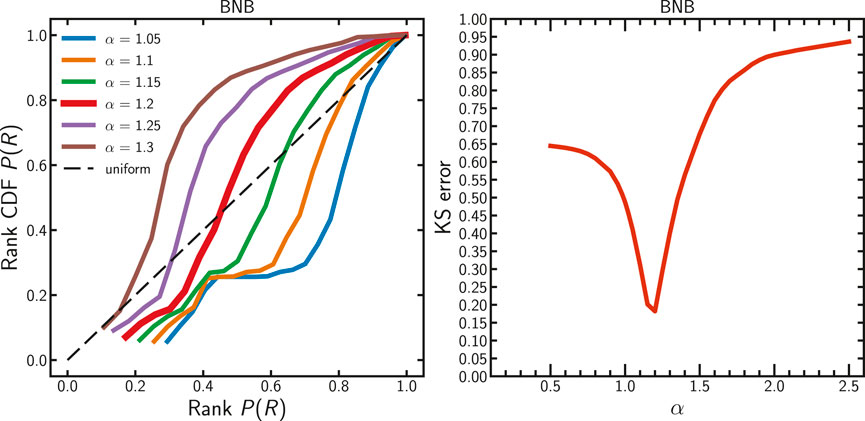
FIGURE 7. BNB. Rank function for different α. KS distance. α value minimising error.
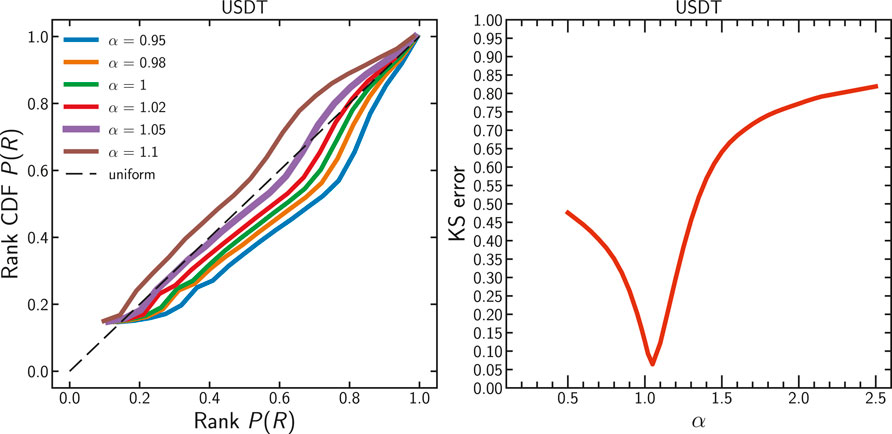
FIGURE 8. USDT. Rank function for different α. KS distance. α value minimising error.
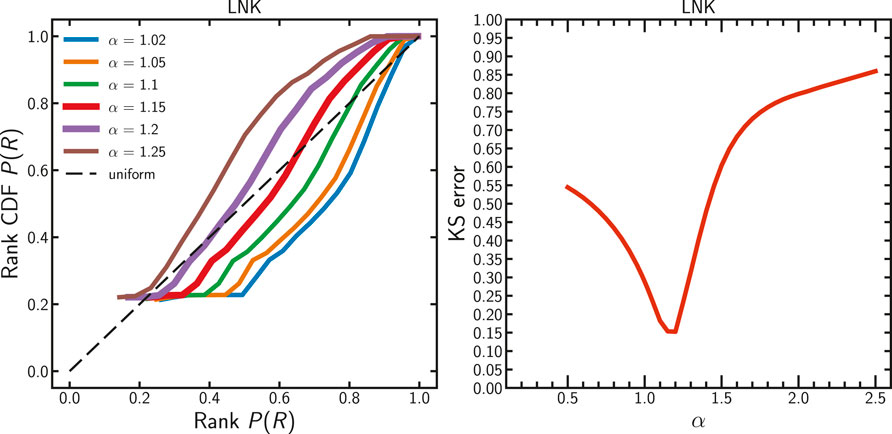
FIGURE 9. LNK. Rank function for different α. KS distance. α value minimising error.
In all these cases, the relatively large values of the KS statistic may be due to non-stationary nature of the preferential attachment process.
We finally show the evolution over time of the best fit for α for each token up to block 11 M. Figure 10 displays how α changes throughout time. The top graph is a cumulative value up to the last block for each time unit. We confirm a greater PA super-linearity in the first months of BNB. This coincides with the early stages of the BNB token and with its launch on the ETH blockchain before its “commercial” release. Both Liang et al. [27] and Kondor et al. [24] refer to an early or initial phase for the tokens they study, in which network properties are different from their next longer phase, i.e., the trading phase. Changes in α throughout time for ETH, USDT, and LNK are, however, as the top graph of Figure 10 displays, much less pronounced, although ETH’s early phase shows a higher super-linearity around α = 1.15 and only a phase of sublinearity during early 2018. In the bottom part of Figure 10, we take the best fit for α individually and not merged with the full history of best fit, to best display the variation in each individual timeframe.
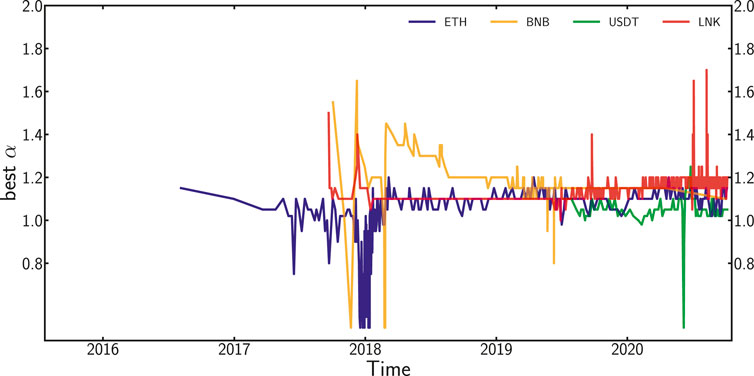
FIGURE 10. (A): evolution of best fit α (cumulative) for preferential attachment throughout time. (B): evolution of best fit α for preferential attachment computed individually and in isolation for every time windows.
A typical trait of preferential attachment is the fact that, if the preferential attachment is nonlinear, the maximum degree of the node in the network grows linearly with network size, while when preferential attachment is linear, the maximum degree of the node grows as a square root of the network size, as in Barabási and Pósfai [12]. In Figure 11 we plot the evolution of max in-degree and out-degree
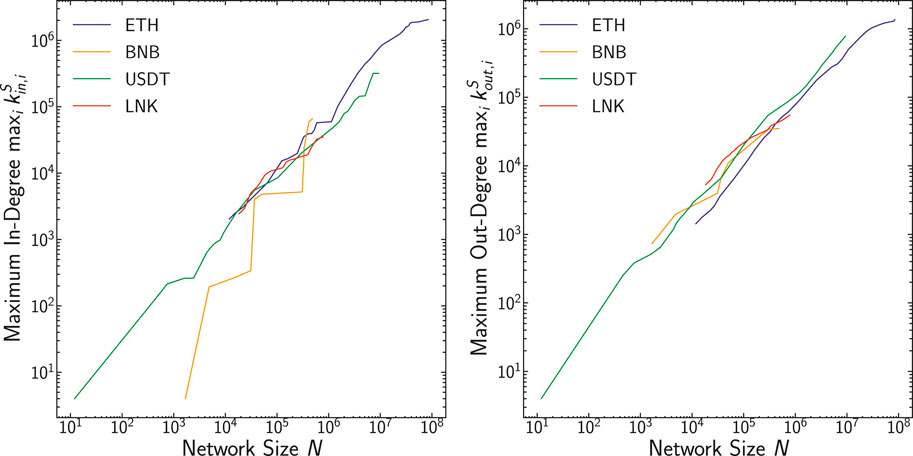
FIGURE 11. We plot the maximum in-degree
We compute the Gini Index G for in-degree and out-degree distribution as the network size N grows. Both are computed for monthly snapshots in each network. As displayed in Figure 12, the relation between network size and Gini Index G for in-degree does not appear always conclusive for all the tokens. It is clear enough for USDT, but more ambiguous and difficult to read for the other tokens.
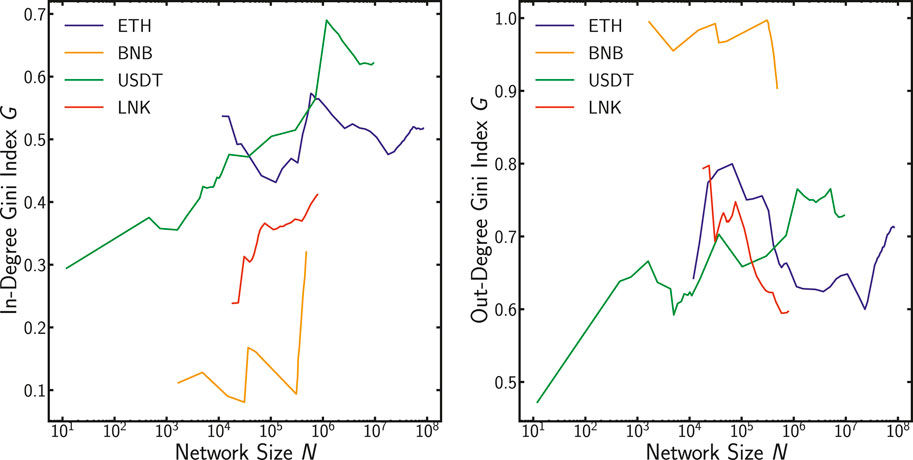
FIGURE 12. We plot the network size as a number of nodes N against the Gini index G for the in-degree distribution and out-degree. We take monthly snapshots.
From the graph, it is easy to recognize a relationship between network size and maximum in- and out-degree. This relationship could be expressed with the following formulas:
We run a linear regression to compute the coefficients, and the results of the slopes
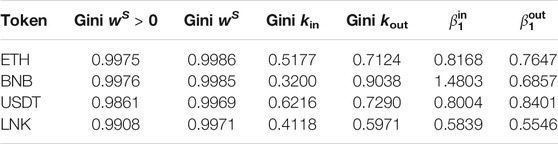
TABLE 6. Gini Coefficients for wealth (wS), in-degree (kin), and out-degree (kout). First, wS filters out nonzero value (since the graph is cumulative, old addresses appearing in the network are accounted but might no longer hold tokens). For comparison, the second wealth includes instead all the addresses in the network.
As we see in Table 6, the exponents
Blockchain-based systems are disrupting an increasing number of areas, in many cases under the claim of an increasing decentralisation in different facets. In this study, we focus on Ethereum—a public blockchain created in 2015 with the second-largest market capitalisation (as of this writing) after Bitcoin. It offers the capability to write smart contracts that enable the creation of arbitrary assets beyond the native cryptocurrency, Ether (ETH). The tokens with the largest market capitalisation are at the time of writing Binance (BNB), the currency token linked to the largest cryptoexchange in the world since 2018; Tether (USDT), the most capitalised USD-pegged stablecoin; and Link (LNK), the most used token to pay for oracle services (off-chain data providers) in the increasingly relevant decentralised finance (DeFi) environment.
For these cryptoassets (which are of different nature), we consolidate a large-scale dataset consisting of all the transactions since system creation to late 2020. Then, we build one directed aggregated network for each cryptoasset - Figure 13 shows an example visualization for BNB network. This representation is useful to characterise the space of all transactions that ever took place in these economies. They allow us to further characterise and understand the economic processes (e.g. value exchange and wealth concentration) that take place in these systems.
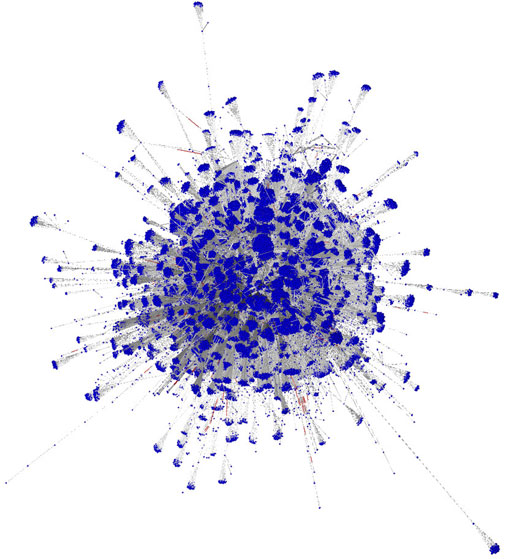
FIGURE 13. Visualization of the largest strongly connected component in the BNB network, to help visualize the structure of the studied networks.
We first analyse the distribution of wealth in the different crypto. We find that all of them are well described by a power-law distribution with an exponent close to or exceeding γw = 2 for each of the tokens. This is interesting as the model of creation, usage, or underlying concept they represent largely varies across the assets analysed. However, the degree distributions of the aggregate networks are different for each assets. All these two results hint at the fact that the economic processes are (at least) not entirely coupled to the network evolution. Further analyses show that the in- and out-degrees of nodes are only lightly correlated between network nodes present in the different tokens. This serves as a justification to — in this first study — analyse the network evolution of each token separately and without including economic aspects on it. However, more detailed approaches will require a multiplex network approach.
Our study hints that growth and concentration measures can be characterised by complex network topology calculations. First, we identify that the addition of new links to these networks increases linearly with network size (as in other preferential attachment growth processes) and that the degree distributions are characterised by heavy-tailed distributions with over-representation of hubs. In contrast to the previous analyses on Bitcoin by Kondor et al. [24], we find that preferential attachment (PA) in these public blockchain networks is slightly super-linear in ETH with an α = 1.1 and super-linear in BNB and LNK with an α = 1.2, and very close to linear in USDT with an α = 1.05. A super-linear PA indicates a high degree of concentration of transactions in a few hub nodes induced by the way the network grows.
Kunegis et al. [42] measured preferential attachment coefficients in many online networks and argue that online interaction networks—those that consist of people interacting directly or indirectly between each other, commonly exhibit super-linear degree distributions. This includes online networks where interaction is direct, for example, in an online social network such as Twitter, as well as indirect where interaction happens through an intermediary content, for example in online forums. In such interaction networks, the users or content with which users interacted in the past tends to attract more interaction in the future in a super-linear fashion. Considering that blockchain transaction networks are also a form of an interaction network where users perform transactions between addresses associated with them, it is not surprising that they also exhibit a super-linear preferential attachment where a small number of nodes asymptotically collect most of the connections.
Given the hybrid nature of a socio-technical-economical system such as the cryptocurrency market, where speculative investments, software agents, and smart contracts play such a defining role, the characterisation of its transaction network as an interaction network leaves the door open for many interesting considerations.
Surprisingly, different aspects of the evolution of these economies show large-scale regularities that are unaffected by the heterogeneous nature of the agents involved, considering that data are composed of users, exchange markets, organisations, automated accounts, etc.
We suggest continuing this study by expanding its realm in two dimensions. First, by analysing all tokens in the Ethereum ecosystem in order to identify common regularities across them, we suggest to perform a similar study with other tokens and blockchains to make an attempt to generalise conditions under which PA turns super-linear in public blockchains and, additionally, to endeavour the identification of any other token with a different PA type than the underlying blockchain on top of which it runs. Second, by extending the analyses to include the more recent development because this period coincides with a strong bullish crypto-market with high record-breaking trading volumes and market prices. It is of interest to see whether the identified PA features remain roughly the same over time or whether they change fundamentally. Third, additional directions for future work include the inference of statistical properties of the entire history data and investigating the temporal properties of the entire transaction network as proposed by Guo et al. [28].
The seed of this study was the comparison of “nested” tokens, i.e., BNB, USDT, and LNK run on ETH. These tokens seem to exhibit a slightly different behaviour depending on their design and not on the infrastructure they share. We suggest to further research on how the design of every token affects their network dynamics and whether a more comprehensive taxonomy and clusterisation of the token network according to their network dynamic is possible. We propose as well to study the overlap of networks, accounts, and addresses and how they influence each other across tokens, a research direction that we hinted in this study.
Finally, we also suggest studying coupling patterns between these interconnected networks and comparing them with the study by Dong et al. [48] on the optimal resilience of modular interacting networks.
The data is available in the ETH blockchain (which is a public ledger). Data was transformed with ethereum-etl tool. To gather Ethereum data, both OpenEthereum client and Turbogeth (now Erigon) were used. Besides the observations in the Data Description section, the dataset is publicly available on Google Cloud BigQuery as seen in [49] and can be queried directly from a web interface. The technical architecture of the solution connecting Google Cloud and ethereum-etl is well described in [50]. For intensive analysis (such as the ones conducted in this paper) we anyway always suggest to extract the data locally on your machine.
CT led this research providing key insights for the analysis. FD, AP, and CT designed the experiment and analysis. FD collected, cleaned and processed the data. FD and AP analysed the data and all the authors discussed the results. AP wrote successive drafts. MP performed additional computations and reviewed the paper. All authors wrote the final text and approved the final version.
CT acknowledges financial support from the University of Zurich through the University Research Priority Programme on Social Networks. AP has been partially supported by the Rey Juan Carlos University.
The authors declare that the research was conducted in the absence of any commercial or financial relationships that could be construed as a potential conflict of interest.
All claims expressed in this article are solely those of the authors and do not necessarily represent those of their affiliated organizations, or those of the publisher, the editors and the reviewers. Any product that may be evaluated in this article, or claim that may be made by its manufacturer, is not guaranteed or endorsed by the publisher.
1.[Dataset] Nakamoto S. Bitcoin: A Peer-To-Peer Electronic Cash System (2008). Available at: Nakamotoinstitute.org. Published online by https://bitcoin.org/bitcoin.pdf (Accessed April 11, 2016).
2.[Dataset] coinmarketcap. Today’s Cryptocurrency Prices by Market Cap (2021). Available at: https://coinmarketcap.com (Accessed January 202124.
3.[Dataset] Buterin V. Ethereum White Paper (2013). Available at: https://ethereum.org/en/whitepaper/(Accessed February 28, 2021).
5. Tasca P, Tessone CJ. A Taxonomy of Blockchain Technologies: Principles of Identification and Classification. Ledger (2019) 4:1-39. doi:10.5195/ledger.2019.140
6. Spychiger F, Tasca P, Tessone CJ. Unveiling the Importance and Evolution of Design Components Through the ”Tree of Blockchain”. Front Blockchain (2021) 3:60. doi:10.3389/fbloc.2020.613476
7. Reid F, Harrigan M. An Analysis of Anonymity in the Bitcoin System. In: 2011 IEEE Third International Conference on Privacy, Security, Risk and Trust and 2011 IEEE Third International Conference on Social Computing (2011). 1318–26. doi:10.1109/PASSAT/SocialCom.2011.79
8. Garcia D, Tessone CJ, Mavrodiev P, Perony N. The Digital Traces of Bubbles: Feedback Cycles Between Socio-Economic Signals in the Bitcoin Economy. J R Soc Interf (2014) 11:20140623. doi:10.1098/rsif.2014.0623
9. Bovet A, Campajola C, Mottes F, Restocchi V, Vallarano N, Squartini T, et al. The Evolving Liaisons Between the Transaction Networks of Bitcoin and its Price Dynamics. arXiv [Preprint] (2019). Available from https://arxiv.org/abs/1907.03577.
10. Wheatley S, Sornette D, Huber T, Reppen M, Gantner RN. Are Bitcoin Bubbles Predictable? Combining a Generalized Metcalfe's Law and the Log-Periodic Power Law Singularity Model. R Soc Open Sci (2019) 6:180538. doi:10.1098/rsos.180538
11. Vallarano N, Tessone CJ, Squartini T. Bitcoin Transaction Networks: An Overview of Recent Results. Front Phys (2020) 8:286. doi:10.3389/fphy.2020.00286
13. Newman MEJ. The Structure and Function of Complex Networks. SIAM Rev (2003) 45:167–256. doi:10.1137/s003614450342480
14. Cimini G, Squartini T, Saracco F, Garlaschelli D, Gabrielli A, Caldarelli G. The Statistical Physics of Real-World Networks. Nat Rev Phys (2019) 1:58–71. doi:10.1038/s42254-018-0002-6
15. Mariani MS, Ren Z-M, Bascompte J, Tessone CJ. Nestedness in Complex Networks: Observation, Emergence, and Implications. Phys Rep (2019) 813:1–90. doi:10.1016/j.physrep.2019.04.001
16. Schweitzer F, Fagiolo G, Sornette D, Vega-Redondo F, Vespignani A, White DR. Economic Networks: The New Challenges. Science (2009) 325:422–5. doi:10.1126/science.1173644
17. Vespignani A. Modelling Dynamical Processes in Complex Socio-Technical Systems. Nat Phys (2012) 8:32–9. doi:10.1038/nphys2160
18. Price DDS. A General Theory of Bibliometric and Other Cumulative Advantage Processes. J Am Soc Inf Sci (1976) 27:292–306. doi:10.1002/asi.4630270505
19. Barabási A-L, Albert R. Emergence of Scaling in Random Networks. Science (1999) 286:509–12. doi:10.1126/science.286.5439.509
20. Albert R, Barabási A-L. Statistical Mechanics of Complex Networks. Rev Mod Phys (2002) 74:47–97. doi:10.1103/RevModPhys.74.47
21. Eom Y-H, Fortunato S. Characterizing and Modeling Citation Dynamics. Plos One (2011) 6:e24926–7. doi:10.1371/journal.pone.0024926
22. Alstott J, Bullmore E, Plenz D. Powerlaw: A python Package for Analysis of Heavy-Tailed Distributions. Plos One (2014) 9(1):e85777. doi:10.1371/journal.pone.0085777
23. Krapivsky PL, Redner S, Leyvraz F. Connectivity of Growing Random Networks. Phys Rev Lett (2000) 85:4629–32. doi:10.1103/PhysRevLett.85.4629
24. Kondor D, Pósfai M, Csabai I, Vattay G. Do the Rich Get Richer? an Empirical Analysis of the Bitcoin Transaction Network. Plos One (2014) 9:e86197. doi:10.1371/journal.pone.0086197
25. Di Francesco Maesa D, Marino A, Ricci L. Data-Driven Analysis of Bitcoin Properties: Exploiting the Users Graph. Int J Data Sci Anal (2018) 6:63–80. doi:10.1007/s41060-017-0074-x
26.[Dataset] Sommer D. Processing Bitcoin Blockchain Data Using a Big Data-specific Framework (2019). Available at: https://files.ifi.uzh.ch/CSG/staff/scheid/extern/theses/BA-D-Sommer.pdf (Accessed February 03, 2021).
27. Liang J, Li L, Zeng D. Evolutionary Dynamics of Cryptocurrency Transaction Networks: An Empirical Study. Plos One (2018) 13(8):e0202202. doi:10.1371/journal.pone.0202202
28. Guo D, Dong J, Wang K. Graph Structure and Statistical Properties of Ethereum Transaction Relationships. Inf Sci (2019) 492:58–71. doi:10.1016/j.ins.2019.04.013
29. Somin S, Gordon G, Altshuler Y. Social Signals in the Ethereum Trading Network. arXiv [Preprint] (2018). Available from https://arxiv.org/abs/1805.12097.
30. Ferretti S, D’Angelo G. On the Ethereum Blockchain Structure: A Complex Networks Theory Perspective. Concurrency Comput Pract Experience (2020) 32:e5493. doi:10.1002/cpe.5493
31. Somin S, Gordon G, Pentland A, Shmueli E, Altshuler Y. Erc20 Transactions over Ethereum Blockchain: Network Analysis and Predictions. arXiv [Preprint] (2020). Available from https://arxiv.org/abs/2004.08201.
32. Lin D, Wu J, Yuan Q, Zheng Z. Modeling and Understanding Ethereum Transaction Records via a Complex Network Approach. IEEE Trans Circuits Syst (2020) 67:2737–41. doi:10.1109/tcsii.2020.2968376
33.[Dataset] Medvedev E. Ethereum Etl (2020). Available at: https://github.com/blockchain-etl/ethereum-etl. A set of tool for Ethereum data transformation.
34.[Dataset] etherscan.io. Blockchain Size (Mb). The Total Size of the Blockchain Minus Database Indexes in Megabytes (2021). Available at: https://etherscan.io/tokens?sortcmd=remove&sort=marketcap&order=desc (Accessed January 13, 2021).
35.Ethereum.org ERC-20 Specification.) (2015). Available from https://ethereum.org/en/developers/docs/standards/tokens/erc-20/ (Accessed March 5, 2021).
36.[Dataset] Binance. Binance Coin Whitepaper (2017). Available at: https://whitepaper.io/document/10/binance-whitepaper (Accessed March 06, 2021).
37.[Dataset] Tether. Tether Whitepater (2016). Available at: https://tether.to/wp-content/uploads/2016/06/TetherWhitePaper.pdf (Accessed February 28, 2021).
38.[Dataset] coinmarketcap.com. Top Defi Tokens by Market Capitalization (2021). Available at: https://coinmarketcap.com/defi (Accessed February 03, 2021).
39.[Dataset] Ellis S, Juels A, Nazarov S. Chainlink, a Decentralized Oracle Network (2017). Available at: https://link.smartcontract.com/whitepaper (Accessed March 05, 2021).
41. Dorogovtsev SN, Mendes JFF. Evolution of Networks. Adv Phys (2002) 51:1079–187. doi:10.1080/00018730110112519
42. Kunegis J, Blattner M, Moser C. Preferential Attachment in Online Networks: Measurement and Explanations. arXiv [Preprint] (2013). Available from https://ui.adsabs.harvard.edu/abs/2013arXiv1303.6271K.
44. Levy M, Solomon S. New Evidence for the Power-Law Distribution of Wealth. Physica A: Stat Mech its Appl (1997) 242:90–4. doi:10.1016/s0378-4371(97)00217-3
45. Brzezinski M. Do wealth Distributions Follow Power Laws? Evidence from 'rich Lists'. Physica A: Stat Mech its Appl (2014) 406:155–62. doi:10.1016/j.physa.2014.03.052
46. Clauset A, Shalizi CR, Newman MEJ. Power-law Distributions in Empirical Data. SIAM Rev (2009) 51:661–703. doi:10.1137/070710111
47.[Dataset] NY Attorney General Press Release. Attorney General Annouces Ongoing Investigation into Bitfinex and Tether (2019). Available at: https://ag.ny.gov/press-release/2019/attorney-general-james-announces-court-order-against-crypto-currency-company (Accessed March 12, 2021).
48. Dong G, Wang F, Shekhtman LM, Danziger MM, Fan J, Du R, et al. Optimal Resilience of Modular Interacting Networks. Proc Natl Acad Sci USA (2021) 118:e1922831118. doi:10.1073/pnas.1922831118
49.[Dataset] Medvedev E. Ethereum-etl Data in Google Cloud (2018). Available at: https://console.cloud.google.com/bigquery?p=bigquery-public-data&d=crypto_ethereum&t=transactions&page=table (Accessed August 03, 2021).
50.[Dataset] Medvedev E. Ethereum-etl in Google Cloud Deep Dive (2018). Available at: https://cloud.google.com/blog/products/data-analytics/ethereum-bigquery-how-we-built-dataset (Accessed August 03, 2021).
Keywords: preferential attachment, wealth, complex networks, Ethereum, Bitcoin, token, cryptocurrencies
Citation: De Collibus FM, Partida A, Piškorec M and Tessone CJ (2021) Heterogeneous Preferential Attachment in Key Ethereum-Based Cryptoassets. Front. Phys. 9:720708. doi: 10.3389/fphy.2021.720708
Received: 04 June 2021; Accepted: 14 September 2021;
Published: 27 October 2021.
Edited by:
Jianguo Liu, Shanghai University of Finance and Economics, ChinaReviewed by:
Zhen Wang, Hangzhou Dianzi University, ChinaCopyright © 2021 De Collibus, Partida , Piškorec and Tessone . This is an open-access article distributed under the terms of the Creative Commons Attribution License (CC BY). The use, distribution or reproduction in other forums is permitted, provided the original author(s) and the copyright owner(s) are credited and that the original publication in this journal is cited, in accordance with accepted academic practice. No use, distribution or reproduction is permitted which does not comply with these terms.
*Correspondence: Francesco Maria De Collibus, ZnJhbmNlc2NvLmRlY29sbGlidXNAYnVzaW5lc3MudXpoLmNo
Disclaimer: All claims expressed in this article are solely those of the authors and do not necessarily represent those of their affiliated organizations, or those of the publisher, the editors and the reviewers. Any product that may be evaluated in this article or claim that may be made by its manufacturer is not guaranteed or endorsed by the publisher.
Research integrity at Frontiers
Learn more about the work of our research integrity team to safeguard the quality of each article we publish.