
94% of researchers rate our articles as excellent or good
Learn more about the work of our research integrity team to safeguard the quality of each article we publish.
Find out more
ORIGINAL RESEARCH article
Front. Phys., 02 December 2021
Sec. Interdisciplinary Physics
Volume 9 - 2021 | https://doi.org/10.3389/fphy.2021.720533
This article is part of the Research TopicImpacts of Global Warming on Ecology and Meteorology and the Related Physical Mechanisms, Evaluation and PredictionView all 18 articles
The reanalysis of sea surface wind speed is compared with the measured wind speed of five offshore wind towers in Zhejiang, China. The applicability of reanalysis data in the Zhejiang coastal sea surface and the climatic characteristics of sea surface wind power density is analyzed. Results show that the reanalysis of wind field data at the height of 10 m can well capture the wind field characteristics of the actual sea surface wind field. The sea surface wind power density effective hours increases from west to east and north to south. Then Empirical orthogonal function (EOF) is used to analyze the sea surface wind power density anomaly field, and the first mode is a consistent pattern, the second mode is a North-South dipole pattern, the third mode is an East-West dipole pattern respectively. The stability of wind energy resources grows more stable with increasing distance from the coast, and the northern sea area which is far away from the coastal sea is more stable than that of the southern sea area. The yearly linear trend of sea surface wind power density is in an East-West dipole pattern respectively. The wind energy resources are more stable farther from the coast, and the wind energy resources in the northern sea are more stable than that of the southern sea. The yearly linear trend of sea surface wind power density is the East-West dipole type, the seasonal linear trend is a significant downward trend from West to East in spring, and on the contrary in summer, a non-significant trend in autumn and winter. The monthly change index shows that the linear trend near the entrance of Hangzhou Bay in Northern Zhejiang is of weak increase or decrease, which is good for wind energy development. When the wind power density is between 0 and 150 W·m−2, its frequency mainly shows the distribution trend of high in the West and low in the East, but the wind power density is between 150 and 600 W·m−2, its distribution is the opposite.
With the rapid development of human society, all kinds of fossil fuels have been overdeveloped and used, and further causing a dramatic increase in greenhouse gases [1–3]. As renewable and clean energy resources, wind and wave energy resources are of great significance for environmental protection and greenhouse effect mitigation. In recent decades, wind energy, especially offshore wind energy, has developed rapidly all over the world [4–7]. In 2015, the total installed capacity of wind energy in the world surpassed that of nuclear power, becoming the mainstream form of clean energy development [8]. China, as a developing country with large energy consumption, actively encourages and guides the development and utilization of renewable energy [9]. In 2011, the China Meteorological Administration completed and released the detailed investigation and assessment results of national wind energy resources. Based on the annual average wind power density of 70 m high layer greater than 300 W/m2, the technical development volume of wind energy resources within the water depth of 5–50 m is 500 million KW [10]. According to the scale and total amount of wind energy resources that can be developed in China, maturity of development technology and economy, and so on, all indicators are in line with the basic principles in the field of renewable energy development in China. It is expected that the development of near sea wind fields will be a key direction of wind power development after 2020, and the technologies of wind power complementation and energy storage will be actively developed to increase the utilization rate of wind energy [11]. A study by the Global Wind Energy Council (GWEC) shows that the global installed capacity of offshore wind reached a record of 6.1 GW in 2019, accounting for 10% of new installed capacity; 2020 is expected to be a new record year for wind energy, and China’s offshore wind project development and investors will commission their offshore wind projects before 2021 in order to make good use of relevant subsidies [12]. Wind energy resource observation is an essential way for assessment [13, 14]. The conventional offshore observation is mainly point observation [15], that is, through the on-site real-time observation methods such as island meteorological stations [16], buoy station, lidars, wind measuring tower, etc., to obtain the wind speed of the nearby sea area and evaluate the local wind energy resources. In addition, satellite remote sensing [17, 18], numerical simulation [19], reanalysis data [20, 21] and other methods can also obtain the offshore wind speed.
Zhejiang Province is located on the southeast coast. The coastline is 6,696 km long, the longest of any Chinese province. The development and utilization of wind energy resources have a very broad prospect. There are relatively few studies on the trend of sea surface wind energy changes, which is closely related to the medium and long-term planning of wind energy resources development. At present, the observation and evaluation of wind energy resources in Zhejiang coastal areas are mostly scattered observation models of offshore wind towers. The observation time of wind towers is short and the distribution is uneven [22]. At the same time, typhoons and tropical cyclones attack Zhejiang every year, which makes the observation results less representative for the adjacent sea areas [23]. To better analyze the characteristics of wind energy resources in the Zhejiang area, this paper uses the reanalysis data from the European Center of Medium-Range Weather Forecast (ECMWF) to analyze the climate change characteristics of sea surface wind energy in the coastal areas of Zhejiang, and the data of five local wind towers are selected to calibrate the reanalysis data. In addition, wind energy resource development and utilization in Zhejiang coastal areas are discussed against the background of climate change.
According to the suggestion of relevant literature [24], the data used in this paper mainly include: 1) the real-time observation data of Zhejiang coastal wind towers, with a time resolution of 10min, and the observation data and location information are shown in Table 1 and Figure 1; 2) The reanalysis data of ERA-Interim is published by ECMWF, including the sea surface 10 m wind speed, sea surface temperature, sea surface pressure. The spatial resolution is 0.125° × 0.125°, the spatial range is 120° E-125° E, 27.125° N-30.75° N. The time resolution is four times every day (UTC: 00, 06, 12, 18) from 1979 to 2018, the reanalysis data can be obtained from https://apps.ecmwf.int/datasets/data/interim-full-daily/levtype=sfc/ [25, 26].
The amount of wind energy resources in a place is usually characterized by density of wind power (Dwp), which refers to the power per unit area perpendicular to the wind direction. The calculation method is as follows:
in the formula, DWP is the average wind power density (w/m2), n is the number of records in the set time period, vi is the wind speed value of the ith record, and
Among them,
EOF is a common way for atmospheric study to get the distribution characteristics [27, 28]. EOF analysis of the wind power density anomaly field for a total of 40 years from 1979 to 2018 was carried out. First, we calculate the output of its standardized eigenvector and time series, i.e., solve the covariance matrix of sea surface wind energy resource anomaly, and then calculate its eigenvalues and eigenvectors. Then the main spatial distribution modes of the wind power density anomaly field are obtained.
To obtain the variation coefficient analysis of the wind power density near the Zhejiang coast for the most recent 40 years [29], we first calculated the standard deviation of the wind power density, and the average wind power density across the 40 years. Then, the variation coefficient which the standard deviation is divided by the average value could be carried out.
The most effective way to evaluate the reliability of reanalysis data is to compare it with observation data. As shown in Figure 2, the daily wind speed correlation between a wind tower and the ERA-Interim of the adjacent grid is close, and the correlation coefficients are above 0.8, passing the t-test of significance level α = 0.001. The ERA-Interim data can capture the wind speed better in the north sea area than the south sea area of Zhejiang. Due to the high correlation, their trends are generally consistent, so the reanalysis of wind speed data at the height of 10 m is credible. In the following parts, the climate characteristics of sea surface wind energy are estimated by reanalysis data.
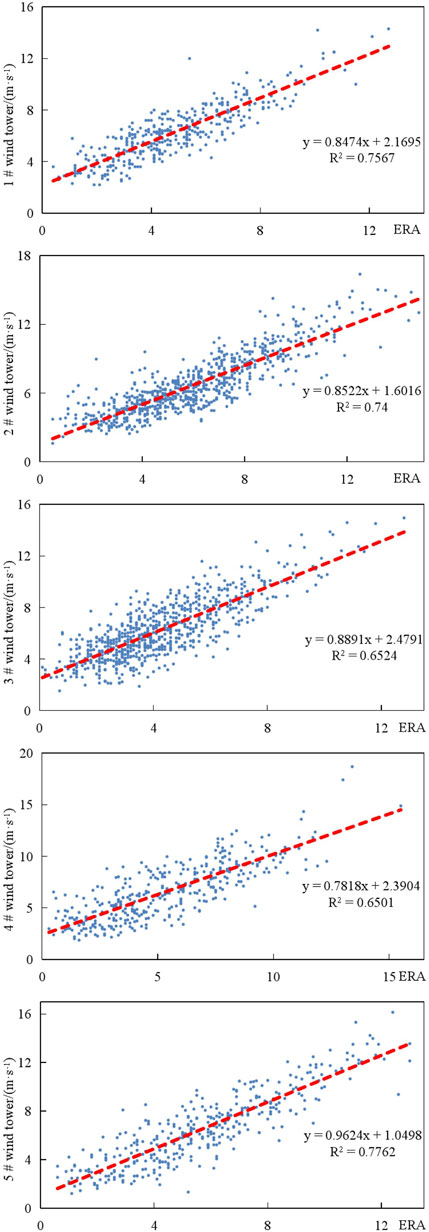
FIGURE 2. The relevant information between measured wind speed and reanalysis data of ERA-Interim (units:m·s−1). The blue point represents the wind speed, the red dotted line represents the linear trend.
Generally, a wind speed of 3 to 25 m/s is the most efficient for the collection and conversion of wind energy resources, which is called effective wind speed [30, 31]. Wind towers #1 and #2 have more hours of effective wind speed, as shown in Table 2. The effective wind energy hours near the wind tower are all more than 80%, and the percentage of effective wind energy hours in Hangzhou Bay is over 86%. The percentage of effective wind energy hours near wind tower #2 is 90%, which indicates that effective wind energy hours are positively correlated with the coastal distance. The percentage of effective wind energy hours near wind towers #4 and #5 is 83%. As shown in Figure 3, the percentage of offshore effective wind energy hours increases with latitudinal offshore distance, and decreases southward with longitudinal distance.
In order to provide a reference for the development and utilization of offshore wind energy resources, the spatial and temporal distribution characteristics of coastal wind energy resources in Zhejiang are analyzed. As shown in Figure 4, the spatial distribution of the climate mean value of wind energy resources on the Zhejiang sea surface across 1979–2018 is calculated, and the mean value of sea surface wind power density near Hangzhou Bay is lower than other coastal areas. The climatic mean value of sea surface wind power density increases with distance from the coastline, and decreases from south to north with the same offshore distance in different latitudes. From the perspective of wind power density, the location of offshore wind fields should be toward to the south, yielding higher benefits. However, moving south leads to greater risk of typhoon disasters being undertaken, meaning the necessary wind resistance design standard becomes higher and so does the cost.
The amount of offshore wind energy resources is affected by wind speed, which changes with the seasons, especially in winter and summer when the sea surface wind speed is more sensitive to the influence of sea-land temperature difference. The spatial distribution of climate average wind power density on the Zhejiang sea surface in each season from 1979 to 2018 is calculated, as shown in Figure 5. In terms of season, the surface wind power density near the Hangzhou bay estuary and the Zhejiang coastal sea does not change significantly with seasons. In other areas of the sea surface wind power density is the highest in winter, followed by autumn, and the lowest in spring and summer. In terms of space, the seasonal variation range of sea surface wind power density increases with the increase of offshore distance.
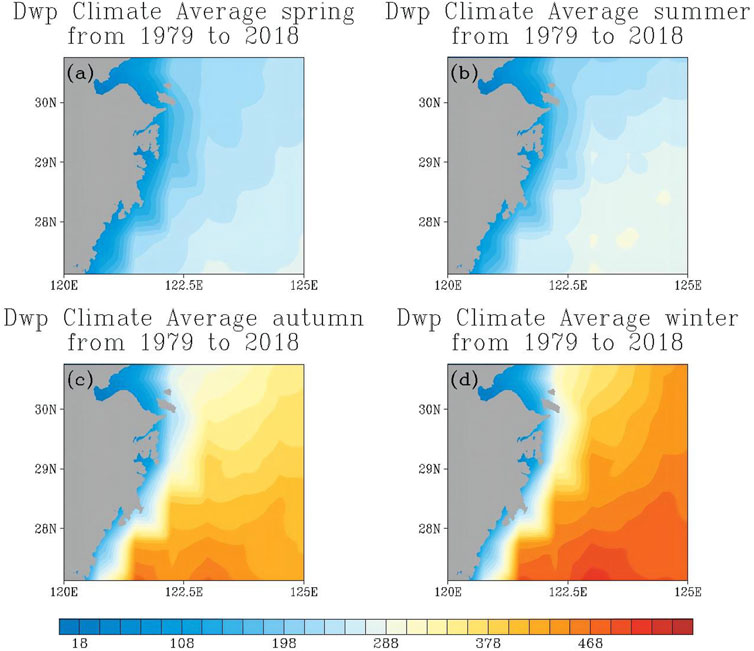
FIGURE 5. The seasonal climate average of Zhejiang coastal wind energy resource (units:w·m−2):(a) the spring Dwp; (b) the summer Dwp; (c) the autumn Dwp; (d) the winter Dwp.
In order to further clarify the distribution of sea surface wind energy resources in various time periods, the spatial distribution of climatic average wind power density of Zhejiang in each month from 1979 to 2018 is calculated, as shown in Figure 6, the Zhejiang coastal wind power density generally shows a “V” change trend as the month goes on, the variation of the wind power density near the coast of Zhejiang is not obvious, on the contrary, the variation of the sea surface wind power density far from the coast of Zhejiang with the month is obvious, which is similar to the seasonal variation. The evolution speed of sea surface wind power density from high to low is faster than that from low to high. The reason may be that the strong southward cold air of the north in winter causes the obvious increasement of the sea surface wind speed, and then the power density of the sea surface wind is greater than that in other seasons.
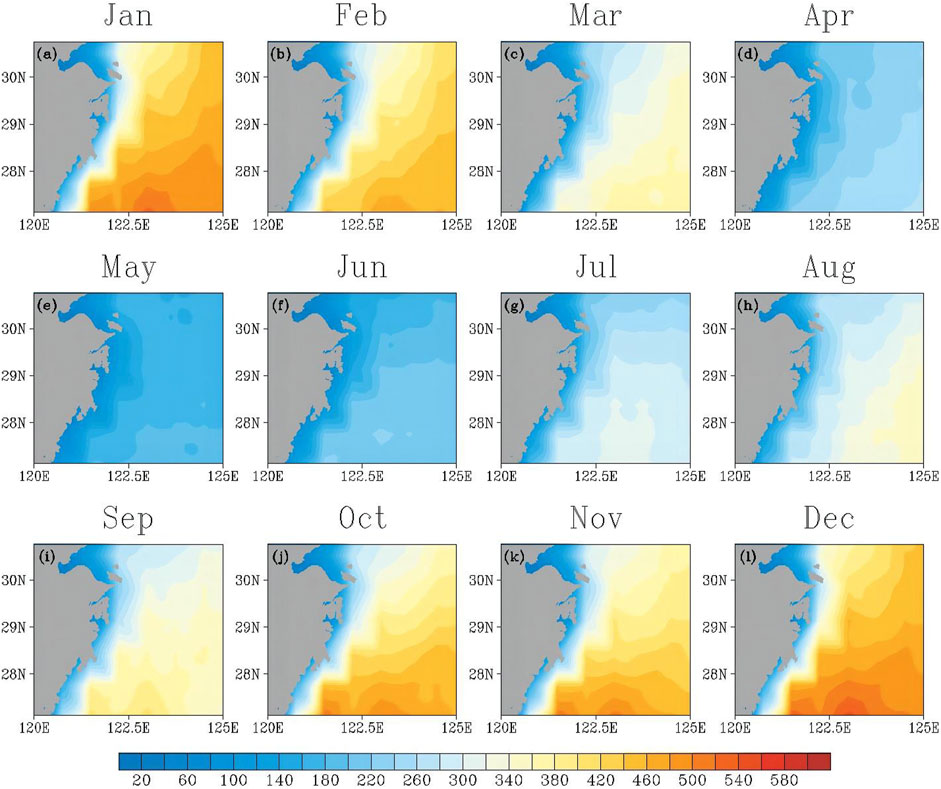
FIGURE 6. The monthly climate average of Zhejiang coastal wind energy resource (units:w·m−2). (a-l) represent January to December respectively.
The sea area of Zhejiang is vast and the sea surface wind speed has much differences, which directly leads to the strong locality of the spatial distribution of sea surface wind energy. In order to further analyze the spatial and temporal variation characteristics of sea surface wind energy, EOF analyzed the annual average power density anomaly field of sea surface wind energy in 40 years, as shown in Figure 7, the variance contribution rate of the first three modes reached 87.3% and passed the North significance test. The spatial and temporal fields of the first three modes can basically reflect the variation characteristics of the sea surface wind power density in the Zhejiang coastal area.
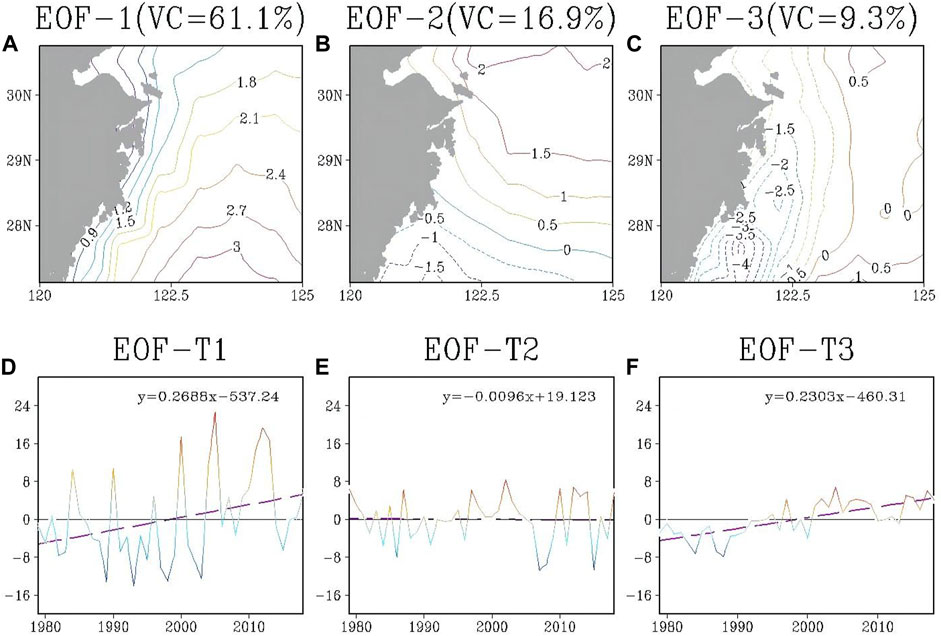
FIGURE 7. (A–C) Distribution patterns and (D–F) time coefficients of the first three modes of sea surface wind power density anomaly field in Zhejiang coastal area: (A,D) the first mode; (B,E) the second mode; (C,F) the third mode.
The variance contribution rate of the first mode has reached 61.1%, which is much higher than the other modes. As shown in Figure 7A, the first mode mainly reflects a consistency increasing or decreasing trend of sea surface wind power density in Zhejiang coastal sea area. The center is in the southeast of Zhejiang coastal sea area, the value of space field contours near Zhejiang coastal is small, which indicates that the inter-annual variation of the wind power density in the Zhejiang coastal area is smaller than that in the eastern sea area, the time coefficient in Figure 7D shows an obvious upward trend, and it mainly presents positive anomaly value in recent years.
As shown in Figure 7B, the second mode mainly reflects that the sea surface wind power density along the coast of Zhejiang presents a North-South dipole type change trend with north latitude of 28°N as the boundary, the variation range of time coefficient in Figure 7E is small, so the trend of inter-annual variation can be ignored.
As shown in Figure 7C, the third mode mainly reflects that the wind power density in the Zhejiang coastal region shows the trend of East-West dipole type change trend, and the change range on the west side is larger than that on the east side, and the center on the west side is in the southwest coastal Zhejiang. The variation range of time coefficient in Figure 7F shows an upward trend with the change of time, and in recent years it has shown a weak positive anomaly.
For wind power development enterprises and the State Grid, the stability of offshore wind energy directly affects the development potential of wind energy resources and the rational planning of power generation into the grid. In the energy assessment of wave energy, tidal energy, the coefficient of variation has been widely used [32]. The smaller the coefficient of variation, the better the stability of energy. In this paper, the coefficient of variation is introduced to measure the stability of wind energy resources.
The formula of variation coefficient is:
The coefficient of variation was calculated for the annual average wind power density. As shown in Figure 8, the variation coefficient is inversely related to the distance from the coast. The variation coefficient is the smallest in the sea area of Taizhou, which means that the interannual variation of the annual average wind power density near the coast is greater than that of the other areas of Zhejiang. The interannual variation of the annual average wind power density reached the maximum in Hangzhou bay, the variation coefficient is the smallest in the offshore sea surface of Taizhou, then followed by Wenzhou. The interannual variation of the northern part of the distant sea is smaller than that of the southern part.
The reason for the great difference in the interannual variation of the sea surface wind power density near the coast of Zhejiang may be that the urbanization process is too fast, which is affected by the change of the topography and geomorphology onshore.
Under the influence of human activities and air-sea interaction, there are large differences in the tendency of interannual change of sea surface wind energy in different regions. In this section, the tendency coefficient of one-dimensional linear regression is used to estimate the interannual trend of wind power density over the past 40 years.
Taking time as the independent variable and interannual wind power density as the dependent variable, linear regression statistics were performed, as shown in Figure 9, where the dotted line indicates the downward trend and the solid line indicates the upward trend. The interannual variation of wind power density in coastal areas of Zhejiang shows an obvious East-West pattern, the wind power density in the whole coastal area of Zhejiang shows a downward trend, and the downward trend is most obvious in the coastal area of Taizhou, the tendency estimate is about −0.5 W·m−2·a−1. The downward trend in the offshore area of Hangzhou Bay is not obvious, the tendency estimate is about −0.1 W·m−2·a−1, the corresponding correlation coefficient does not pass a 95% reliability test. Therefore, the overall wind power density on the west side of the offshore area tends to decline, which is consistent with the observation results of the actual meteorological station, but the trend is not obvious. On the contrary, the significance of the correlation coefficient passes the 95% reliability test in the east side of the offshore shaded area, the wind power density shows an obvious upward trend, and there are two centers in the North and South. The northern upward trend center estimate is more than 0.7 W·m−2·a−1, the southern upward trend center is more than 1.0 W·m−2·a−1, so the trend of interannual change is larger in the South. Generally speaking, the rate of rising in the east sea area is faster than the rate of decline in the west sea area.
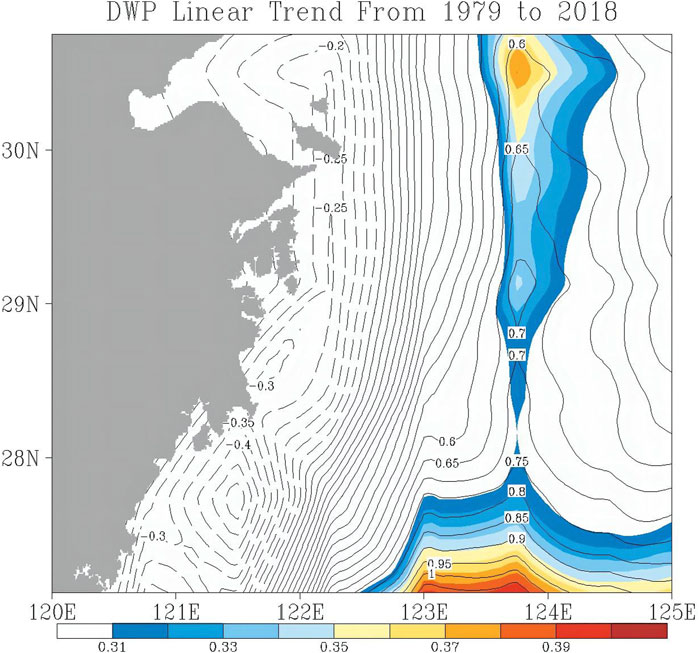
FIGURE 9. Interannual trend of wind power density (the contour line is the tendency value, the shaded part is the area put through the significance test).
The interannual variation trend of wind power density in each season is statistically analyzed. As shown in Figure 10, the spring interannual variation trend in the whole coastal area of Zhejiang shows a significant downward trend which passes the 95% reliability test. The trend is −0.75∼−2.0 W·m−2·a−1 near the coast and −4.5∼−6.0 W·m−2·a−1 in the east sea area, and the downward trend increases from west to east. The summer interannual variation trend in the whole coastal area of Zhejiang shows a significant upward trend which passes the 95% reliability test. The trend is 1.0∼2.0 W·m−2·a−1 near the coast and 3.5∼4.5 W·m−2·a−1 in the east sea area, and the upward trend increases from west to east. The autumn interannual variation trend shows an insignificant slight upward trend in the near coast, the trend is 0∼1.0 W·m−2·a−1, but there is a significant upward trend in the east sea area, the trend is 2.0∼3.0 W·m−2·a−1, and the upward trend increases from west to east. The winter interannual variation trend shows an insignificant slight upward trend in the whole sea area, the trend estimation value is 0∼1.0 W·m−2·a−1, and the upward trend increases from north to south.
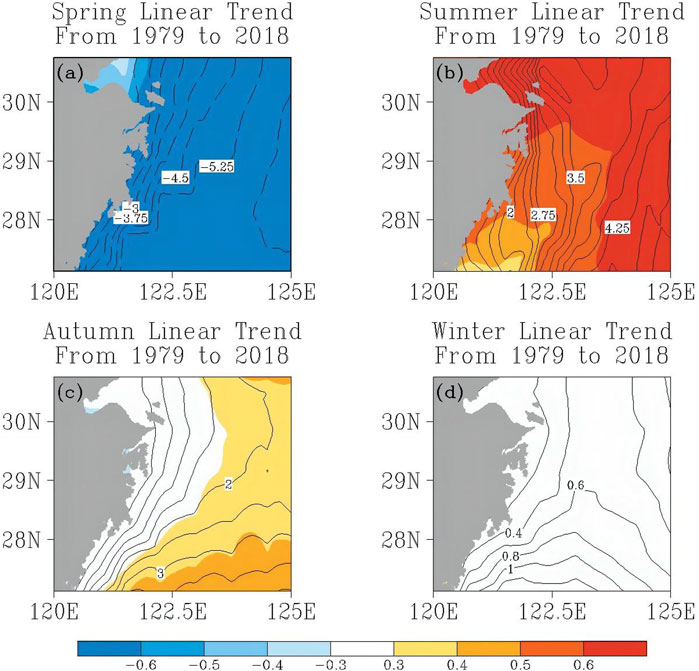
FIGURE 10. Seasonal trend of wind power density (the contour line is the tendency value, the shaded part is the area put through the significance test): (a) the spring linear trend; (b) the summer linear trend; (c) the autumn linear trend; (d) the winter linear trend.
The monthly variation range of wind energy resources has a great influence on the collection of wind energy, the life of wind turbines, and the utilization ratio of power grid connection. In the evaluation of wave energy, the monthly variability index can better reflect the change of wave energy [33], the smaller the index, the better the energy stability in each month. Here, the monthly variability index is introduced to measure the monthly variation trend of wind energy resources.
The formula of the monthly variability index is:
According to the calculation method of the monthly variability index, we calculated the index every year, and then calculated the annual variation trend of the index in the past 40 years, as shown in Figure 11. The positive trend of the index means the monthly energy differential increases. On the contrary, the negative trend of the index means the differential narrows, which is conducive to wind energy development. The shaded part in the figure passes the 95% reliability test. The sea area passing the test has two centers of positive annual variation trends, the interannual variation trend value of the index in the east sea reaches 0.012 and near Taizhou to Wenzhou reaches 0.011, which means that the monthly differential increases. The interannual variation trend of the monthly variability index near the Hangzhou bay is insignificantly weak growth or decrease. Compared with the shaded area, the interannual variation of the index changes little, which is beneficial to the development of wind energy.
The wind power density frequency of 0–600w·m−2 at the sea surface in the last 40 years in Zhejiang is analyzed, and the results are shown in Figure 12. When the wind power density is between 0–150 W·m−2, the frequency in the coastal area of Zhejiang shows a trend of gradual decline from west to east, with a large gradient. The frequency near Hangzhou bay reaches a maximum of 80%, and in the eastern sea, the area is between 40% and 50%. When the wind power density is between 150–300 W·m−2, the frequency in the coastal area of Zhejiang shows a trend of gradual increase from west to east, with a small gradient. The wind power density frequency near Hangzhou bay reaches about 10%, in the area south of Hangzhou Bay is about 16–18%, and in the eastern sea area is about 20%. When the wind power density is between 300–450 W·m−2, the frequency also shows a trend of gradual increase from west to east, with a small gradient. The wind power density frequency near the Hangzhou bay reaches about 6%, in the south of Hangzhou Bay is about 10%, and in the eastern sea area is about 12%. When the wind power density is between 450–600 W·m−2, the frequency shows a trend of gradual increase from northwest to southeast, with a small gradient also. The frequency near the Hangzhou bay reaches about 4%, in the area south of Hangzhou Bay is about 6–15%, and in the eastern sea area is about 27%.
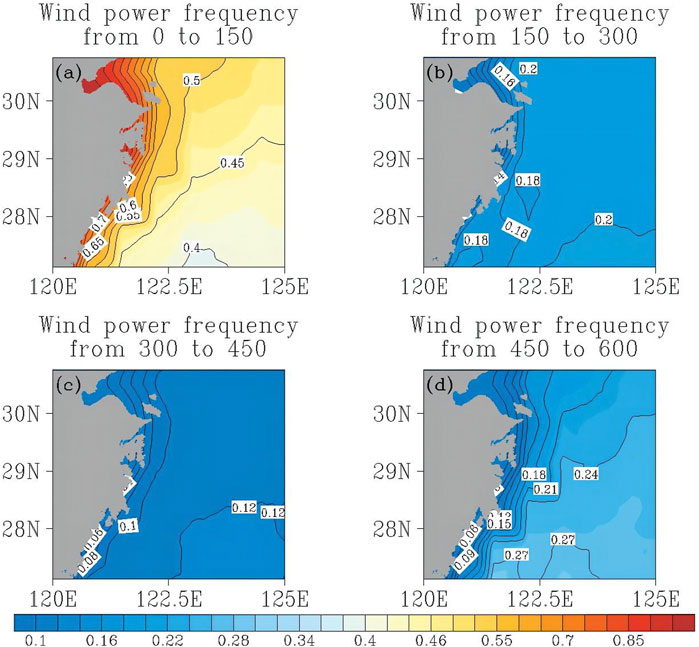
FIGURE 12. Frequency distribution of wind energy resources on the coastal sea surface: (a) the frequency of Dwp from 0 to 150; (b) the frequency of Dwp from 150 to 300; (c) the frequency of Dwp from 300 to 450; (d) the frequency of Dwp from 450 to 600.
In general, when the wind power density is between 0–150 W·m−2, the frequency mainly shows the distribution trend of high in the west and low in the east, when the wind power density is between 150–600 W·m−2, the frequency mainly shows the distribution trend of high in the east and low in the west.
The applicability of ERA-interim data in the Zhejiang sea area was analyzed by comparing the reanalysis data of wind speed at the height of 10 m in a fixed year with the wind speed measured by the wind tower. Furthermore, the climate change characteristics of sea surface wind power were analyzed based on the ERA-interim data.
1) We compared the measured wind speed data of the five offshore wind towers with the reanalysis wind speed data of the adjacent grid of the same period. The correlation coefficient reached more than 0.8 which passes the significance level test of α= 0.001. The reanalysis of the sea surface wind at the height of 10 m can well represent the actual sea surface wind speed characteristics, and sea surface wind speed increases as latitude decreases.
2) Zhejiang is rich in sea surface wind energy resources: according to the effective wind energy hours, the actual effective wind energy hours measured by the offshore wind tower exceed 80%. In the east-west direction, the percentage of effective wind energy hours increases with longitude; in the north-south direction, it increases as latitude decreases. From the perspective of the spatial distribution of the average wind power density over many years, the mean value of sea surface wind power density near Hangzhou Bay is lower than other coastal areas. The climatic mean value of sea surface wind power density increases with the distance from the coast, on the contrary, the gradient of mean surface wind power density increases as distance from coast decreases. From the perspective of the spatial distribution of multi-year seasonal average wind power density, the wind power density is the highest in winter, followed by autumn, and the lowest in spring and summer. From the spatial distribution of multi-year monthly average wind power density, the wind power density along the coast of Zhejiang generally shows a v-shaped change trend, among them, it does not change significantly near the Zhejiang coast, while it changes significantly far away from the coastal waters of Zhejiang.
3) EOF decomposition of the Zhejiang sea surface wind power density anomaly field was carried out, the variance contribution rate of the first mode reached 61.1%, the spatial field was consistency type, and the time coefficient showed an obvious upward trend; the variance contribution rate of the second mode was 16.9%, and the spatial field was of north-south dipole type, with a small range of time coefficient; the variance contribution rate of the third mode was 9.3%, and the spatial field was of west-east dipole type, and the time coefficient showed an obvious upward trend.
4) The stability of wind energy in the coastal sea surface of Zhejiang is one of the factors considered by wind power generation. Due to the rapid urbanization, the change of shore topography, geomorphology, and other factors, the stability of wind energy resources near the coast is low, and wind energy stability away from the coast gradually increases from south to north.
5) The linear trend of interannual, seasonal, and monthly variation coefficients of the sea surface wind power density was calculated: the coastal areas of Zhejiang show an obvious interannual variation trend of east-west dipole type. Spring is a significant downward trend from west to east, summer is a significant upward trend from west to east, autumn and winter are an insignificant weak upward trend. The linear trend of the monthly variability index in the Hangzhou bay estuary in northern Zhejiang is insignificant weak growth or weak decrease. Compared with the south coastal area and the eastern sea area, the interannual change of the index is not significant, which is beneficial to the development of wind energy.
6) When the wind power density is between 0–150 W·m−2, the frequency mainly shows the distribution trend of high in the west and low in the east, and the wind power density is between 150–600 W·m−2, the frequency mainly shows the distribution trend of high in the east and low in the west.
It should be pointed out that there is a certain deviation between the reanalyzed wind speed and the measured wind speed. This article makes a macro analysis of the trend of wind energy resources in the Zhejiang marine economic demonstration area. Subsequent work can be combined with higher resolution SAR satellite data to carry out a refined evaluation of wind energy resources in the region [34, 35].
Until now, the green development concept of peak carbon dioxide emissions and carbon neutrality is deeply rooted in people’s hearts, and Zhejiang have also taken relevant measures to save energy and reduce emissions. However, as one of the developing coastal provinces in eastern China, the demand for and consumption of energy, especially electric energy, is increasing day by day, which requires our province to take more energy supply measures to deal with it, and the rational use of offshore wind energy will alleviate the problem of electric energy supply to a certain extent. For example, by 1) strengthening the analysis of high-resolution meteorological data, and excavating the sea area which is rich in wind energy resources and suitable for developing wind power along the coast of Zhejiang; and 2) paying more attention to the long-term changes of offshore wind speed, accurately estimating the wind power generation capacity in different time periods and reasonably integrate it into the power grid to promote the efficient use of energy. In addition, it is necessary to further study the future trend of sea-surface wind energy resources in the context of global climate change, which is of forward-looking significance for guiding the future development of sea-surface wind energy in the Zhejiang Province.
The raw data supporting the conclusion of this article will be made available by the authors, without undue reservation.
All authors contributed to this research in collaboration. NW and CH-S wrote manuscript, KW proposed the conceptualization, KP-Z, TF, and YH-Z provided substantial help with the paper schedule and gave advice on the experiment and supervised. All authors have read and agreed to the published version of the manuscript.
This work was supported by the Key R&D Program of Zhejiang Province (2021C02036), the Natural Science Foundation of China (42005027), Fund for Meteorological Science and Technology of Zhejiang Province, China (2021ZD08, 2020YB04).
The authors declare that the research was conducted in the absence of any commercial or financial relationships that could be construed as a potential conflict of interest.
All claims expressed in this article are solely those of the authors and do not necessarily represent those of their affiliated organizations, or those of the publisher, the editors and the reviewers. Any product that may be evaluated in this article, or claim that may be made by its manufacturer, is not guaranteed or endorsed by the publisher.
1. Mitchell JFB, Johns TC, Gregory JM, Tett SFB. Climate Response to Increasing Levels of Greenhouse Gases and Sulphate Aerosols. Nature (1995) 376:501–4. doi:10.1038/376501a0
2. Zhang H, Wang K. Simulated CO2-induced Ocean Acidification for Ocean in the East China: Historical Conditions since Preindustrial Time and Future Scenarios. Sci Rep (2019) 9(9):18559. doi:10.1038/s41598-019-54861-0
3. Wang K, Zhang H, Fan G-F, Li Z-Q, Yu Z-Y, Liu P-P. Simulated Variation Characteristics of Oceanic CO2 Uptake, Surface Temperature, and Acidification in Zhejiang Province, China. Front Phys (2021) 9:718968. doi:10.3389/fphy.2021.718968
4. Zheng CW. Wave Energy and Other Renewable Energy Resources in South China Sea: Advantages and Disadvantages. J. Subtropical Res. Environ. (2011) 6(3):76. (in Chinese). doi:10.19687/j.cnki.1673-7105.2011.03.011
5. Liang B, Shao Z, Wu G, Shao M, Sun J. New Equations of Wave Energy Assessment Accounting for the Water Depth. Appl Energ (2017) 188:130–9. doi:10.1016/j.apenergy.2016.11.127
6. Li Z-q., Chen S-j., Ma H, Feng T. Design Defect of Wind Turbine Operating in Typhoon Activity Zone. Eng Fail Anal (2013) 27:165–72. doi:10.1016/j.engfailanal.2012.08.013
7. Sara P, Esparza DM, Munters W, Beeck JV, Lipzig NV. Impact of Ocean Waves on Offshore Wind Farm Power Production. Renew Energ (2021) 180:1179–93. doi:10.1016/j.renene.2021.08.111
9. Dong W, Yuan W, Liu S, Moore J, Shi P, Feng S. China-Russia Gas deal for a Cleaner China. Nat Clim Change (2014) 4:940–2. doi:10.1038/nclimate2382
10. Song LL, Zhou RW, Yang ZB, Zhu R. Meteorological Technology Application and Development in Wind Energy Resources Utilization. Eng Sci (2012) 14(9):96, 2012. (in Chinese) doi:10.3969/j.issn.1009-1742.2012.09.012
11. Bilgili M, Yasar A, Simsek E. Offshore Wind Power Development in Europe and its Comparison with Onshore Counterpart. Renew Sustain Energ Rev (2011) 15(2):905–15. doi:10.1016/j.rser.2010.11.006
13. Ajayi OO, Fagbenle RO, Katende J, Okeniyi JO. Availability of Wind Energy Resource Potential for Power Generation at Jos, Nigeria. Front Energ (2011) 5:376–85. doi:10.1007/s11708-011-0167-5
14. Li ZC, Zhu R, He XF, Zhang D. Study on the Assessment Technology of Wind Energy Resource. Acta Meteorologica Sinica (2007) 65(5):708, 2007. (in Chinese) doi:10.3321/j.issn:0577-6619.2007.05.006
15. Zheng CW, Li CY, Pan J, Liu MY, Xia LL. An Overview of Global Ocean Wind Energy Resource Evaluations. Renew Sustain Energ Rev (2016) 53:1240–51. doi:10.1016/j.rser.2015.09.063
16. Wang K, Feng G, Zhang H, Li Z, Fan G, Yu Z. Climate Change Characteristics and Adaptation in the Offshore East China Sea from 1979 to 2017. J Coastal Res (2020) 99:54. doi:10.2112/si99-008.1
17. Fang H, Perrie W, Fan GF, Xie T, Yang JS. Ocean Surface Wind Speed Retrieval from C-Band Quad-Polarized SAR Measurements at Optimal Spatial Resolution. Remote Sensing Lett (2021) 12(2):155. doi:10.1080/2150704x.2020.1846220
18. Liu S, Wei E, Jin X, Lv A, Dang H. The Performance of Dual-Frequency Polarimetric Scatterometer in Sea Surface Wind Retrieval. J Ocean Univ China (2019) 18(5):1051–60. doi:10.1007/s11802-019-4018-z
19. Fang H, Perrie W, Zhang G, Xie T, Khurshid S, Warner K. Ocean Surface Wind Speed Retrieval Using Simulated RADARSAT Constellation Mission Compact Polarimetry SAR Data. Remote Sensing (2019) 11(16):1876. doi:10.3390/rs11161876
20. Song CH, Wang N, Wang K, Fan GF, Feng T, Li ZQ. Variation and Cause of Sea Surface Wind Speed in Zhejiang Coastal Area Based on CCMP Data from 1988 to 2017. Trans Atmos Sci (2019) 42(4):562. (in Chinese). doi:10.13878/j.cnki.dqkxxb.20180816001
21. Gao QJ. Data Intercomparison Among Reanalyses and Observations in Perspective of Multi-Scale Variations of Summer Climate in east China. PhD thesis. Nanjing: Nanjing University of Information Science & Technology (2013). (in Chinese with English abstract).
22. Hughes BR, Calautit JK, Ghani SA. The Development of Commercial Wind Towers for Natural Ventilation: a Review. Appl Energ (2012) 92:606–27. doi:10.1016/j.apenergy.2011.11.066
23. Chan JCL. Tropical Cyclone Activity in the Northwest Pacific in Relation to the El Niño/Southern Oscillation Phenomenon. Mon Wea Rev (1985) 113(4):599–606. doi:10.1175/1520-0493(1985)113<0599:tcaitn>2.0.co;2
24. Vitor P, Milton K, Rosio C, Angeles GM. Comparison of Multiple Surface Ocean Wind Products with Buoy Data over Blue Amazon (Brazilian Continental Margin). Adv Meteorology (2021) 2021:1–19. doi:10.1155/2021/6680626
25. Dee DP, Uppala SM, Simmons AJ. The ERA-Interim Reanalysis: Configuration and Performance of the Data Assimilation System. Q J R Meteorol Soc (2011) 137(656):553–97. doi:10.1002/qj.828
26. Sun PJ, Wang BB, Cheng ZH, Zhang XT, Xu Y, Meng D. Analysis of the Influence of Wind Speed Interpolation on Wind Power Density Error from Wind Tower Data. Adv Meteorol Sci Technol (2019) 9(2):63.
27. Ye T, Shen Q, Wang K, Zhang Z, Zhao J. Interdecadal Change of the Northward Jump Time of the Western Pacific Subtropical High in Association with the Pacific Decadal Oscillation. J Meteorol Res (2015) 29(1):59–71. doi:10.1007/s13351-014-4040-4
28. Wang K, Ma H, Li J, Gu BH, Wu H. Assessment of the POEM2 Model for Simulating Tropical Intraseasonal Oscillation. J Trop Meteorology (2018) 24(3):323. doi:10.16555/j.1006-8775.2018.03.006
29. Wang K, Feng G-L, Zeng Y-X, Wang X-J. Analysis of Stable Components in the Extended-Range Forecast for the Coming 10-30 Days in winter 2010 and 2011. Chin Phys. B (2013) 22(12):129202. doi:10.1088/1674-1056/22/12/129202
30. Zheng CW, Pan J, Li JX. Assessing the China Sea Wind Energy and Wave Energy Resources from 1988 to 2009. Ocean Eng (2013) 65:39–48. doi:10.1016/j.oceaneng.2013.03.006
31. Shi J, Guo J, Zheng S. Evaluation of Hybrid Forecasting Approaches for Wind Speed and Power Generation Time Series. Renew Sustain Energ Rev (2012) 16(5):3471–80. doi:10.1016/j.rser.2012.02.044
32. Zheng CW, Li CY. Propagation Characteristic and Intraseasonal Oscillation of the Swell Energy of the Indian Ocean. Appl Energ (2017) 197:342–53. doi:10.1016/j.apenergy.2017.04.052
33. Cornett AM. A Global Wave Energy Resource Assessment. In: Proceedings of the Eighteenth (2008) International Offshore and Polar Engineering Conference; July 2008; Ontario, Canada. Berlin: Canadian Hydraulics Centre, National Research Council Ottawa (2008). p. 318.
34. Shao W, Sun J, Guan C, Sun Z. A Method for Sea Surface Wind Field Retrieval from SAR Image Mode Data. J Ocean Univ China (2014) 13(2):198–204. doi:10.1007/s11802-014-1999-5
Keywords: wind tower, empirical orthogonal function, wind power density, linear trend, zhejiang province
Citation: Wang N, Zhou K-P, Wang K, Feng T, Zhang Y-H and Song C-H (2021) Climate Change Characteristics of Coastal Wind Energy Resources in Zhejiang Province Based on ERA-Interim Data. Front. Phys. 9:720533. doi: 10.3389/fphy.2021.720533
Received: 04 June 2021; Accepted: 05 November 2021;
Published: 02 December 2021.
Edited by:
Gui-Quan Sun, North University of China, ChinaCopyright © 2021 Wang, Zhou, Wang, Feng, Zhang and Song. This is an open-access article distributed under the terms of the Creative Commons Attribution License (CC BY). The use, distribution or reproduction in other forums is permitted, provided the original author(s) and the copyright owner(s) are credited and that the original publication in this journal is cited, in accordance with accepted academic practice. No use, distribution or reproduction is permitted which does not comply with these terms.
*Correspondence: Kuo Wang, d2FuZ2t1by5jbGltYXRlQHFxLmNvbQ==
Disclaimer: All claims expressed in this article are solely those of the authors and do not necessarily represent those of their affiliated organizations, or those of the publisher, the editors and the reviewers. Any product that may be evaluated in this article or claim that may be made by its manufacturer is not guaranteed or endorsed by the publisher.
Research integrity at Frontiers

Learn more about the work of our research integrity team to safeguard the quality of each article we publish.