- 1College of Physical Science and Technology, Yangzhou University, Yangzhou, China
- 2Key Laboratory of Semi-Arid Climate Change, Ministry of Education, School of Atmospheric Sciences, Lanzhou University, Lanzhou, China
- 3College of Oceanography, Hohai University, Nanjing, China
- 4China Laboratory for Climate Studies, National Climate Center, China Meteorological Administration, Beijing, China
- 5Southern Ocean Science and Engineering Guangdong Laboratory, Zhuhai, China
Actual evapotranspiration (AE) is a crucial processes in terrestrial ecosystems. Global warming is expected to increase AE; however, various AE estimation methods or models give inconsistent trends. This study analyzed AE variability in China during 1982–2015 based on the Budyko framework (AE_Budyko), a complementary-relationship-based product (AE_CR), and the weighted average of six reanalyses (AE_WAR). Because the response of AE to driving factors and the performances of AE datasets are both scale-dependent, China has been categorized into six distinct climatic areas. From a regional perspective, the X-12-ARIMA method was used to decompose monthly AE into the trend, seasonal, and irregular components. We examined the main characteristics of these components and the relationships of climate factors with AE. The results indicate that the trend component of AE increased from the mid-1990s to the early 2000s and more recently in the hyper-arid and arid areas. Increasing AE was observed from 1982 to the early 1990s in the semi-arid and dry sub-humid areas. AE increased significantly and had substantial interannual variability for the entire period in the sub-humid and humid areas. Increased precipitation and water supply from terrestrial water storage contributed significantly to increasing AE in the drylands. The simultaneous occurrence of increasing precipitation and wet-day frequency caused increasing AE in the dry sub-humid area. Increased AE could be explained by the increased energy supply and precipitation in the sub-humid and humid areas. Precipitation had the strongest influence on the irregular component of AE in drylands. AE and potential evapotranspiration had a strong positive correlation in the sub-humid and humid areas. Regarding data availability, a discrepancy existed in the trend component of AE_CR because soil moisture was not explicitly considered, whereas the irregular component of AE_Budyko contained distinct variations in humid and sub-humid areas.
Introduction
Actual evapotranspiration (AE) is the process by which the Earth’s surface water enters the atmosphere through evaporation or evapotranspiration [1]. Land AE plays an essential role in hydrology and climate change, as it links the water and energy cycles [1, 2] and affects water-energy balances significantly. On average, AE accounts for about 60% of the Earth’s total land rainfall [3]. Meanwhile, AE as latent heat flux is a central component of the heat transfer. A drop in evaporative cooling generally causes higher surface air temperature [4]. Global warming is expected to increase AE rates, further accelerating warming via water vapor feedback, since water vapor is a potent greenhouse gas [5]. It should be noted that, however, AE is influenced by both local and global factors [1, 6]. The response of AE to global warming, if fully realized, can vary regionally across a continent [7].
AE is well known to be one of the most difficult variables to observe [8]. For now, only relatively few flux tower sites operate in China, and the period is concise [9]. The sparse observations are difficult to capture long-term variations in regional AE. Numerous theoretical and empirical methods have been proposed for estimating AE indirectly. For example [10], developed a data-oriented AE product by integrating a variety of data sources in a model tree ensemble approach, demonstrated that the majority of China (78%) showed an increasing trend in AE. [11], using a complementary relationship model, showed that annual AE increased significantly in western and northeastern parts of China. Recent improvements in retrospective analyses (or reanalyses) also enable AE estimates to be obtained at multiscale [12]. AE variability largely depends on local microclimatic conditions in a given region [13]. Various methods or models generally provide inconsistent AE estimates [11]. AE variability over China under global warming remains highly uncertain.
Due to the influence of the monsoon, the annual cycle is the major component of many climate variables in China [8]. Nevertheless, seasonality in time series can obscure movements of other parts that are operationally more important for climatological analysis. The annual cycle in most climate studies is assumed as a regular and recurring change with no interannual variation, whereas in reality climate change is reflected not only in the annual mean shift in climate variables, but also in their annual cycles [14]. Therefore, the seasonal, interannual, and interdecadal variations in AE and the associated drivers should be studied separately. Many deseasonalization methods and procedures have been proposed to deal with seasonal adjustment [14, 15]. The widely used X-12-ARIMA method allows for interannual variations in terms of seasonality [15] and has the advantage of diagnosing AE variability.
Various AE estimation methods or models give inconsistent trends, a single AE dataset is insufficient [12, 16]. Therefore, we examined AE variability over China derived from three sources, namely the Budyko framework, a complementary-relationship-based product [11], and a weighted average of six reanalyses. The X-12-ARIMA method was then used to comprehensively evaluate the performance of these three datasets in reproducing the trend, seasonal, and irregular variations in AE for China’s six climatic areas. The six areas are divided according to the aridity index, and coincide roughly with China’s climatic characteristics. Furthermore, the differences in the contributing factors to AE variations were determined. Our results mainly focused on the recent changes in and attributions of regional AE.
Data and Methods
Actual Evapotranspiration Data
Reanalyses (or retrospective analyses) have been produced by various institutes. In this study, AE data from six different reanalyses are used—namely, ERA-Interim reanalysis (ERA-I) from ECMWF [17], MERRA and MERRA2 from the NASA Goddard Space Flight Center [18], the Japanese 55-years Reanalysis (JRA-55), NCEP/NCAR reanalysis I (NCEP-R1), and NCEP/DOE reanalysis II (NCEP-R2) (available online https://rda.ucar.edu/). These reanalyses were generated by various forecast models, assimilation systems, or input datasets. Different reanalyses provide a measure of uncertainty in estimating the AE variability. For detailed descriptions of the selected reanalyses, refer to [12, 13]; or the original dataset citations.
In China, many studies have attempted to estimate AE [8–10, 19]. For comparison, the calibration-free nonlinear complementary relationship modelled AE dataset (AE_CR) was also used [11].
Meteorological Data and NDVI Data
To clarify the primary cause for variations in AE, we analyzed the relation between AE and the climate variables, which include surface net solar radiation derived from ERA-I, mean temperature, maximum and minimum temperatures, diurnal temperature range, cloud cover, potential evapotranspiration, precipitation, wet-day frequency, and vapor pressure derived from the University of East Anglia CRU TS4.00 version dataset (available online https://crudata.uea.ac.uk/cru/data/hrg/cru_ts_4.00/; [20]. In addition, the 8 km Global Inventory Modeling and Mapping Studies (GIMMS) normalized difference vegetation index (NDVI) dataset was derived from the Advanced Very High Resolution Radiometer (AVHRR) sensor (available online https://www.ncei.noaa.gov/data/), and was used to estimate vegetation coverage [21]. Each dataset has a different time span, but all cover our analysis period of 1982–2015. For easy comparison and for computation purposes, all datasets were interpolated into a 0.5° × 0.5° grid using bilinear interpolation.
Methods
The X-12 Seasonal Adjustment Procedure
Seasonal adjustment corresponds to an estimate of seasonal variation and its elimination from a time series [15, 22]. Seasonally adjusted data can be used to better visualize the long-term development of the data series. We adopted a widely-used seasonal adjustment method, which is known as the X-12-ARIMA-based filter, to give a richer diagnosis and clearer interpretation of climate variations in AE. To be more precise, the original series (Xt) can be decomposed into three components, as
where Tt, St, and It are defined as the trend, seasonal, and irregular components, respectively [22]. The trend component (Tt) captures the direction of the time series, thus the nonparametric Mann–Kendall test was applied to detect its linear trend. Irregular fluctuations were generally due to unpredictable and unexpected factors. For more sophisticated analyses, it was preferable to include both the seasonally adjusted data and its seasonal component to obtain maximum information from the data [15].
Weighted Average of AE From Six Reanalyses
Reanalysis AE is generally estimated from bulk flux formulas with inputs of surface temperature, wind, and surface air temperature and humidity [16]. Discrepancies in AE among reanalyses can be substantial [12, 13]. An intercomparison of different datasets is a key step in reducing uncertainties in AE estimates. After seasonal adjustment of AE, multiple linear regression, a sophisticated and quantitative analysis method, was used to analyze consistency across the six reanalyses.
For the X-12 trend, seasonal, and irregular components of AE from reanalysis X1, a multiple linear regression was performed with the remaining five reanalyses (Xi, i = 2, … , 5), respectively, that is,
where βi (i = 0, … , 5) are the parameters generally estimated by least squares. Based on this, the corresponding squared multi-correlation coefficient
where the subscript i of
AE Estimation Based on the Budyko Framework
In the Budyko framework, long-term AE (AE_Budyko) is largely controlled by the ratio of energy supply (potential evapotranspiration, PET) to water supply (precipitation, PRE). Several previous studies have developed various but somewhat similar coupled water–energy balance equations on the basis of the Budyko hypothesis [23]. Because of its strong theoretical basis and low data requirements, the Budyko equation has been widely used [24]. As pointed out by [25]; various types of Budyko-like equations have given broadly similar results. One of the most popular Budyko equation is expressed as [21]:
where n is a catchment-specific parameter that modifies the Budyko curve [24, 25]. China occupies a vast land territory, thus the parameter n shows a large spatial variation (ranging from 0.4 to 3.8) [25]. It should be noted that higher values of n denote a higher estimate of AE for a given PRE and PET in general [24]. To simplify the Budyko framework, the parameter n is traditionally set to be 1.8 [13, 23]. In the absence of better knowledge, we assume here that n remains constant over time.
Results and Discussion
Climatic Characteristics of China
Climate variations in China are complicated because of the influence of various factors. Precipitation varied widely across space (Figure 1D). Generally, wetter environments had a higher vegetation cover (Figure 1C), indicating that long-term vegetation cover was sensitive to water availability. Considering geographical complexity, the response of regional AE to a warming climate should be investigated separately [13]. Meanwhile, the quality of the AE products may differ spatially as well. We thus differentiated the climatic areas in China and performed an attribution analysis on AE for each area.
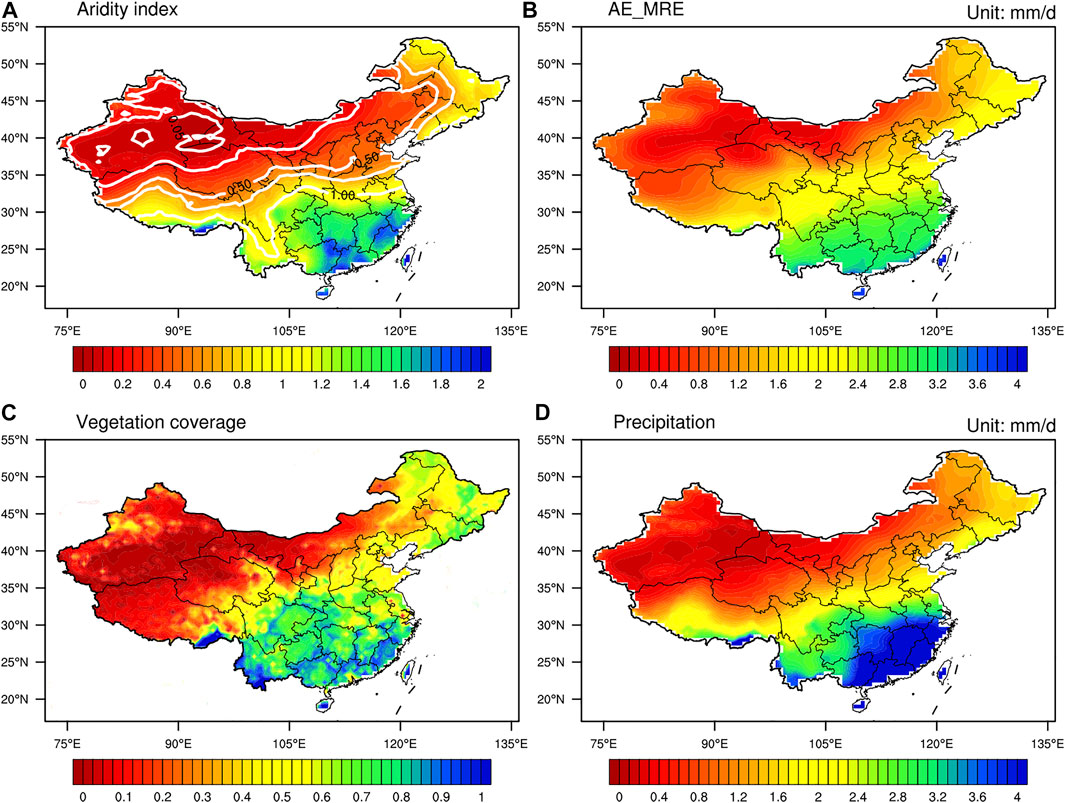
FIGURE 1. The climatological distribution of (A) aridity index, (B) annual mean actual evapotranspiration (AE_MRE; mm d−1) derived from the average of six reanalyses, (C) vegetation cover, and (D) annual mean precipitation (mm d−1) for 1982–2015.
According to the aridity index (AI) [26], the Budyko hypothesis generally separates catchments into energy-limited (AI < 1) and water-limited (AI > 1) areas [27]. As shown in Figure 1A, AI had a similar spatial distribution to precipitation (Figure 1D) and vegetation cover (Figure 1C). Consequently, the definition of AI was deemed reasonable and reliable. According to this index, China could be roughly divided into six climatic areas, namely, the hyper-arid (H-arid), arid, semi-arid (S-arid), dry sub-humid (DS-humid), sub-humid (S-humid), and humid areas [13].
Figure 1B shows the spatial distribution of climatological mean AE during 1982–2015, calculated from the average of six reanalyses. Generally, AE across China decreased from south to north and from east to west. For the mean annual water balance, the moisture supplied by precipitation was sufficient in most regions. In contrast, AE could be higher than precipitation in northwestern China, where glaciers have a direct impact on the water resource system [39]. Precipitation is used to measure water availability in the Budyko framework. It means that AE_Budyko may be biased low in some areas (discussed below).
Multi-Timescale Variability of AE
Figure 2 shows the seasonal component of AE for the six climatic areas. AE showed strong seasonality with different amplitudes over time. In comparison, seasonal variations in AE revealed by different datasets were generally consistent for most areas. The largest discrepancies were observed for the hyper-arid area (Figure 2A). Overall, AE_WAR agreed better with AE_CR (correlation 0.926) than with AE_Budyko (correlation 0.856). Modest differences also existed in the seasonal component for the arid area (Figure 2B). Seasonal variation is an essential aspect of climate change. As shown in Figure 2, seasonal components of AE in the hyper-arid and arid areas exhibited substantial interannual variations, which is a nonnegligible part of the original time series. It suggested that the conventional approach assuming fixed seasonality did not apply in these areas.
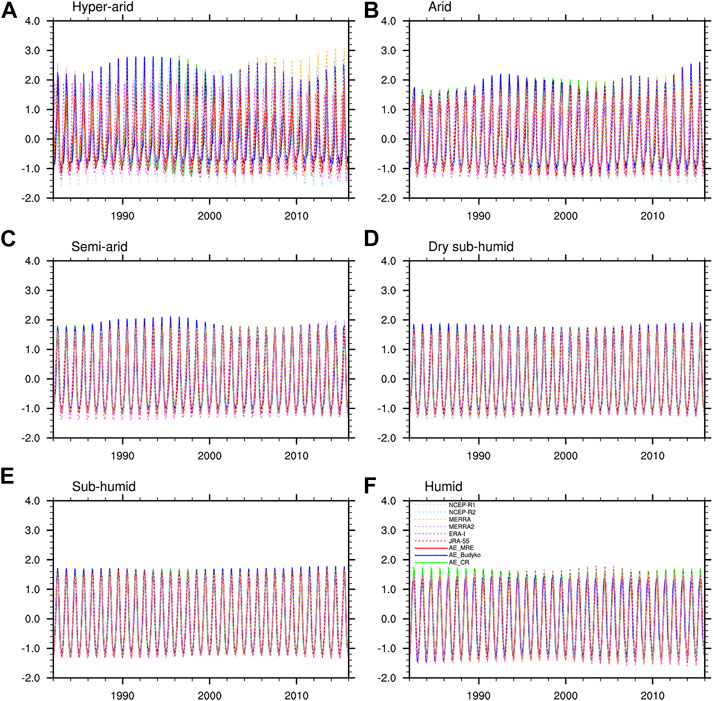
FIGURE 2. X-12-ARIMA seasonal components (St) of actual evapotranspiration (AE) derived from AE_WAR, AE_CR, AE_Budyko, and reanalyses over the (A) hyper-arid, (B) arid, (C) semi-arid, (D) dry sub-humid, (E) sub-humid, and (F) humid regions.
The trend components (Tt) of AE are shown in Figure 3. Compared to AE_CR, AE_WAR agrees better with AE_Budyko, as evidenced by the correlation coefficients shown in Figure 4 (0.589, 0.623, 0.708, 0.540, 0.387, and 0.288 for the six areas, respectively). Despite the general similarity, disparities existed among the three datasets, partly owing to their differing linear trends (Figure 5). The statistical significance of the Mann–Kendall test for the increasing trend in AE_WAR exceeded the 99% confidence level in all areas (Figure 5). This was consistent with the traditional view that AE is likely to increase under global warming [7]. AE_Budyko also showed an increasing trend in most areas, whereas a significant negative trend was found for the hyper-arid area and no significant trend existed for the arid area (Figure 5). AE_CR displayed a significantly decreasing trend in all areas, except for the arid area. The spatial patterns of the linear AE trends, and indeed the signs of the trends, differed between the datasets.
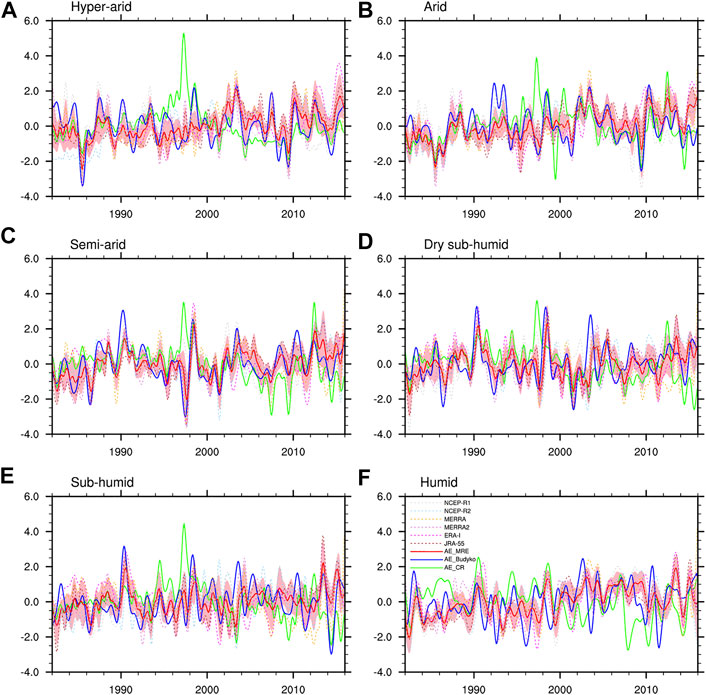
FIGURE 3. X-12-ARIMA trend components (Tt) of actual evapotranspiration (AE) derived from AE_WAR, AE_CR, AE_Budyko, and reanalyses over the (A) hyper-arid, (B) arid, (C) semi-arid, (D) dry sub-humid, (E) sub-humid, and (F) humid regions.
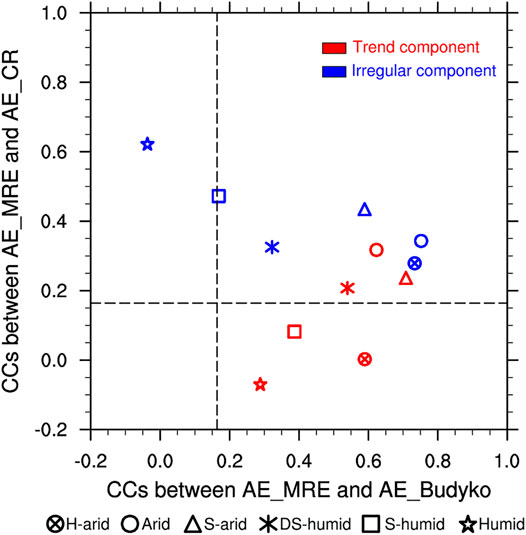
FIGURE 4. Plot of correlation coefficients between AE_WAR and AE_CR vs correlation coefficients between AE_WAR and AE_Budyko in six climatic areas of China from 1982 to 2015 for the X-12-ARIMA trend and irregular components. The local 99.9% confidence levels are about ± 0.164 based on Student’s t-test.
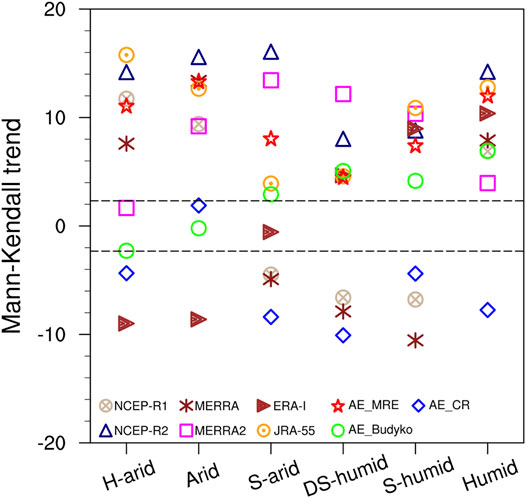
FIGURE 5. Mann–Kendall trends for X-12-ARIMA trend component (Tt) of actual evapotranspiration (AE) derived from various datasets for six climatic areas of China from 1982 to 2015. The local 99% confidence levels are about ± 2.32.
Compared to AE_WAR and AE_Budyko, AE_CR showed a significant discrepancy in the trend component (Figure 4). Specifically, AE_CR for many areas peaked in 1997 (Figure 3), increasing during 1982–1997 and declining after 1997. We suspected that the aforementioned weak correlation might have been caused by the effect of the spurious changes in AE_CR around 1997. A correlation analysis between AE_CR and AE_ WAR was performed for 1982–1995 and 1999–2015, respectively. Correlation coefficients were highly improved during 1982–1995. The correlations between AE_CR and AE_WAR were 0.500, 0.692, 0.702, 0.712, 0.519, and 0.413 (p < 0.001) for the six regions, respectively. The relationship between AE_CR and AE_Budyko showed roughly similar behavior. A comparison of various datasets revealed substantial uncertainties in the trend component of AE_CR, which was likely overestimated around 1997. It is therefore questionable whether a calibration-free AE estimation method without the use of precipitation or runoff rates could predict long-term changes in AE.
AE_WAR increased from the mid-1990s to the early 2000s and more recently in the hyper-arid area (Figure 3A); this was generally consistent with the AE_Budyko trend. Similar results were found for the arid area (Figure 3B), where AE_WAR also had an increasing trend in the late 1980s. At a regional scale, AE_WAR agreed better with AE_Budyko for the semi-arid area (Figure 3C), with both indicating a distinct increase in AE from 1982 to the early 1990s. During the same period, an increasing trend in AE_WAR was observed for the dry sub-humid area, whereas AE_Budyko showed no discernible trend (Figure 3D). Another significant shift in both AE_WAR and AE_Budyko occurred from the late 2010s onwards. Considerable differences in the trend components of AE among the three datasets were found in the sub-humid (Figure 3E) and humid (Figure 3F) areas. For these two areas, AE_WAR had a significantly increasing trend along with substantial interannual variability, which agreed with AE_Budyko. As noted above, both AE_WAR and AE_Budyko agreed well with AE_CR during 1982–1996. However, variations in AE obtained from the three datasets were not consistent and exhibited conflicting trends during 1997–2015.
At a regional level, multiple factors determined how much water evaporated from the land [1]. The irregular component of AE showed high variability (Figure 6). Considerable inconsistencies existed between the three datasets. Specifically, AE_WAR showed reasonable agreement with AE_Budyko for the drylands (i.e., hyper-arid, arid, and semi-arid areas). By contrast, only a weak negative correlation existed between AE_WAR and AE_Budyko for the humid area (Figure 5F). One possible reason for this was that changes in both rainfall and soil water storage significantly influenced the interannual variability of the hydrological responses [28]. For example, vegetation and the interactions between climate seasonality and soil water storage changes have also been found to play important roles [25]. The magnitude of any change in the interannual variability of AE caused by variations in catchment vegetation was related to pre- and post-change vegetation types. Compared to the drylands, the vegetation cover in wetter environments tended to be denser (Figure 1C). Because of the mutual interactions among climate, hydrological processes, and land surface characteristics, AE had a nonlinear relationship with precipitation and potential evapotranspiration [24, 29], which led to deviations in the Budyko relationship [28]. As a result, the performance of AE_Budyko in reproducing the irregular component of AE remains doubtful for the humid area (Figure 6F).
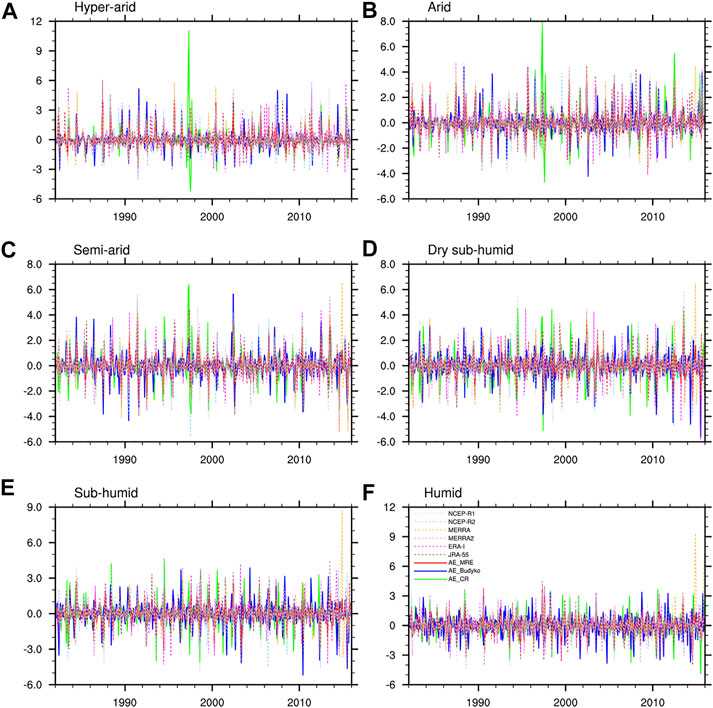
FIGURE 6. X-12-ARIMA irregular components (It) of actual evapotranspiration (AE) derived from AE_WAR, AE_CR, AE_Budyko, and reanalyses over the (A) hyper-arid, (B) arid, (C) semi-arid, (D) dry sub-humid, (E) sub-humid, and (F) humid regions.
Agreement between AE_WAR and AE_CR was observed for the humid and sub-humid areas (Figure 4). As the above mentioned, a calibration-free nonlinear complementary relationship model was utilized for monthly AE_CR taking air and dew-point temperature, wind speed, and net radiation as inputs [11, 30]. AE from surfaces with abundant moisture was mainly controlled by energy conditions [27, 31]. Atmospheric evaporative demand was primarily driven by two major components, namely radiative and aerodynamic components, both of which were associated with the AE_CR inputs. Therefore, the irregular component of AE_CR performed better than that of AE_Budyko for the humid and sub-humid areas (Figure 4).
Causes and Implications of Changes in AE
The response of AE to climate variables varies spatially (Figure 7). The causes of variations in AE are closely related to local climatic characteristics. The trend component of AE showed a strong positive correlation with precipitation, wet-day frequency, and vapor pressure (p < 0.001) (Figure 7) in the hyper-arid, arid, and semi-arid areas. This was consistent with the convention that AE is mainly controlled by water conditions in drylands. In water-limited environments, a substantial fraction of the variations in precipitation become variations in AE. Although precipitation was the dominant factor for the trend component of AE in the drylands, the increase in precipitation (Figure 8) was lower than that in AE (Figure 4) according to the Mann–Kendall test.

FIGURE 7. Temporal correlation coefficients between X‐12‐ARIMA trend components of actual evapotranspiration and influencing factors, namely potential evapotranspiration (PET), mean temperature (TMP), maximum and minimum temperatures (TMX and TMN, respectively), diurnal temperature range (DTR), net solar radiation (NSR), cloud cover (CLD), precipitation (PRE), wet-day frequency (WET), and vapor pressure (VAP), over the (A) hyper‐arid, (B) arid, (C) semi‐arid, (D) dry sub‐humid, (E) sub-humid, and (F) humid regions from 1982 to 2015. The local 99.9% confidence levels are about ± 0.164 based on Student’s t‐test.
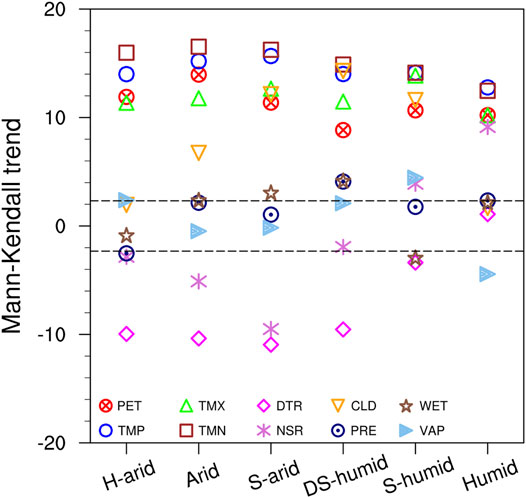
FIGURE 8. Mann–Kendall trends in X-12-ARIMA trend components of influencing factors in six climatic areas of China from 1982 to 2015. The local 99% confidence levels are about ± 2.32.
In fact, increased wet-day frequency could promote AE increase, even if there is no change in total precipitation. Besides, changes in runoff and water storage should be considered in the amount of moisture available for AE [31, 32], especially in drylands. Human activities and climate change have intensely influenced the ecohydrological pattern of many basins. For example, the Tarim River Basin is the most heavily glacierized watershed in arid northwestern China. The water supply from the mountains to the Tarim River Basin is favorable in recent decades; however, local human activities (such as irrigation and domestic water use) have reduced its runoff [33]. [34] also indicated that the influence of irrigation on AE variability became increasingly evident with the increase of irrigation in the Tarim River Basin. Accordingly, the increased water supply from catchment storage likely resulted in increased AE in the drylands.
AE_WAR and AE_Budyko were significantly correlated (p < 0.001) with diurnal temperature range, net solar radiation, and cloud cover in the drylands. The Mann–Kendall test indicated that diurnal temperature range decreased significantly in the drylands, mostly because of a more significant increase in minimum temperature relative to maximum temperature (Figure 8). This decrease in diurnal temperature range was mainly attributed to increased cloud cover, precipitation, and soil moisture [35]. Diurnal temperature range can represent the combined influence of these variables and hence has a strong relationship with AE [36].
Increased AE can modulate the climate by reducing the sensible heat flux, enhancing the air humidity, increasing the minimum temperature, and decreasing the maximum temperature [35]. It means that increased AE is a possible reason for the increase in minimum temperature has been higher than that in maximum temperature, that is, the decrease in diurnal temperature range might have resulted from the increased AE (Figure 8).
The correlations ranged more widely between the datasets in wetter areas. Vapor pressure was an essential factor influencing AE in the dry sub-humid area (Figure 7D). Increased AE led to increasing vapor pressure, thus increased vapor pressure could be interpreted as a sign of increasing AE [6]. Similar relationships were found in the sub-humid area (Figure 7E). Overall, the simultaneous increases in precipitation and wet-day frequency increased AE in the dry sub-humid area (Figure 7D). Increased minimum temperature was likely an essential cause of the increased AE in the sub-humid area (Figure 7E). For the humid area, the trend component of AE was less sensitive to precipitation than that in the drylands. AE increased under the integrated influence of potential evapotranspiration, mean temperature, and maximum and minimum temperatures (Figure 7F). Changes in AE were generally controlled by energy supply rather than precipitation.
In general, AE was driven mainly by climatic factors, regulated by land surface condition, and limited by water supply [19]. The trend component of AE_CR showed little correlation with climatic factors. An explanation is that AE_CR may fail in reproducing the long-term variation in AE. In contrast, AE_Budyko showed reasonable consistency with AE_WAR, demonstrating that AE_Budyko is more reliable in terms of long-term, large-scale changes in AE.
Figure 9 illustrates the influencing factors of the irregular component of AE at regional scales. As expected, precipitation had the strongest influence on AE in the hyper-arid, arid, and semi-arid areas. In the drylands, precipitation is temporarily stored in soil and then totally evaporates into the atmosphere [1]. In contrast, AE_WAR and AE_CR were significantly negatively correlated with precipitation in the humid area (Figure 9F), where AE was more sensitive to energy supply than water supply (Figure 1A). The irregular component of precipitation made a much smaller contribution to AE. Furthermore, precipitation usually coincides with an increase in cloud cover and a decrease in radiation, resulting in a reduction of energy supply to AE (Figure 9F). For this reason, precipitation had a negative effect on AE in the humid area. Similarly, positive correlations between AE and cloud cover dominated in drylands, but significantly negative associations existed between AE and surface net solar radiation.
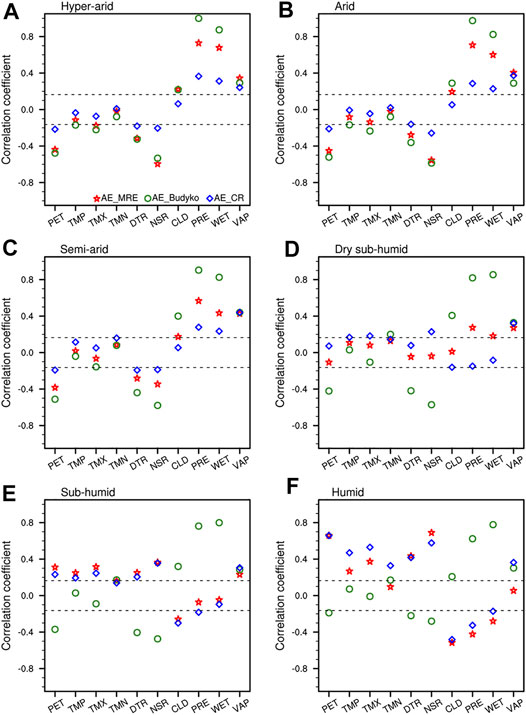
FIGURE 9. Temporal correlation coefficients between X-12-ARIMA irregular component of actual evapotranspiration and influencing factors over the (A) hyper-arid, (B) arid, (C) semi-arid, (D) dry sub-humid, (E) sub-humid, and (F) humid regions from 1982 to 2015. The local 99.9% confidence levels are about ± 0.164 based on Student’s t-test.
AE was significantly negatively correlated with potential evapotranspiration in the drylands (Figure 9). [29] suggested that a complementary relationship between AE and potential evapotranspiration occurs in non-humid areas because these two factors are correlated via precipitation. In contrast, AE and potential evapotranspiration had a strong positive correlation in wet areas (Figures 9E,F). The inclusion of the regional dimension of AE drivers allows the scenarios both of increasing AE and potential evapotranspiration in water-rich areas and of increasing AE and decreasing potential evapotranspiration to be encompassed in the drylands (Figure 9).
In the humid area, surface net solar radiation was the most crucial variable regulating the irregular component of AE_WAR (Figure 9F), which was reasonable, as radiation is the energy source for AE. Overall, the result of AE_WAR matched that of AE_CR (Figure 9F). [37] also reported that in humid climates, such as northeast India, solar radiation supplied most of the energy required for water to change from a liquid to a vapor. Furthermore, AE was strongly correlated with diurnal temperature range. [1] pointed out that the variability in diurnal temperature was consistent with that in surface incident solar radiation at monthly to decadal timescales. Since surface incident solar radiation heats daytime air only, its variation was related to changes in diurnal temperature.
AE is a complex process that regulates land-atmosphere interactions. Increased water supply from catchment storage could be a primary contributor to increased AE. Nevertheless, accurate detection and attribution of complex variability in AE at multi-time scales remain challenging [33, 38]. The implications of variations in AE remain unclear.
Conclusion
According to the aridity index, China was divided into six climatic areas. This study analyzed regional AE variability across China using data from the weighted average of six reanalyses (AE_WAR), the Budyko framework (AE_Budyko), and a complementary-relationship-based AE product (AE_CR). Since seasonal variation complicates the detection of changes in AE, the X-12-ARIMA method was used to study the trend, seasonal, and irregular components of AE as well as the significant drivers.
According to the trend component, AE increased from the mid-1990s to the early 2000s and more recently in the hyper-arid and arid areas. An increasing trend in AE was also observed from 1982 to the early 1990s in the semi-arid and dry sub-humid areas. In the sub-humid and humid areas, AE had a significantly increasing trend along with substantial interannual variability. Increased precipitation and water supply from terrestrial water storage contributed significantly to increasing AE in drylands. The simultaneous occurrences of increased precipitation and wet-day frequency caused high AE in the dry sub-humid area. In contrast, increased AE in the sub-humid and humid areas could be explained by increased energy supply and precipitation.
Precipitation had the strongest influence on the irregular component of AE in the drylands. In contrast, AE_WAR and AE_CR were significantly negatively correlated with precipitation in the humid area. Negative correlations between AE and potential evapotranspiration occurred in the drylands, whereas positive relationships existed in the sub-humid and humid areas. The irregular component of AE was positively correlated with vapor pressure across China. Positive relationships between AE and cloud cover dominated in drylands, but significantly negative associations existed between AE and surface net solar radiation.
Considering data availability, the seasonal variations in AE revealed by the different datasets were generally consistent. The largest discrepancies occurred in the hyper-arid area. Compared to AE_WAR and AE_Budyko, the trend component of AE_CR showed inconsistent behavior across many areas, which was mainly caused by spurious changes around 1997. AE_CR did not consider soil moisture explicitly, which may have limited its ability to detect AE trends. The Budyko model is useful in large-scale hydrological research; however, the irregular component of AE_Budyko remains dubious for humid and sub-humid areas because of the complex interactions between climate, vegetation, and soil.
Water loss through AE is a major consideration in the design and management of water supply reservoirs. Efforts to evaluate AE in natural settings are made difficult by spatial heterogeneity in soil and unevenly distributed vegetation in addition to other biophysical processes. This study thoroughly compared different AE products for various climatic areas of China. Such knowledge is meaningful to hydrological, climatological, and ecological research.
Data Availability Statement
The original contributions presented in the study are included in the article/Supplementary Material, further inquiries can be directed to the corresponding author. The GIMMS NDVI dataset, the Climate Research Unit datasets, and the six reanalyses used in this study can be freely accessed from the following websites: https://www.ncei.noaa.gov/data/, https://crudata.uea.ac.uk/cru/data/hrg/cru_ts_4.00/, and https://rda.ucar.edu/, respectively.
Author Contributions
TS and GF conceived, and carried out the research, led the data analysis, and wrote the manuscript. TF and BH conceived the research, designed the analysis, and provided comments on the manuscript. ZH, ZQ, and WH provided comments on the manuscript.
Funding
This research was jointly funded by National Key Research and Development Program of China (Grant Nos. 2017YFC1502402 and 2017YFC1502303), National Natural Science Foundation of China (Grant Nos. 41975062, 41875097, 42175071, and 41705053), and China Postdoctoral Science Foundation (Grant Nos. 2017M611921).
Conflict of Interest
The authors declare that the research was conducted in the absence of any commercial or financial relationships that could be construed as a potential conflict of interest.
Publisher’s Note
All claims expressed in this article are solely those of the authors and do not necessarily represent those of their affiliated organizations, or those of the publisher, the editors and the reviewers. Any product that may be evaluated in this article, or claim that may be made by its manufacturer, is not guaranteed or endorsed by the publisher.
Acknowledgments
The authors thank Ning Ma (Institute of Tibetan Plateau Research) for providing the calibration-free nonlinear complementary relationship modelled evapotranspiration dataset used in this paper.
References
1. Wang K, Dickinson RE. A Review of Global Terrestrial Evapotranspiration: Observation, Modeling, Climatology, and Climatic Variability. Rev Geophys (2012) 50:RG2005. doi:10.1029/2011RG000373
2. Miralles DG, van den Berg MJ, Gash JH, Parinussa RM, de Jeu RAM, Beck HE, et al. El Niño-La Niña Cycle and Recent Trends in continental Evaporation. Nat Clim Change (2014) 4(2):122–6. doi:10.1038/nclimate2068
3. Teuling AJ, Hirschi M, Ohmura A, Wild M, Reichstein M, Ciais P, et al. A Regional Perspective on Trends in continental Evaporation. Geophys Res Lett (2009) 36:L02404. doi:10.1029/2008GL036584
4. Yin D, Roderick ML, Leech G, Sun F, Huang Y. The Contribution of Reduction in Evaporative Cooling to Higher Surface Air Temperatures during Drought. Geophys Res Lett (2014) 41:7891–7. doi:10.1002/2014GL062039
5. Zhang Y, Leuning R, Chiew FHS, Wang E, Zhang L, Liu C, et al. Decadal Trends in Evaporation from Global Energy and Water Balances. J Hydrometeorol (2012) 13:379–91. doi:10.1175/jhm-d-11-012.1
6. van Heerwaarden CC, Vilà-Guerau de Arellano J, Gounou A, Guichard F, Couvreux F. Understanding the Daily Cycle of Evapotranspiration: A Method to Quantify the Influence of Forcings and Feedbacks. J Hydrometeorol (2010) 11:1405–22. doi:10.1175/2010JHM1272.1
7. Douville H, Ribes A, Decharme B, Alkama R, Sheffield J. Anthropogenic Influence on Multidecadal Changes in Reconstructed Global Evapotranspiration. Nat Clim Change (2013) 3:59–62. doi:10.1038/NCLIMATE1632
8. Wang Y, Liu B, Su B, Zhai J, Gemmer M. Trends of Calculated and Simulated Actual Evaporation in the Yangtze River Basin. J Clim (2011) 24:4494–507. doi:10.1175/2011JCLI3933.1
9. Ma N, Zhang Y, Xu CY, Szilagyi J. Modeling Actual Evapotranspiration with Routine Meteorological Variables in the Data‐scarce Region of the Tibetan Plateau: Comparisons and Implications. J Geophys Res Biogeosci (2015) 120:1638–57. doi:10.1002/2015JG003006
10. Li X, He Y, Zeng Z, Lian X, Wang X, Du M, et al. Spatiotemporal Pattern of Terrestrial Evapotranspiration in China during the Past Thirty Years. Agric For Meteorology (2018) 259:131–40. doi:10.1016/j.agrformet.2018.04.020
11. Ma N, Szilagyi J, Zhang Y, Liu W. Complementary-relationship-based Modeling of Terrestrial Evapotranspiration across China during 1982-2012: Validations and Spatiotemporal Analyses. J Geophys Res (2019) 124:4326–4351. doi:10.1029/2018JD02958010.1029/2018jd029850
12. Su T, Feng T, Feng G. Evaporation Variability under Climate Warming in Five Reanalyses and its Association with pan Evaporation over China. J Geophys Res Atmos (2015) 120:8080–98. doi:10.1002/2014JD023040
13. Feng T, Su T, Ji F, Zhi R, Han Z. Temporal Characteristics of Actual Evapotranspiration over China under Global Warming. J Geophys Res Atmos (2018) 123:5845–58. doi:10.1029/2017JD028227
14. Qian C, Fu C, Wu Z. Changes in the Amplitude of the Temperature Annual Cycle in China and Their Implication for Climate Change Research. J Clim (2011) 24:5292–302. doi:10.1175/jcli-d-11-00006.1
15. Pezzulli S, Stephenson DB, Hannachi A. The Variability of Seasonality. J Clim (2005) 18:71–88. doi:10.1175/jcli-3256.1
16. Trenberth KE, Fasullo JT, Mackaro J. Atmospheric Moisture Transports from Ocean to Land and Global Energy Flows in Reanalyses. J Clim (2011) 24:4907–24. doi:10.1175/2011jcli4171.1
17. Dee D, Uppala SM, Simmons AJ, Berrisford P, Poli P, Kobayashi S, et al. The ERA-Interim Reanalysis: Configuration and Performance of the Data Assimilation System. Q J R Meteorol Soc (2011) 137:553–97.
18. Gelaro R, McCarty W, Suárez MJ, Todling R, Molod A, Takacs L, et al. The Modern-Era Retrospective Analysis for Research and Applications, Version 2 (MERRA-2). J Clim (2017) 30:5419–54. doi:10.1175/jcli-d-16-0758.1
19. Gao G, Chen D, Xu C-y., Simelton E. Trend of Estimated Actual Evapotranspiration over China during 1960-2002. J Geophys Res (2007) 112:D11120. doi:10.1029/2006JD008010
20. Harris I, Jones PD, Osborn TJ, Lister DH. Updated High-Resolution Grids of Monthly Climatic Observations - the CRU TS3.10 Dataset. Int J Climatol (2014) 34:623–42. doi:10.1002/joc.3711
21. Yang H, Yang D, Lei Z, Sun F. New Analytical Derivation of the Mean Annual Water-Energy Balance Equation. Water Resour Res (2008) 44:W03410. doi:10.1029/2007WR006135
22. Yaya OS, Fashae OA. Seasonal Fractional Integrated Time Series Models for Rainfall Data in Nigeria. Theor Appl Climatol (2015) 120:99–108. doi:10.1007/s00704-014-1153-8
23. Choudhury B. Evaluation of an Empirical Equation for Annual Evaporation Using Field Observations and Results from a Biophysical Model. J Hydrol (1999) 216:99–110. doi:10.1016/s0022-1694(98)00293-5
24. Roderick ML, Farquhar GD. A Simple Framework for Relating Variations in Runoff to Variations in Climatic Conditions and Catchment Properties. Water Resour Res (2011) 47:W00G07. doi:10.1029/2010WR009826
25. Yang H, Qi J, Xu X, Yang D, Lv H. The Regional Variation in Climate Elasticity and Climate Contribution to Runoff across China. J Hydrol (2014) 517(1):607–16. doi:10.1016/j.jhydrol.2014.05.062
26. Feng S, Fu Q. Expansion of Global Drylands under a Warming Climate. Atmos Chem Phys (2013) 13:10081–94. doi:10.5194/acp-13-10081-2013
27. McVicar TR, Roderick ML, Donohue RJ, Li LT, Van Niel TG, Thomas A, et al. Global Review and Synthesis of Trends in Observed Terrestrial Near-Surface Wind Speeds: Implications for Evaporation. J Hydrol (2012) 416-417:182–205. doi:10.1016/j.jhydrol.2011.10.024
28. Zhang Q, Singh VP, Sun P, Chen X, Zhang Z, Li J. Precipitation and Streamflow Changes in China: Changing Patterns, Causes and Implications. J Hydrol (2011) 410:204–16. doi:10.1016/j.jhydrol.2011.09.017
29. Yang D, Sun F, Liu Z, Cong Z, Lei Z. Interpreting the Complementary Relationship in Non-humid Environments Based on the Budyko and Penman Hypotheses. Geophys Res Lett (2006) 33:L18402. doi:10.1029/2006GL027657
30. Szilagyi J, Crago R, Qualls R. A Calibration‐free Formulation of the Complementary Relationship of Evaporation for continental‐scale Hydrology. J Geophys Res Atmos (2017) 122:264–78. doi:10.1002/2016jd025611
31. Lawrimore JH, Peterson TC. Pan Evaporation Trends in Dry and Humid Regions of the United States. J Hydrometeor (2000) 1(6):543–6. doi:10.1175/1525-7541(2000)001<0543:petida>2.0.co;2
32. Budyko MI. Climate and Life, Translated from Russian by: Miller, D. H. San Diego, CA, USA: Academic (1974). p. 321–30.
33. Tao H, Gemmer M, Bai Y, Su B, Mao W. Trends of Streamflow in the Tarim River Basin during the Past 50 years: Human Impact or Climate Change? J Hydrol (2011) 400(1-2):1–9. doi:10.1016/j.jhydrol.2011.01.016
34. Han S, Hu H, Yang D, Liu Q. Irrigation Impact on Annual Water Balance of the Oases in Tarim Basin, Northwest China. Hydrol Process (2011) 25:167–74. doi:10.1002/hyp.7830
35. Dai A, Trenberth KE, Karl TR. Effects of Clouds, Soil Moisture, Precipitation, and Water Vapor on Diurnal Temperature Range. J Clim (1999) 12:2451–73. doi:10.1175/1520-0442(1999)012<2451:eocsmp>2.0.co;2
36. Liu B, Xu M, Henderson M, Gong W. A Spatial Analysis of pan Evaporation Trends in China, 1955-2000. J Geophys Res (2004) 109:D15102. doi:10.1029/2004JD004511
37. Jhajharia D, Shrivastava SK, Sarkar D, Sarkar S. Temporal Characteristics of pan Evaporation Trends under the Humid Conditions of Northeast India. Agric For Meteorology (2009) 149:763–70. doi:10.1016/j.agrformet.2008.10.024
38. Xie P, Wu Z, Sang Y-F, Gu H, Zhao Y, Singh VP. Evaluation of the Significance of Abrupt Changes in Precipitation and Runoff Process in China. J Hydrol (2018) 560:451–60. doi:10.1016/j.jhydrol.2018.02.036
Keywords: actual evapotranspiration, X-12-ARIMA method, Budyko framework, reanalyses, potential evapotranspiration, China, Water supply
Citation: Su T, Feng T, Huang B, Han Z, Qian Z, Feng G and Hou W (2021) Trend, Seasonal, and Irregular Variations in Regional Actual Evapotranspiration Over China: A Multi-Dataset Analysis. Front. Phys. 9:718771. doi: 10.3389/fphy.2021.718771
Received: 01 June 2021; Accepted: 12 August 2021;
Published: 30 August 2021.
Edited by:
Yipeng Guo, Nanjing University, ChinaReviewed by:
Marija Mitrovic Dankulov, University of Belgrade, SerbiaRuolin Li, Northwest Institute of Eco-Environment and Resources, CAS, China
Copyright © 2021 Su, Feng, Huang, Han, Qian, Feng and Hou. This is an open-access article distributed under the terms of the Creative Commons Attribution License (CC BY). The use, distribution or reproduction in other forums is permitted, provided the original author(s) and the copyright owner(s) are credited and that the original publication in this journal is cited, in accordance with accepted academic practice. No use, distribution or reproduction is permitted which does not comply with these terms.
*Correspondence: Guolin Feng, ZmVuZ2dsQGNtYS5nb3YuY24=
 Tao Su
 Taichen Feng2
 Guolin Feng