- 1College of Transportation, Inner Mongolia University, Hohhot, China
- 2College of Electronic Information Engineering, Inner Mongolia University, Hohhot, China
- 3Nanjing Chipslight Technology Co., Ltd., Nanjing, China
The tuning of microwave filter is important and complex. Extracting coupling matrix from given S-parameters is a core task for filter tuning. In this article, one-dimensional convolutional autoencoders (1D-CAEs) are proposed to extract coupling matrix from S-parameters of narrow-band cavity filter and apply this method to the computer-aided tuning process. The training of 1D-CAE model consists of two steps. First, in the encoding part, one-dimensional convolutional neural network (1D-CNN) with several convolution layers and pooling layers is used to extract the coupling matrix from the S-parameters during the microwave filters’ tuning procedure. Second, in the decoding part, several full connection layers are employed to reconstruct the S-parameters to ensure the accuracy of extraction. The S-parameters obtained by measurement or simulation exist with phase shift, so the influence of phase shift must be removed. The efficiency of the presented method in this article is validated by a sixth-order cross-coupled filter simulation model tuning example.
1 Introduction
Microwave filter is an important frequency selection device in wireless communication system. However, in filter design and production, the performance of microwave filter meeting the requirements is difficult to because of the manufacturing error and the material difference. Therefore, computer-aided tuning is important for filter [1, 2].
The tuning system for microwave filters was developed by COM DEV company, and the computer-aided tuning technology was applied to the filter tuning in 2003 [3]. An algorithm based on fuzzy logic is applied to tune microwave filter [4], but this method is only an analysis of the tuning rules of the filter, so the tuning accuracy is not very high. The method of coupling matrix extraction based on vector fitting is also presented [5, 6]. Then, Cauchy method is proposed to extract the poles and residues of the Y parameters, which speed up the extraction of the coupling matrix [7, 8]. These methods require repeated iterations many times in different conditions and the port phase of the filter is ignored, which is labor-intensive and time-consuming. With the development of microwave technology, many new extraction techniques were presented. The phase shift is eliminated by three parameter optimization methods, and then the coupling matrix is synthesized by Cauchy method [9]. A new single parameter optimization method is proposed [10], which extracts the coupling matrix from measurement or simulated S-parameters of filter. However, the calculation process of these optimization methods is complex.
Some machine learning algorithms such as support vector machine, adaptive network, and artificial neural network (ANN) [11–13] are explored to extract the coupling matrix. However, there methods have some disadvantages. For example, ANN initially is a traditional weight-sensitive method based on back-propagation, which could easily be over-trained. The deep neural network is applied to the parameter extraction of microwave filter [14, 15]. However, there are too many layers for the deep neural network, which lead to problem and make training complicated.
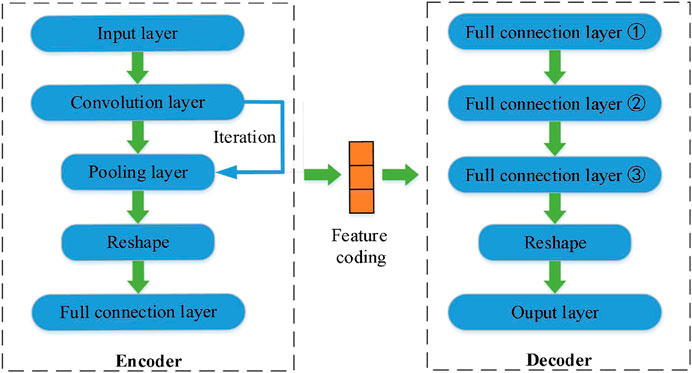
In this article, a coupling matrix extraction method based on 1D-CAE model [16, 17] is presented. 1D-CAE is a hybrid model of one-dimensional neural network (1D-CNN) and autoencoders (AEs). In the process of 1D-CAE model training, the encoder first extracts the features of S-parameters using convolution layers and pooling layers, which are then mapped to the coupling matrix by the flattened and full connection layers. In addition, the decoder reconstructs the S-parameters through full connection layers and reshapes operations. The loss function was used to evaluate the performance of the 1D-CAE model. The proposed 1D-CAE model is able to extract the coupling matrix of the target S-parameters with high accuracy and speed compared with the conventional Cauchy method or vector fitting method with complicated derivations. The method proposed in this article is successfully applied to a sixth-order cross-coupled filter, which validates the effectiveness of the proposed method.
The rest of the article is organized as follows. Section 2 introduces the theories of 1D-CAE model. In section 3, the elimination of phase shift is described. The sixth-order cross-coupled filter is used to verify the effectiveness of the proposed method in section 4. The conclusions are drawn in section 5.
2 One-Dimensional Convolutional Autoencoders
2.1 Autoencoders Framework
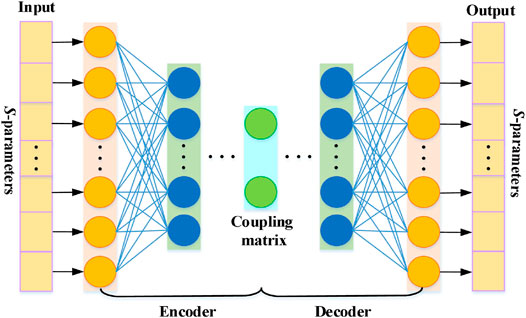
The autoencoders (AEs) are typical representation of learning network that is widely used in the field of image process and information encoding [18, 19]. The AE mainly includes two parts: encoder and decoder. The encoder compresses the input data and maps it into a feature vector of a small dimension. On the other hand, the decoder learns to reconstruct the complete information of input data according to the feature vector. The process of encoding and decoding makes the obtained feature vector to contain the main information of the input data. The framework of a typical AE is shown in Figure 1.
In the process of encoding, the real and imaginary parts of S11 and S21 are its input and coupling matrix is its output. The encoding process can be expressed as
where X is the input data, A is the output of encoder, w1 is the weight matrix connecting the input layer and hidden layer, b1 is the bias matrix, and f is the activation function. In decoding part, the coupling matrix is its input and the real and imaginary parts of S11 and S21 are its output. In order to obtain output layer, the decoding function is
where
2.2 One-Dimensional Convolutional Neural Network
Convolutional neural network (CNN) is one of the most representative algorithms in the field of artificial intelligence, which is inspired by the visual nervous system of animals. Due to its shared weight parameters and sparse connection characteristics, CNN is used in image recognition and classification [20, 21], natural language processing, and other fields [22, 23]. A typical CNN is composed of multiple convolution layers, pooling layers, and full connection layers. The convolution layer is used to extract features in the calculation process by weight sharing. The pooling layer usually follows the convolution layer and is adopted to reduce the dimension of network parameters. After extracting the features through multiple convolution layers and pooling layers, they are flattened into a feature vector by the full connection layer. Several different architectures for CNN have been proposed in [24–28].
The process of extracting coupling matrix from S-parameters can be regarded as a recognition problem. Considering that the S-parameters are one-dimensional, one-dimensional convolutional neural network (1D-CNN) was applied to extract coupling matrix. The basic architecture of 1D-CNN is similar to that of conventional CNN, so the feature of input data can still be effectively learned by performing convolution and pooling layers similar to conventional CNN. The difference is that the 1D-CNN requires the application of one-dimensional convolution kernel on the convolution layers. The following is specific description of convolution layer, pooling layer, and full connection layer.
The convolution layer consists of convolution kernel and nonlinear activation function, which extracts the features by convolution operation between different convolution kernel and feature mapping. The output of convolution layer i is
where ◎ stands for convolution operation; wi is convolution kernel weight; x is feature mapping of convolution layer i-1; bi is bias of convolution layer i; and fact (∙) is the activation function.
Adding the pooling layer behind the convolution layer is to reduce data dimension for high computing efficiency. The computing process for pooling layer can be expressed as
where n is the dimension of the pooling region and yn is the n-th vector in pooling region.
The data features extracted from convolution layer and pooling layer are integrated by the full connection layer and combined with tanh activation function to achieve prediction of targets. The output vector Vi of the fully connected layer i is given by
where vi-1 is feature mapping of layer i-1, wi is weight of network, bi is bias of network, and fact (∙) is the activation function.
2.3 One-Dimensional Convolutional Autoencoders Learning Model
1D-CAE is a network structure that can reconstruct the original input data, which is based on the combination of AE and 1D-CNN. Similar to the traditional AE structure, 1D-CAE model contains two parts: encoder and decoder. Figure 2 shows the 1D-CAE model structure. The encoder structure of 1D-CAE model includes convolution layer, pooling layer, and full connection layer. The role of the encoder is to learn the main features from the S-parameters and map them to the coupling matrix. The decoder aims to reconstruct the S-parameters using the coupling matrix extracted from the encoder. The decoder for the 1D-CAE model contains only the full connection layer and reshapes operation.
2.4 Loss Function
The entire network is trained using a combination of two loss functions: reconstruction loss (Lr) and prediction loss (Lp). The reconstruction loss is the difference between the original input data (S-parameters) and decoder output (S-parameters). Therefore, the reconstruction loss is smaller, indicating that learned feature coding is more discriminative and of better quality. The reconstruction loss is defined as follows
where X and
where Y and
where λ is a regularization parameter. The loss function of the 1D-CAE is optimized using the Adam optimizer [29] with the learning rate 10–4 and batch size (i.e., N) of 64.
3 Elimination of Phase Shift
Generally, the S-parameters of the filter obtained through the electromagnetic simulation model or measurement contain non-ideal factors, which lead to the phase difference between the simulated or measured response value and the ideal value. If the phase shift cannot be effectively eliminated, the accuracy of the coupling matrix decreases. The phase shift φ is expressed as follows
where φ0 is the phase shift, β is the propagation constant, and l is the length of the transmission line. The phase shift φ connected to 2 I/O ports is defined by
where φ01 and φ02 are the phase shift and ∆l01 and ∆l02 are equivalent length of de-embedded transmission line at 2 I/O ports, respectively.
According to the theory in [30], the phase of the reflection coefficient S11 is obtained as the following formulas
where ek=ek,r + jek,i (k = 0,1,2....,N) is the complex coefficient of the polynomial E(s); ω is the normalized frequency, when ω → ±∞
where a is proportional coefficient. Therefore, the phase of the simulated or measured S-parameters can be expressed as
By polynomial fitting according to Eq. 13, the φ01 and ∆l01 can be obtained. Similarly, φ02 and ∆l02 can also be obtained. Finally, the relationship of the scattering S-parameter before and after the phase shift is removed as follows
where
4 Experiment and Results
The example is a sixth-order cavity filter with two transmission zeros. The center frequency of the filter is 2.0693 GHz and the bandwidth is 110 MHz. The model structure is shown in Figure 3.
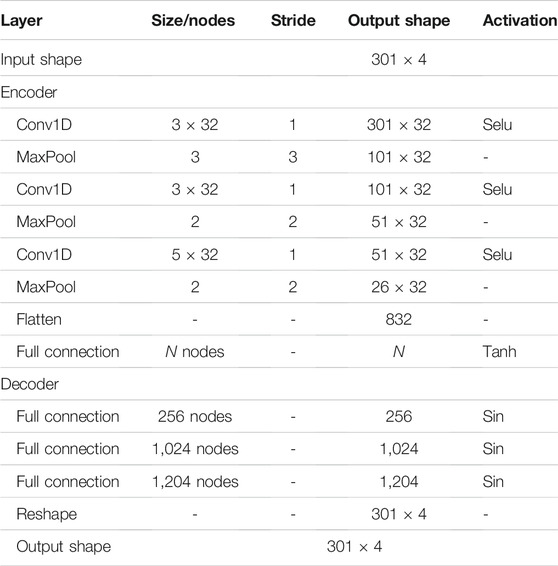
In this example, the 1D-CAE is training through 1800 training datasets and 200 testing datasets, and the data are collected for about 40 min. The detailed architecture of 1D-CAE model for extracting coupling matrix in this article is depicted in Table 1. In the encoder, there are three convolution layers and a full connection layer. The input data are 301 × 4 consisting of real and imaginary parts of the S-parameters with 301 frequency points. The first convolution layer adopts convolution kernel of size 3, the number is 32, and the stride is 1. Following the maximum pooling layer with width and stride of 3, the feature maps of 101 × 32 are obtained. In the second convolution layer, the size of the convolution kernel is 3, the number of is 32, the stride is 1, and the maximum pooling layer is followed by the width and stride which are both 2. And then, the feature maps became 51 × 32. In the third convolution layer, the size of convolution kernel is 5, the number of is 32, the stride is 1, and width and stride of the pooling layer below are both 2. Therefore, the feature maps of upper layer are changed to 26 × 32. The extracted feature maps are flattened into 832 nodes, followed by a full connection layer with a number of N nodes for prediction. N is the number of non-zero elements of the coupling matrix. The activation function of the convolution layer is Scaled Exponential Linear Units (Selu), and the activation function of the full connection layer is Hyperbolic Tangent (Tanh). The decoder network architecture is a simple three-layer full connection with 256, 1,024, and 1,204 nodes. The activation function of the three-layer full connection is Sin. Finally, the reshape operation changes the shape of feature maps to 301 × 4.
1D-CAE model training and testing results are shown in Figure 4A. The S-parameters obtained from the electromagnetic simulation software are removed from the phase shift and input into the 1D-CAE model. The corresponding coupling matrix will be quickly extracted. Moreover, in the process of extracting the coupling matrix, the goal response is compared with the S-parameters calculated by the coupling matrix. The comparison result is shown in Figure 4B, which shows perfect agreement with the goal response.
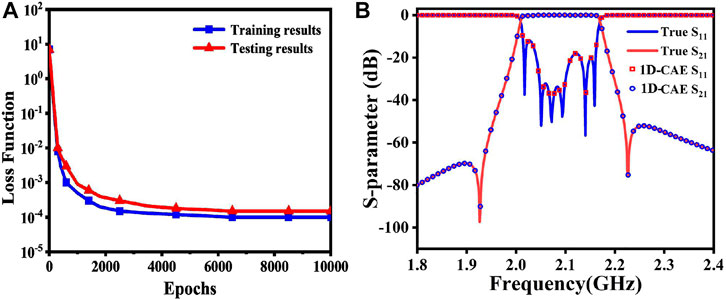
FIGURE 4. (A) Loss function of 1D-CAE training and testing results. (B) The target S-parameters and S-parameters calculated by coupling matrix.
In order to compare the method proposed in this article with other deep learning network models, the same number of training and data size are used to train the 1D-CNN model and ANN model. The result is shown in Table 2. It can be seen that with the same number of training and data size, the 1D-CAE network model extraction of coupling matrix is with higher accuracy and shorter training time. Because the single ANN model has too many parameters with the increase of the number of layers, the network burden is increased. The single 1D-CNN model cannot strengthen the network training process by reconstructing the input S-parameters.
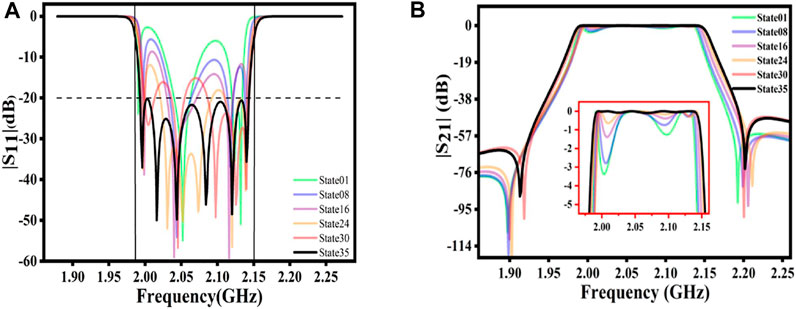
The whole tuning process takes 35 steps. In each step, tunable elements are incrementally adjusted by comparing the extracted coupling matrix with the target coupling matrix, and further adjustments are made based on the next extraction result. The coupling values extracted for some intermediate states and target coupling matrix are listed in Table 3. The filter responses for the different tuning states in Table 3 are plotted in Figure 5. It can be seen that the reflection characteristics in the passband gradually meet the requirement, and the passband also meets the target frequency range.
5 Conclusion
In this article, a method based on 1D-CAE model is proposed, which can accurately and reliably extract coupling matrix from S-parameters. The 1D-CAE model establishes the mapping relationship between the S-parameters and the coupling matrix through the encoder. In order to extract the coupling matrix more accurately, the decoder reconstructs the coupling matrix into S-parameters. By continuously minimizing the value of the loss function, the optimal 1D-CAE learning model can be obtained. Before extracting the coupling matrix, the phase shift of the S-parameters must be removed. A cross-coupled filter extraction example given in this article has demonstrated the effectiveness of the proposed method.
Data Availability Statement
The original contributions presented in the study are included in the article/Supplementary Material; further inquiries can be directed to the corresponding authors.
Author Contributions
All authors listed have made a substantial, direct, and intellectual contribution to the work and approved it for publication.
Funding
This work was supported by the National Natural Science Foundation of China (NSFC) under Project No. 61761032, Nature Science Foundation of Inner Mongolia under Contract No. 2019MS06006.
Conflict of Interest
Authors JL and ZC were employed by Nanjing Chipslight Technology Co., Ltd.
The remaining authors declare that the research was conducted in the absence of any commercial or financial relationships that could be construed as a potential conflict of interest.
Publisher’s Note
All claims expressed in this article are solely those of the authors and do not necessarily represent those of their affiliated organizations, or those of the publisher, the editors and the reviewers. Any product that may be evaluated in this article, or claim that may be made by its manufacturer, is not guaranteed or endorsed by the publisher.
References
1. Hunter IC, Billonet L, Jarry B, Guillon P. Microwave Filters-Applications and Technology. IEEE Trans Microwave Theor Techn. (2002) 50(3):794–805. doi:10.1109/22.989963
2. Hu H, Wu K-L. A Generalized Coupling Matrix Extraction Technique for Bandpass Filters with Uneven-Qs. IEEE Trans Microwave Theor Techn. (2014) 62(2):244–51. doi:10.1109/tmtt.2013.2296744
4. Miraftab V, Mansour RR. Computer-aided Tuning of Microwave Filters Using Fuzzy Logic. IEEE MTT-S International Microwave Symposium Digest. Seattle, WA, USA. Cat. No.02CH37278 (2002). p. 1117–20. doi:10.1109/tmtt.2002.805291
5. Liao C-K, Chang C-Y, Lin J. A Vector-Fitting Formulation for Parameter Extraction of Lossy Microwave Filters. IEEE Microw Wireless Compon Lett (2007) 17(4):277–9. doi:10.1109/lmwc.2007.892970
6. Deschrijver D, Mrozowski M, Dhaene T, De Zutter D. Macromodeling of Multiport Systems Using a Fast Implementation of the Vector Fitting Method. IEEE Microw Wireless Compon Lett (2008) 18(6):383–5. doi:10.1109/lmwc.2008.922585
7. Macchiarella G, Traina D. A Formulation of the Cauchy Method Suitable for the Synthesis of Lossless Circuit Models of Microwave Filters from Lossy Measurements. IEEE Microw Wireless Compon Lett (2006) 16(5):243–5. doi:10.1109/lmwc.2006.873583
8. Wang R, Li L-Z, Peng L. Improved Diagnosis of Lossy Resonator Bandpass Filters Using Y -parameters. Int J RF Microwave Comp Aid Eng (2015) 25:807–14. doi:10.1002/mmce.20919
9. Wang R, Xu J. Computer-aided Diagnosis of Lossy Microwave Coupled Resonators Filters. Int J RF Microwave Comp Aid Eng (2011) 21:519–25. doi:10.1002/mmce.20537
10. Cao W-H, Liu C, Yuan Y, Zhuang X-L, “Single-Parameter Optimization Method for Extracting Coupling Matrix from Lossy Filters”. Proceedings of the 37th Chinese Control Conference. July 25-27, 2018, Wuhan, China (2018). doi:10.23919/ChiCC.2018.8483078
11. Zhang C, Jin J, Na W, Zhang Q-J, Yu M. Multivalued Neural Network Inverse Modeling and Applications to Microwave Filters. IEEE Trans Microwave Theor Techn. (2018) 66(8):3781–97. doi:10.1109/tmtt.2018.2841889
12. Kabir H, Ying Wang Y, Ming Yu M, Qi-Jun Zhang Q-J. High-Dimensional Neural-Network Technique and Applications to Microwave Filter Modeling. IEEE Trans Microwave Theor Techn. (2010) 58(1):145–56. doi:10.1109/tmtt.2009.2036412
13. Zhang QJ, Gupta KC, Devabhaktuni VK. Artificial Neural Networks for RF and Microwave Design from Theory to Practice. IEEE Trans Microwave Theor Tech. (2003) 51(No. 4):1339–50. doi:10.1109/tmtt.2003.809179
14. Jin J, Zhang C, Feng F, Na W, Ma J, Zhang Q-J. Deep Neural Network Technique for High-Dimensional Microwave Modeling and Applications to Parameter Extraction of Microwave Filters. IEEE Trans Microwave Theor Techn. (2019) 67(10):4140–55. doi:10.1109/tmtt.2019.2932738
15. Wu S‐B, Cao W‐H. Tuning Model for Microwave Filter by Using Improved Back‐propagation Neural Network Based on Gauss Kernel Clustering. Int J RF Microw Comput Aided Eng (2019) 29:e21787. doi:10.1002/mmce.21787
16. Masci J, Meier U, Cireşan D, Schmidhuber J, Schmidhuber J. Stacked Convolutional Auto-Encoders for Hierarchical Feature Extraction. Proc Int Conf Artif Neural Netw (2011) 6791, 52–9. doi:10.1007/978-3-642-21735-7_7
17. Chen L, Rottensteiner F, Heipke C. Feature Descriptor by Convolution and Pooling Autoencoders. Int Arch Photogramm Remote Sens Spat Inf. Sci. (2015) XL-3/W2(3):31–8. doi:10.5194/isprsarchives-xl-3-w2-31-2015
18. Rumelhart DE, Hinton GE, Williams RJ. Learning Representations by Back-Propagating Errors. Nature (1986) 323:533–6. doi:10.1038/323533a0
19. Baldi P, Hornik K. Neural Networks and Principal Component Analysis: Learning from Examples without Local Minima. Neural Networks (1989) 2:53–8. doi:10.1016/0893-6080(89)90014-2
20. Krizhevsky A, Sutskever I, Hinton GE. Imagenet Classifification with Deep Convolutional Neural Networks. Commun ACM (2017) 60:84–90. doi:10.1145/3065386
21. Simonyan K, Zisserman A, Very Deep Convolutional Networks for Large-Scale Image Recognition, arXiv preprint arXiv: 1409.1556, 2014.
22. Long J, Shelhamer E, Darrel T, Fully Convolutional Networks for Semantic Segmentation, in Proceedings of the IEEE Conference on Computer Vision and Pattern Recognition,Boston, MA, USA, 2015, pp. 3431–40. doi:10.1109/cvpr.2015.7298965
23. Kalchbrenner N, Grefenstette E, Blunsom P, A Convolutional Neural Network for Modelling Sentences, arXiv preprint arXiv: 1404.2188, 2014.
24. He K, Zhang X, Ren S, Sun J. Deep Residual Learning for Image Recognition (2016). (CVPR), 770–778.
25. He K, Zhang X, Ren S, Sun J. Spatial Pyramid Pooling in Deep Convolutional Networks for Visual Recognition. IEEE Trans Pattern Anal Mach Intell (2015) 37(9):1904–16.
26. LeCun Y, Bottou L, Bengio Y, Haffner P. Gradient-based Learning Applied to Document Recognition. Proc IEEE (1998) 86(11):2278–324. doi:10.1109/5.726791
27. Simonyan K, Zisserman A. Very Deep Convolutional Networks for Large-Scale Image Recognition (2015). Available: https://arxiv.org/abs/1409.1556.
28. Zagoruyko S, Komodakis N. Wide Residual Networks (2016). Available: https://arxiv.org/abs/1605.07146.
29. Xun G, Jia X, Zhang A. Detecting Epileptic Seizures with Electroencephalogram via a Context-Learning Model. BMC Med Inform Decis Mak (2016) 16 Suppl 2(2):70. doi:10.1186/s12911-016-0310-7
Keywords: microwave filter, coupling matrix, one-dimensional convolutional autoencoders, phase shift, computer-aided tuning
Citation: Zhang Y, Wang Y, Yi Y, Wang J, Liu J and Chen Z (2021) Coupling Matrix Extraction of Microwave Filters by Using One-Dimensional Convolutional Autoencoders. Front. Phys. 9:716881. doi: 10.3389/fphy.2021.716881
Received: 01 June 2021; Accepted: 27 August 2021;
Published: 11 November 2021.
Edited by:
Jiquan Yang, Nanjing Normal University, ChinaCopyright © 2021 Zhang, Wang, Yi, Wang, Liu and Chen. This is an open-access article distributed under the terms of the Creative Commons Attribution License (CC BY). The use, distribution or reproduction in other forums is permitted, provided the original author(s) and the copyright owner(s) are credited and that the original publication in this journal is cited, in accordance with accepted academic practice. No use, distribution or reproduction is permitted which does not comply with these terms.
*Correspondence: Junlin Wang, d2FuZ2p1bmxpbkBpbXUuZWR1LmNu; Jie Liu, d3l4NjQ3MkAxNjMuY29t
 Yongliang Zhang1,2
 Yanxing Wang