- School of Computer Science and Technology, Harbin Institute of Technology, Harbin, China
Sending camouflaged audio information for fraud in social networks has become a new means of social networks attack. The hidden acoustic events in the audio scene play an important role in the detection of camouflaged audio information. Therefore, the application of machine learning methods to represent hidden information in audio streams has become a hot issue in the field of network security detection. This study proposes a heuristic mask for empirical mode decomposition (HM-EMD) method for extracting hidden features from audio streams. The method consists of two parts: First, it constructs heuristic mask signals related to the signal’s structure to solve the modal mixing problem in intrinsic mode function (IMF) and obtains a pure IMF related to the signal’s structure. Second, a series of hidden features in environment-oriented audio streams is constructed on the basis of the IMF. A machine learning method and hidden information features are subsequently used for audio stream scene classification. Experimental results show that the hidden information features of audio streams based on HM-EMD are better than the classical mel cepstrum coefficients (MFCC) under different classifiers. Moreover, the classification accuracy achieved with HM-EMD increases by 17.4 percentage points under the three-layer perceptron and by 1.3% under the depth model of TridentResNet. The hidden information features extracted by HM-EMD from audio streams revealed that the proposed method could effectively detect camouflaged audio information in social networks, which provides a new research idea for improving the security of social networks.
Introduction
Getting hot topics through social networks [1] and sharing news based on communities [2] have become the life style of modern people. Especially with the rise of we media technology in recent years, audio information has gradually become one of the main forms of information exchange in social networks. But it also brings a lot of security risks [3]. Using speech synthesis, interception audio stream for reediting and other methods to generate camouflage audio for fraud has become a new means of social networks attack. As a result of the rapid development of modern speech processing technology, people can easily edit “false” audio that cannot be easily distinguished by hearing, which makes it more difficult for people to distinguish the true and false audio in social networks. Therefore, the application of machine learning methods to mine hidden information in acoustic signals to identify authenticity and monitor risks [4, 5] has become a research hotspot in the field of acoustic signal processing. The special complex noise and sudden acoustic events in ambient background sounds are some of the important factors to judge audio authenticity. Furthermore, the frequency aliasing caused by complex noise and abrupt frequency changes caused by sudden acoustic events increases the difficulty of classifying environmental audio streams. Therefore, this paper proposes an audio environment hidden information feature extraction method based on HM-EMD and aims to use the key factors contained in the special environment information to detect the authenticity of audio and solve the problem of audio fraud in social networks.
In the current deep learning framework, audio environment hidden information feature extraction methods are mainly divided into two categories: traditional feature representation [6–8] and automatic learning audio feature representation based on deep network [9, 10]. MFCC [11], spectrograms, acoustic event histograms [12], and gradient histograms based on time–frequency learning [13] are the most commonly used traditional methods for acoustic feature representation. Acoustic event classification and detection is generally based on the spectral features of the MFCC [14]. The first team proposed a deep network for the TridentResNet series and used the snapshot method to filter the network classification results [15]. In addition to the aforementioned classical feature representation methods, deep neural networks (DNNs) can automatically learn audio features. The typical network models include the time-delay neural network [16], VGGISH-based embedding model [17], and the mixed feature extraction model based on DNN and convolutional neural network proposed by [18]. However, this end-to-end feature was not used by the first 30 teams in the DCASE tournament. This is because the end-to-end feature learning approach using deep networks directly requires a large number of evenly distributed data sets; however, in the real scene, the environmental sound source is complex, and the occurrence time and frequency of hidden acoustic events in environmental audio streams are not fixed and are often random and unpredictable. These scenarios enhance the mutagenicity and nonstationary properties of environmental acoustic signals and indirectly lead to the uneven distribution of various hidden acoustic events in datasets [19]. The result of the MFCC processing of acoustic signals is the mel-frequency. The mel-filter is designed according to the sensitivity of the human ear to frequency. Therefore, the MFCC achieves good results in speech and speaker recognition. However, in a nonspeech environment, ambient sound signals are nonstationary and hidden, and the sequence features of the MFCC lose a large amount of high-frequency hidden information and hidden information outside the hearing threshold range. Therefore, to improve the accuracy of hidden information mining in environmental audio streams, it is necessary to establish a more accurate time–frequency feature representation system that can further locate and analyze hidden acoustic events and ultimately improve the classification accuracy of environmental audio streams.
Environmental audio streams are typical nonlinear and nonstationary time-varying signals. Thus, they require time-varying filtering and decomposition technologies. Proposed by Norden E. Huang in 1998, empirical mode decomposition (EMD) is a signal processing method suitable for nonlinear unsteady time-varying signals [20].
However, the traditional EMD method has a few disadvantages, including mode aliasing and the inconsistency of IMF dimensions after signal decomposition. These drawbacks limit the application of EMD to acoustic signal processing. Modal aliasing causes the frequency distribution of some IMFs after signal decomposition to overlap. Hence, accurately estimating the IMF range of a certain frequency distribution is difficult. Dimension inconsistency may cause variations in the number of IMFs obtained from the decomposition of source signals with the same frame length; these variations will lead to the mismatch of the required eigenvector dimensions and hinder the subsequent signal analysis and processing [21]. In 2005, R. Deering and J. E. Kaiser proposed the ensemble empirical mode decomposition (EEMD) decision method [22], which attempts to solve the problem of mode aliasing by introducing Gaussian white noise into the signal to be decomposed. In EEMD, the attributes of Gaussian white noise should be adjusted artificially. However, the Gaussian white noise leaves traces in the IMF decomposed from the signal, thereby resulting in low signal restoration accuracy and extensive calculations. Time-varying filtering-based empirical mode decomposition (TVF-EMD) uses the b-spline time-varying filter for mode selection and thus solves the problem of mode aliasing to a certain extent. However, TVF-EMD must calculate the cutoff frequency first, thus leaving the problem of dimension inconsistency unsolved [23].
By taking advantage of the time–frequency analysis of EMD, the problems of modal aliasing and frequency inconsistency in EMD must be resolved. Therefore, the current study consists of two parts. First, based on the traditional EMD, an improved heuristic empirical mode decomposition (HM-EMD) method is proposed. This method improves the purity of IMFs by adopting adaptive mask signals. With this method, the frequency domain distribution and IMF dimension can be stabilized and the inconsistency of the IMF dimension can be improved. The mask signals introduced in EMD can be obtained through heuristic learning and provide technical support for the feature extraction of hidden acoustic signals. On the basis of the mask signals, the hidden audio component features (HACFs) for audio stream recognition are constructed. According to the classification dataset Task-A [19] of the environmental audio stream in DCASE, hidden acoustic events, such as ‘birdsong’ and ‘footsteps’ in environmental audio streams, can be located and analyzed. The analysis results can be applied for multiple levels and multiple time scales of environment safety certification in audio streams. They can also be applied to other complex acoustic analyses and processing.
This work is divided into five parts. The second part mainly introduces the principle of HM-EMD. The signal processing flow and existing problems of the classical EMD algorithm are analyzed, and the principle of the HM-EMD algorithm is presented in detail. The third part describes the mining of hidden information in audio streams on the basis of the proposed HM-EMD. Specifically, environmental audio stream data are analysed, and the HACFs for hidden information in audio streams are designed according to the analysis results. The fourth part presents the classification of audio streams on the basis of HM-EMD. The experimental dataset is obtained from the low-complexity acoustic scene classification task provided by DCASE in 2020. The experimental results show that the proposed method can accurately extract and locate hidden acoustic events, thus improving the accuracy of audio stream classification. The fifth part summarises the characteristics of the proposed method and presents future research directions.
Heuristic Mask for Empirical Mode Decomposition
Empirical Mode Decomposition Method
Empirical Mode Decomposition
EMD can decompose the original signal x(t) (
where
Modal Aliasing of EMD
The most significant disadvantage of EMD is mode aliasing. In mode aliasing, a single IMF contains signals of different frequencies or signals of the same frequency that appear in different IMF components. The typical mode aliasing phenomena are described as follows:
1) For multiple single-frequency signals, a mixed signal is an amplitude modulation (AM)–frequency modulation (FM) signal if the energy levels of the source signals are similar. When the frequency ratio

FIGURE 1. EMD results for signal x1(t), (A) IMFs of x1(t); (B) FFT spectrum of each corresponding IMF; (C) Instantaneous frequency of each IMF.
2) Several different frequency signals are superimposed at different times, and the maximum value of the nonaliased part is missing, resulting in modal aliasing, such as EMD Results for signal
The frequency ratios in

FIGURE 2. EMD results for signal x2(t), (A) IMFs of x2(t); (B) FFT spectrum of each corresponding IMF; (C) Instantaneous frequency of each IMF.
3) Mode aliasing also occurs when the distribution of extreme points in a window is not uniform even if Eqs 1, 2 are satisfied, such as signal

FIGURE 3. EMD results for signal x3(t), (A) IMFs of x3(t); (B) FFT spectrum of each corresponding IMF; (C) Instantaneous frequency of each IMF.
When the frequency interval between multiple signals is too small or there is noise, the local extremum will jump many times in a very short time interval. The local extremum as control points for cubic b-spline interpolation in the process of EMD. The cubic b-spline interpolation resulting in the spectrum envelope will be fluctuated if the extreme value loss or extreme value distribution is inconsistent. This condition can adversely affect the spectral envelope. At this time, the time-domain signal does not meet the narrow-band requirements of IMF decomposition, resulting in mode aliasing. Therefore, the absence of extremum is an important cause of mode aliasing in EMD calculation. The different causes of the lack of extreme values require different processing methods. The causes of missing extreme values can be divided into two categories. One is the uneven distribution of extreme values in the analysis window caused by signal concealment at a certain time (Figure 2). The key to dealing with this type of modal aliasing is to determine the time when the signal concealment occurs. If the analysis is conducted according to the time point of concealment, then aliasing will not occur. The other category involves signal spectrum aliasing, which can be addressed by adding mask signals; that is, by creating a mask signal s (T), we can derive the following:
For
However, signal mode aliasing in practical applications cannot be attributed to a single factor (Figure 3). It usually includes hiding and spectrum aliasing. Therefore, it can be considered to determine the time of signal concealment. Then, a mask signal is introduced to the period of concealment to perform mode decomposition. Therefore, the current work proposes the HM-EMD method. This method maximises the use of the intrinsic properties of signals to construct variable analysis windows and mask signals that can adapt to a variety of signal contents. The principle and implementation process are described herein.
Heuristic Mask Signals
Basic Principle Analysis
The signal properties need to be established prior to EMD. A time-varying FM/AM model can be used to express any nonstationary signal; that is,
where a (T) is the envelope function and ω (T) is the phase function. The analytical signal is
Here,
For the single component mode, the instantaneous frequency
If
where
Algorithm Description
The HM-EMD algorithm comprises the following steps: variable analysis window construction and mask signal construction.
1) Variable Analysis Window Construction.
The jump point
where
2) Mask Signal Construction.
The sine signal is a common form of a mask signal, and its amplitude and frequency should be determined. As analyzed in Empirical Mode Decomposition Method, the frequency is determined as the average instantaneous frequency
where
Then, the IMFs can be refreshed by Eqs. 3–5, in which the number of IMFs are determined by
HM-EMD-Based Acoustic Scene Classification
Acoustic Scene Signal Analysis
When processing the original signal with HM-EMD, the variable analysis window and mask signal are used to intervene the decomposition of the original signal. The frame length is selected according to the frequency structure of the signal itself, while the frequency domain components corresponding to each IMF are relatively independent, which provides higher interpretability of the features. The instantaneous frequency and amplitude of each IMF also contain all information of IMF components, which means that the instantaneous frequency and amplitude of all IMF components contain most of the information of the signal to be analyzed, and can be directly used as the basic characteristics of the signal. Figure 4 shows the time-domain waveforms of some typical IMFs with hiding acoustic events in the ambient audio stream, in which only the most significant one of all IMF waveforms is shown. It can be seen that the time-domain waveform characteristics of these events are very obvious, the extreme value and over average rate are very different, and they are distributed in low, medium and high frequency bands, such the airport luggage roller in Figure 4A and Metro rail joint collision in Figure 4B are low frequency, steps in Figure 4D and tram acceleration in Figure 4F are medium frequency, chirm in Figure 4C, vehicles from far to near in Figure 4E are high frequency. Therefore, this paper proposes a full band IMF hiding component features, which can distinguish them well, to effectively improve the effect of ambient audio stream recognition algorithm, the feature calculation method is shown in Mutagenic Component Features.

FIGURE 4. IMF waveforms with significant hidden components in different environments of the audio stream, (A) Airport luggage roller–IMF16, low freq; (B) Metro rail joint collision–IMF14, low freq; (C) Chirm–IMF1, high freq; (D) steps–IMF10, medium freq; (E) Vehicles from far to near–IMF1, high freq; (F) Tram acceleration–IMF4, Medium and high freq.
Mutagenic Component Features
Figure 4 shows various hidden components in the acoustic scene data. On the one hand, the hidden components cause a significant interference to the signal spectrum, thereby greatly affecting the ambient audio stream recognition effect based on traditional spectrum features (such as MFCC). On the other hand, the types and characteristics of hidden components corresponding to different ambient audio streams also exhibit significant differences. These hidden components are closely related to the types of acoustic events. The features constructed on the basis of hidden components can help to distinguish ambient audio streams. For a hidden component, its frequency, amplitude and change mode information can effectively reflect its essential attributes. Almost all of such information can be reflected by the envelope shape of the IMF obtained by decomposition. Therefore, we design a set of HACFs. Based on the IMF decomposed by HM-EMD, the features extract the relevant information of hidden components, including the shock intensity feature SH and over-average feature average crossing rate (ACR).
1) Shock intensity feature (SH):
where max
2) ACR feature:
ACR features can express the number of times the upper envelope of an IMF passes through its mean point, that is, the number of times the IMF’s upper envelope (time domain amplitude) fluctuates significantly. If the value is large, the IMF amplitude frequently fluctuates near the mean value. For ambient audio stream recognition application scenarios, if the value is greater than a certain threshold (10 Hz or above), the data may not have obvious and meaningful hidden components and the change of the upper envelope near the mean value is only the normal fluctuation of the acoustic signal itself. If the value is less than the threshold, the data may contain significant hidden components, and one-half of the zero crossing frequency is the frequency of the hidden components.
Ambient Audio Stream Classification
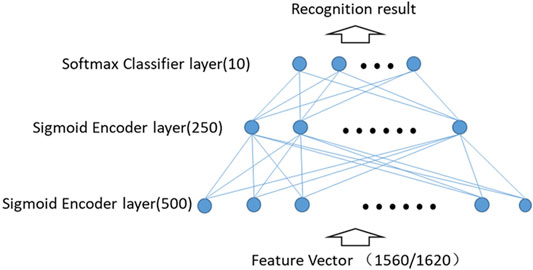
The ambient audio stream classification process based on HM-EMD is shown in Figure 5. HM-EMD is used to obtain the IMF set of the signal to be analyzed. Then, the following basic features are extracted: instantaneous frequency, instantaneous amplitude and the HACFs proposed in this work. Organised as a feature matrix, the features are input into the classifier to obtain the final recognition result. We select the neural network model for the classifier. The network structure is shown in Figure 6. To prove the effectiveness of the features, we select a three-layer neural network model. The first two layers use a sigmoid function as the activation function. First hidden layer has 500 and second hidden layer has 250 neurons. The output layer uses a softmax classifier and has 10 neurons. The experimental results show that the feature system still shows satisfactory results even with the use of a simple classification model. The specific experimental results and analysis are presented in the next section.
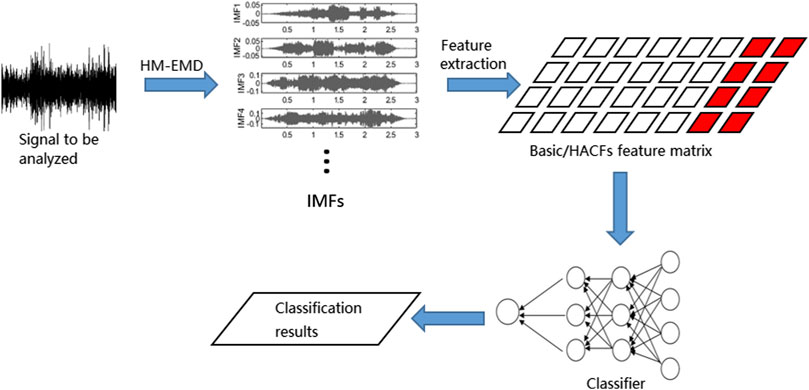
FIGURE 5. Ambient audio stream classification flow chart based on heuristic mask empirical mode decomposition.
Experiments and Results
Experimental Setup
We verify the results of this work from two aspects: the validity of modal separation and the validity of the HM-EMD features for environmental audio stream classification. The experiments use Python language, the deep learning framework uses the PyTorch framework, and the data set uses the task 1A audio scene classification dataset in DCASE competition.
Validation of Modal Separation
A nonlinearity index is defined in Eq. 13, and it measures the stability of the decomposition results. The larger the DN is, the greater the nonlinear degree is, indicating the more unstable components; the verification data are the mixed signals of the three modes in Figures 1–3.
Validation of the Features of HM-EMD for the Classification of Ambient Audio Streams
The data used in the experiment come from the TASK1A dataset of DCASE [19]. Task1A that is to classify the acoustic scene with multiple devices. The dataset contains data on ten cities and nine devices, that is, three real devices (A, B, C) and six simulated devices (S1–S6). The dataset has good annotation, including three different types of indoor, outdoor and traffic. It also has ten different ambient audio streams, namely, airport, shopping mall, metro, metro station, pedestrian, street traffic, tram, park and public square and bus. The acoustic data span a total of 64 h, with 40 h used in dataset training and with 24 h used in verification. Each audio segment is 10 s long, and the sampling rate is 44.1 kHz.
To verify the effectiveness of designing a series of features based on HM-EMD, we use a basic HM-EMD feature matrix and a basic features + HACF matrix as the input parameters of the classifier. Specifically, the number of mask EMD reference IMFs is 20, HM-EMD basic feature is 2D and HACFs is 3D, which number of dimension is 20 × 3. The audio frame length is 0.5 s, and the interframe overlap is 0.25 s, the total number of dimensions is 39 × 20 × 3 = 2340. The classical MFCC are selected as the contrast features; they include 13 dimensional MFCCs and delta features. The total number of dimensions is 39, and the audio frame length is 40 ms. The specific experimental results are described herein.
After setting the characteristic parameters, we conducted the test according to the process designed in Figure 5. We trained the classifier parameters with the training dataset and tested them with the test set.
Results and Analysis
Effectiveness Analysis for Modal Separation
By comparing the traditional EMD results, we can see DNHM-EMD/DNEMD <1 for any given case. Hence, the IMF processed by the HM-EMD method has the lowest nonlinearity; that is, the IMF has a high purity and is close to the blind separation result under an ideal state. The separation result is shown in Figure 7. From the FFT spectrum corresponding the IMFs of
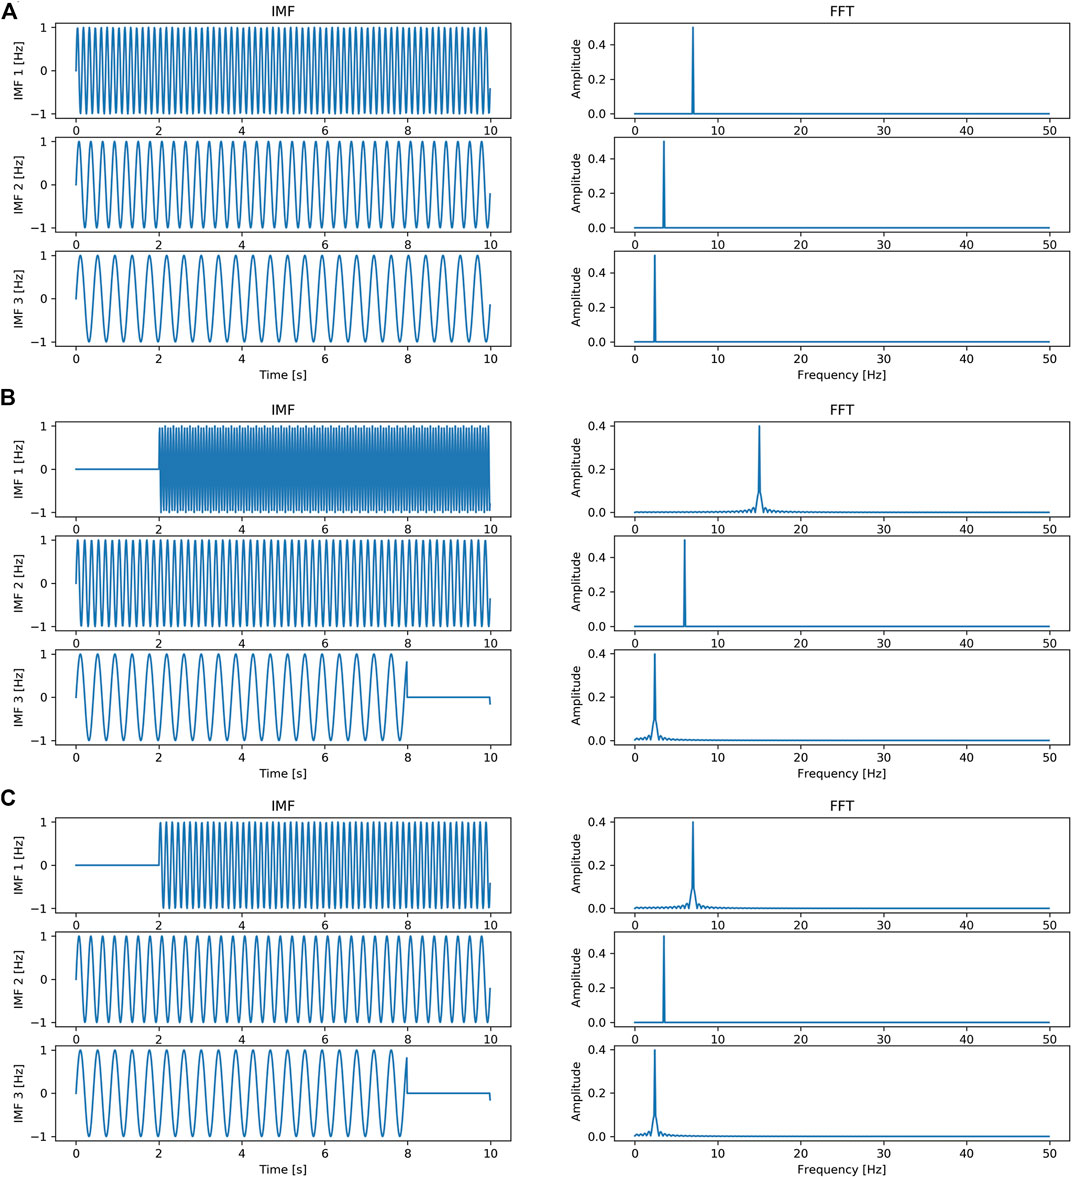
FIGURE 7. HM-EMD results of x1(t), x2(t), x3(t), (A) IMFs of x1(t) and the FFT spectrum of each corresponding IMF; (B) IMFs of x2(t) and the FFT spectrum of each corresponding IMF; (C) IMFs of x3(t) and the FFT spectrum of each corresponding IMF.
Based on HM-Feature Validity of EMD
HACFs can be used to identify the hidden components in IMFs and are thus of great significance for ambient audio stream recognition. We verified the discrimination ability of HACFs in different scenarios in Figure 8. The figure shows the scatter projection of some hidden component features in the three-dimensional space. Even the three-dimensional features in a single IMF have a strong scene discrimination ability. HACFs show good discrimination ability among different ambient audio stream categories and thus provide technical support for subsequent ambient audio stream classification.
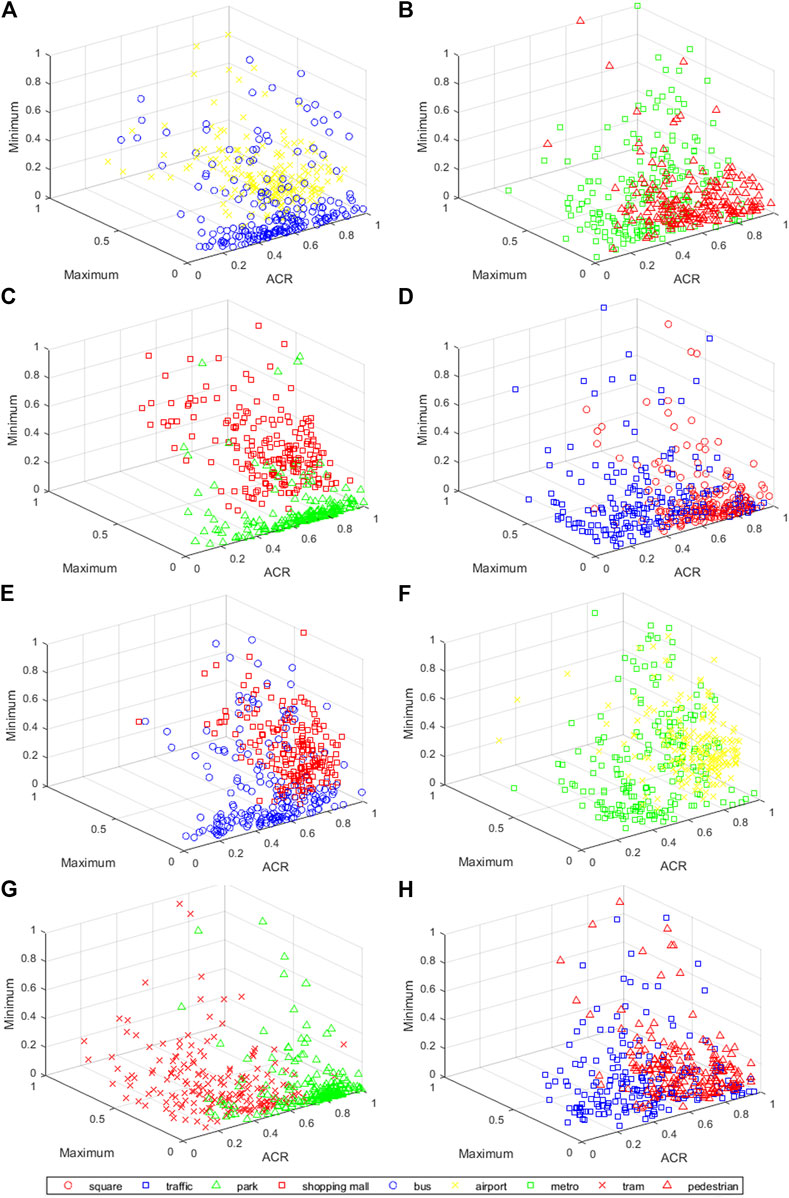
FIGURE 8. HACFS feature distribution in 3D space, (A) IMF1 of bus & airport; (B) IMF1 of metro & pedestrian; (C) IMF1 of park & shopping mall; (D) IMF1 of square & traffic; (E) IMF2 of bus & shopping mall; (F) IMF2 of met; (G) IMF2 of tram & park; (H) IMF2 of traffic & pedestrian.
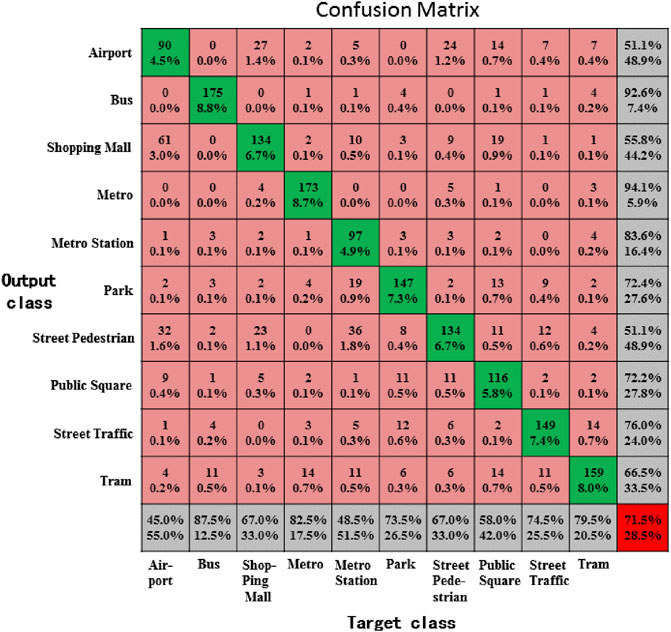
We use the simple classifier shown in Figure 6 to classify and recognize the environmental audio streams in different scenes based on HM-EMD basic feature and basic + HACFs feature respectively, and then use the confusion matrix to represent the recognition accuracy in each scene. The vertical axis represents the classification output, and the horizontal axis represents the annotation result, as shown in Figures 9, 10. As can be seen from Figure 9, the average recognition rate for all scenes is 60.8%, and the average recognition rate increases to 71.5% in Figure 10 after adding HACFs feature. The main improvements are achieved in the airport, shopping mall, metro station, park, pedestrian, street traffic and tram scenes. Special hidden events often occur in these scenes, and these acoustic events are highly related to the background. Therefore, the proposed HACFs can effectively represent the hidden information to improve recognition rate.
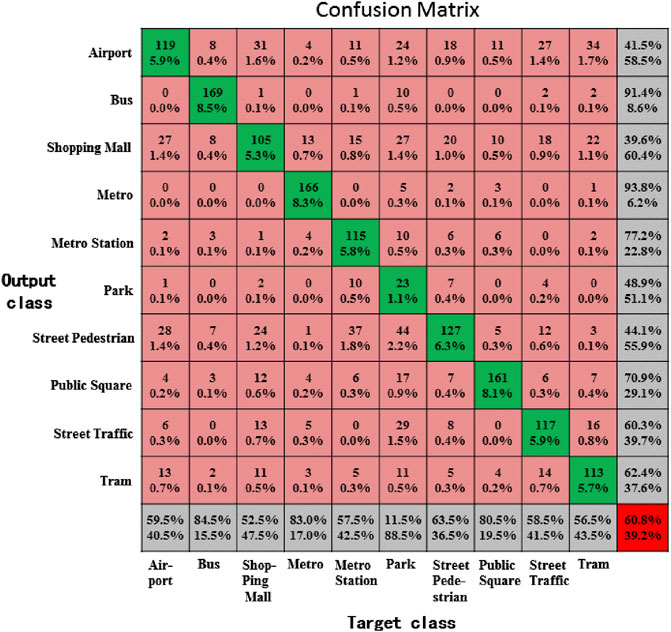
FIGURE 9. Recognition results of basic instantaneous frequency and instantaneous amplitude features.
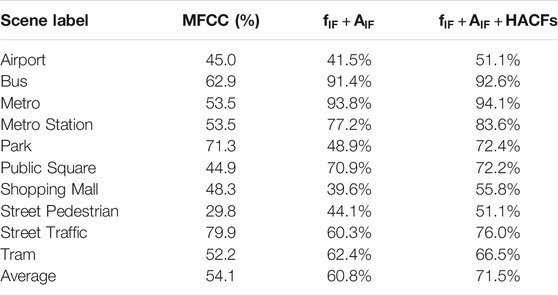
We use the basic classifier and complex classifier in each classifier, according to HM-EMD basic characteristics, HM- EMD basic features + HACFs features and classic MFCC features are used to classify and recognize the environmental audio stream. The basic classifier is the simple three-layer perceptron shown in Figure 6, while the complex classifier adopts the optimal classifier used in the DCASE competition [24], the classification results are shown in Tables 1, 2. From these two tables, it can be seen that the HM-EMD feature is superior to the MFCC feature with different classifiers: Given the basic classifier,
Conclusion
The processing requirements of hidden acoustic signals in ambient audio stream classification are analyzed in this work. Specifically, an ambient audio stream feature extraction method based on HM-EMD is proposed. With the construction of an adaptive mask signal, the frequency domain distribution and IMF dimension are stabilised, and the instability of the time–frequency domain feature system in the acoustic signal processing of the classical EMD algorithm is solved. Then, the time–frequency analysis characteristics of EMD in nonlinear and nonstationary signal processing are fully exploited. Through the Hilbert transform spectrum of each IMF, the hidden components in ambient audio stream signals are analyzed and located to construct the related HACFs. The experimental results show that HM-EMD-based features exhibit greater capability in hidden acoustic event representation than MFCC. Therefore, in our future work, we will study the methods to improve the representation ability of ambient audio streams by exploring the relationship between HM-EMD feature systems and different hidden acoustic events. Attempts will also be made to achieve the accurate labelling of hidden acoustic events in multilevel and multitime scale ambient audio streams with HACFs, such as hidden acoustic event location and hidden acoustic event recognition. In general, the ambient audio stream feature extraction based on HM-EMD represents an effective effort toward ambient audio stream classification. By improving the time–frequency resolution for the analysis of nonstationary environmental acoustic signals, capturing the hidden features of the environment and enhancing the local feature representation, the proposed method can effectively improve the efficiency and performance of the classification modelling of the hidden information of ambient audio streams, which provides technical support for camouflaged audio information detection. Hence, it helps to reduce the risk of audio camouflage attacks in social networks.
Data Availability Statement
The datasets presented in this study can be found in online repositories. The names of the repository/repositories and accession number(s) can be found below: http://dcase.community/challenge2020/task-acoustic-scene-classification.
Author Contributions
JL and DZ conceived and designed the study. ZX performed the simulations. ZZ and LY reviewed and edited the manuscript. All authors read and approved the final manuscript.
Funding
This work was supported in part by the N National Key Research and Development Program (2018YFC0830602), and the Sichuan Science and Technology Program (No. 2019YFSY0049).
Conflict of Interest
The authors declare that the research was conducted in the absence of any commercial or financial relationships that could be construed as a potential conflict of interest.
Publisher’s Note
All claims expressed in this article are solely those of the authors and do not necessarily represent those of their affiliated organizations, or those of the publisher, the editors and the reviewers. Any product that may be evaluated in this article, or claim that may be made by its manufacturer, is not guaranteed or endorsed by the publisher.
References
1. Li S, Zhao D, Wu X, Tian Z, Li A, Wang Z. Functional Immunization of Networks Based on Message Passing. Appl Mathematics Comput (2020). 366:124728. doi:10.1016/j.amc.2019.124728
2. Han W, Tian Z, Huang Z, Topic Representation Model Based on Microblogging Behaviour Analysis. World Wide Web. (2020). 23. p. 11–2. doi:10.1007/s11280-020-00822-x
3. Chen T, Kumar A, Nagarsheth P, Sivaraman G, Khoury E. “Generalization of Audio Deepfake Detection,” Odyssey 2020 the Speaker and Language Recognition Workshop. Tokyo, Japan (2020). p. 132–7. doi:10.21437/Odyssey.2020-19
4. Jati A, Hsu C-C, Pal M, Peri R, AbdAlmageed W, Narayanan S, et al. Adversarial Attack and Defense Strategies for Deep Speaker Recognition Systems. Computer Speech Lang (2021). 68:101199. doi:10.1016/j.csl.2021.101199
5. Al-Turjman F, Salama R. “Cyber Security in Mobile Social Networks,” Security IoT Soc Networks. (2021). p. 55–81. doi:10.1016/b978-0-12-821599-9.00003-0
6. Lin ZD, Di CG, Chen X. Bionic Optimization of MFCC Features Based on Speaker Fast Recognition. Appl Acoust (2020). 173:107682. doi:10.1016/j.apacoust.2020.107682
7. Sudo Y, Itoyama K, Nishida K, Nakadai K. Sound Event Aware Environmental Sound Segmentation with Mask U-Net. Adv Robotics (2020). 34(20):1280–90. doi:10.1080/01691864.2020.1829040
8. Waldekar S, Saha G. Two-level Fusion-Based Acoustic Scene Classification. Appl Acoust (2020). 170:107502. doi:10.1016/j.apacoust.2020.107502
9. Baltrusaitis T, Ahuja C, Morency LP. Multimodal Machine Learning: A Survey and Taxonomy. IEEE Trans Pattern Anal Mach Intell (2018). 41(2):423–43. doi:10.1109/TPAMI.2018.2798607
10. Zhang T, Wu J. Constrained Learned Feature Extraction for Acoustic Scene Classification. Ieee/acm Trans Audio Speech Lang Process (2019). 27(8):1216–28. doi:10.1109/taslp.2019.2913091
11. Chandrakala S, Jayalakshmi SL. Generative Model Driven Representation Learning in a Hybrid Framework for Environmental Audio Scene and Sound Event Recognition. IEEE Trans Multimedia (2019). 22(1):3–14. doi:10.1109/TMM.2019.2925956
12. Xie J, Zhu M. Investigation of Acoustic and Visual Features for Acoustic Scene Classification. Expert Syst Appl (2019). 126:20–9. doi:10.1016/j.eswa.2019.01.085
13. Lostanlen V, Lafay G, Anden J. Relevance-based Quantization of Scattering Features for Unsupervised Mining of Environmental Audio. EURASIP J Audio Speech Music Process (2018). 15. doi:10.1186/s13636-018-0138-4
14. Li SD, Jiang LY, Wu XB. A Weighted Network Community Detection Algorithm Based on Deep Learning. Appl Mathematics Comput (2021). 401:126012. doi:10.1016/j.amc.2021.126012
15. Suh S, Park S, Jeong Y. (2020).Designing Acoustic Scene Classification Models with CNN Variants. Dcase2020 Challenge, Tech Rep. Available at: http://dcase.community/documents/challenge2020/technical_reports/DCASE2020_Suh_101.pdf.
16. Garcia-Romero D, McCree A. Stacked Long-Term TDNN for Spoken Language Recognition. In 17th Annual Conference of the International-Speech-Communication-Association (INTERSPEECH 2016). San Francisco, CA, USA (2016). p. 3226–30.
17. Cramer J, Wu HH, Salamon J. Look, Listen, and Learn More: Design Choices for Deep Audio Embeddings. In ICASSP 2019-2019 IEEE International Conference on Acoustics, Speech and Signal Processing (ICASSP). United Kingdom: Brighton (2019). p. 3852–6.
18. Khan MA, Javed K, Khan SA, Saba T, Habib U, Khan JA, et al. Human Action Recognition Using Fusion of Multiview and Deep Features: an Application to Video Surveillance. Multimed Tools Appl (2020). doi:10.1007/s11042-020-08806-9
19. Heittola T, Mesaros A, Virtanen T. TAU Urban Acoustic Scenes 2020 Mobile, Development Dataset. Dcase2020 Challenge, Tech Rep (2020). doi:10.5281/zenodo.3819968
20. Barbosh M, Singh P, Sadhu A. Empirical Mode Decomposition and its Variants: A Review With Applications in Structural Health Monitoring. Smart Mater Struct (2020). 29(9):093001. doi:10.1088/1361-665X/aba539
21. Kim D, Kim KO, Oh H-S. Extending the Scope of Empirical Mode Decomposition by Smoothing. EURASIP J Adv Signal Process (2012). 2012:168. doi:10.1186/1687-6180-2012-168
22. Deering R, Kaiser JE. The Use of a Masking Signal to Improve Empirical Mode Decomposition. In ICASSP 2005-2005 IEEE International Conference on Acoustics, Speech and Signal Processing (ICASSP). Philadelphia, PA, USA (2005). p. 485–8.
23. Li H, Li Z, Mo W. A Time Varying Filter Approach for Empirical Mode Decomposition. Signal Process. (2017). 138:146–58. doi:10.1016/j.sigpro.2017.03.019
24. Shim HJ, Kim JH, Jung JW. Audio Tagging and Deep Architectures for Acoustic Scene Classification: Uos Submission for the DCASE 2020 Challenge. Dcase2020 Challenge, Tech Rep (2020). Available at: http://dcase.community/documents/challenge2020/technical_reports/DCASE2020_Shim_120.pdf.
Keywords: social networks, machine learning, audio information camouflage, audio scene classification, emd
Citation: Lou J, Xu Z, Zuo D, Zhang Z and Ye L (2021) Audio Information Camouflage Detection for Social Networks. Front. Phys. 9:715465. doi: 10.3389/fphy.2021.715465
Received: 27 May 2021; Accepted: 20 July 2021;
Published: 04 August 2021.
Edited by:
Shudong Li, Guangzhou University, ChinaReviewed by:
Chengyi Xia, Tianjin University of Technology, ChinaLongfei Wu, Fayetteville State University, United States
Chao Gao, Southwest University, China
Copyright © 2021 Lou, Xu, Zuo, Zhang and Ye. This is an open-access article distributed under the terms of the Creative Commons Attribution License (CC BY). The use, distribution or reproduction in other forums is permitted, provided the original author(s) and the copyright owner(s) are credited and that the original publication in this journal is cited, in accordance with accepted academic practice. No use, distribution or reproduction is permitted which does not comply with these terms.
*Correspondence: Decheng Zuo, enVvZGNAaGl0LmVkdS5jbg==
 Jiu Lou
 Zhongliang Xu

