 U. Fantz
 S. Briefi
 A. Heiler
94% of researchers rate our articles as excellent or good
Learn more about the work of our research integrity team to safeguard the quality of each article we publish.
Find out more
REVIEW article
Front. Phys., 29 September 2021
Sec. Low-Temperature Plasma Physics
Volume 9 - 2021 | https://doi.org/10.3389/fphy.2021.709651
This article is part of the Research TopicIon Beams from Plasmas: Space to NanotechnologyView all 4 articles
The neutral beam injection systems for the international fusion experiment ITER used for heating, current drive, and diagnostic purposes are based on RF-driven negative hydrogen ion sources with a source area of roughly 0.9 m × 1.9 m. The sources operate at 0.3 Pa in hydrogen and in deuterium using a total available RF generator power of 800 kW per source at a frequency of 1 MHz. In order to fulfill the challenging requirements for ITER and beyond (like a DEMOnstration power plant, DEMO), worldwide developments are underway addressing the topics of plasma generation, ion extraction together with the issue of reducing and stabilizing the co-extracted electron current, and the beam properties. At the example of the activities at the ITER prototype source and the size scaling experiment ELISE, the present status and its challenges are summarized. The RF power transfer efficiency of these sources is only about 65% in maximum, giving significant room for improvements to relax the demands on the RF generator and ensure reliable operation. The plasma uniformity in front of the large extraction system is the result of plasma drifts. They have a huge impact on the nonuniformity of the co-extracted electrons and influence the ions and thus the beam properties as well. Understanding the optics of such large beams composed of hundreds of beamlets is a crucial task and is under continuous improvement. The main challenge, however, is still the fulfillment of the ITER requirements for deuterium, in particular, for long pulses. The management of caesium, which is evaporated into the source to generate sufficient negative ions by the surface conversion process, is one of the keys for stable and reliable operation.
The international fusion experiment ITER [1] will be equipped with two powerful neutral beam injection (NBI) beamlines for heating and current drive (power per beamline: up to 16.5 MW) with the option to add a third one in a later stage [2]. A diagnostic injector with low power (2.2 MW) will be required to diagnose the He ash content using charge exchange resonance spectroscopy [3]. These NBI systems are based on the generation in a low-temperature, low-pressure plasma, on electrostatic extraction and acceleration of negative hydrogen ions, followed by neutralization in a hydrogen gas target to inject fast neutral particles into the fusion device. The particles shall have an energy of 870 keV and 1 MeV for hydrogen and deuterium, respectively, for the heating beams (HNB), whereas only hydrogen at 100 keV is foreseen for the diagnostic beam (DNB). The ion sources have to operate at a pressure of 0.3 Pa or below in order to keep stripping losses in the seven-stage accelerator system below 30%. The requirements for the HNBs in terms of current extracted from one large ion source are very challenging, namely 57 A for 3,600 s in deuterium operation and 66 A for 1,000 s in hydrogen (corresponding to current densities of 286 and 329 A/m2, respectively). The DNB should deliver even 77 A in hydrogen (corresponding to 391 A/m2) at a 3 s on/20 s off time with a repetition rate of 5 Hz. The inevitably co-extracted electron current has to be kept below the ion current in order to avoid damages to the second grid of the extraction system, to which the electrons are deflected by embedded magnets. An extraction voltage of 9–10 kV is envisaged to achieve these parameters. For a proper beam transport, the homogeneity of the accelerated beam, composed of 1,280 beamlets, has to be better than 90% down to the scale of single beamlets. Additionally, the core of the accelerated beamlets (carrying ≈85% of the power) needs to have a divergence of less than 7 mrad, while significantly higher divergences of 15–30 mrad are allowed for a halo carrying the remaining ≈15% of the beamlet power [2, 4].
The ion source itself has a rectangular shape with a width of 0.9 m and a height of 1.9 m, accommodating the 1,280 apertures with 14 mm diameter resulting in an extraction area of 0.2 m2. The RF-driven concept (inductively coupled plasma source, ICP) has been chosen for plasma generation using a frequency of 1 MHz and a total power of up to 800 kW delivered by four RF generators. In order to generate sufficient negative ions at the required low pressure, the surface conversion process is utilized, for which caesium is evaporated into the source. By covering the molybdenum-coated copper plasma grid (the first grid of the extraction system) with caesium, its work function is reduced, which enhances the negative ion production, accompanied by a simultaneous decrease of the amount of co-extracted electrons.
The requirements for the operational parameters of the ion source and accelerator are very challenging and by far exceed those of the NBI systems based on negative ions (NNBI) at existing fusion devices JT-60U [5], JT-60SA [6], and LHD [7]. The ion sources at those systems are based on filament discharges (arc discharges) and are typically operating only for a few seconds at their nominal heating power. For reduced power, pulses of up to several tens of seconds have been demonstrated. In preparation for the NBI system of JT-60SA, pulses of up to 60 s have been obtained with an accelerated current density of 190 A/m2, but only for a small extraction area (nine apertures) [8]. For RF sources, ITER-relevant ion current densities have been demonstrated at smaller test facilities [9] for a beam duration of a few seconds.
The responsibility for the full HNB beamline is equally shared between Europe and Japan. Focus on the accelerator technology for 1 MeV is given to Japan, whereas Europe focuses on the ion source. As the ITER NBI requirements have not yet been met simultaneously, the ITER Organization (IO), together with the European domestic agency Fusion For Energy (F4E), has defined an R&D roadmap towards the NBI systems for ITER [2, 10]. An important step in the size scaling of RF sources from the prototype source (1/8 size) to the full ITER size is the half-size ITER source at the test facility ELISE (Extraction from a Large Ion Source Experiment), which is in operation at IPP, Garching. The full-size source will be commissioned and operated at the European Neutral Beam Test Facility (NBTF) in Padua, Italy [11]. The NBTF hosts a test facility for the ITER NBI ion source (Source for the Production of Ions of Deuterium Extracted from a Radio frequency plasma, SPIDER), which went into operation in 2018 [12, 13]. The second test facility that represents the full prototype beamline of the HNB of ITER (Megavolt ITER Injector and Concept Advancement, MITICA) is currently planned to go into full operation in 2024 [14]. ITER-India is responsible for the DNB and has also developed a dedicated R&D roadmap [15]: starting with a 1/8 ITER prototype source at the test facility ROBIN (Replica Of BATMAN like source in INDIA), which went into operation in 2011, an intermediate step using a ¼ ITER source—the Twin source—has been started recently. Finally, a full prototype DNB is under preparation including the long transmission line to the fusion device. Accompanying programmes for the ion source and the accelerator technology are undertaken at NIFS and at QST in Japan, together with supporting activities at universities all over the world. As an intermediate step between ITER and a commercial power plant, activities started in several countries to design a DEMO (DEMOnstration reactor), for which NBI is also foreseen as an option. Such a system would be based on a similar source concept to benefit from the experience gained at ITER.
The prototype source has been tested first at the BATMAN test facility (BAvarian Test MAchine for Negative ions, in operation at IPP Garching) with focus on the demonstration of the ion source parameters for short pulses (up to 4 s extraction) in hydrogen and deuterium, accompanied by extensive plasma diagnostics to get insights into the underlying ion source physics. In 2018, the test facility was upgraded to focus on the beam properties (Batman UpGrade, BUG) [16]. The typical size of the total extraction area is about 0.01 m2. Long pulses, i.e., steady-state operation, were demonstrated at the test facility MANITU, which was equipped with the prototype source [17]. The modular design of the prototype source has been proven at RADI [18], a source size scaling experiment without extraction system. The half-size ITER source with extraction went into operation in 2012 at the test facility ELISE with a total extraction area of about 0.1 m2. A detailed overview of the work performed at IPP can be found in [9, 19]. At ELISE, the ITER parameters could be demonstrated in hydrogen, i.e., more than 90% of the required extracted ion current for 1,000 s was achieved, limited only by technical constraints regarding the available RF power and the high-voltage power supply [20]. The achievement of the target parameters in deuterium for long pulses is still pending as the co-extracted electrons are limiting the ion source performance: the amount of the co-extracted electrons, their dynamics during long pulses, and their inhomogeneity in vertical direction are significantly stronger in deuterium than in hydrogen. Compared to the 1 MeV of the ITER beamlines, the negative ions are accelerated at these test facilities to significantly smaller energies (e.g., at ELISE up to 60 keV), with the consequence that demonstrating the low beamlet divergences planned for ITER is intrinsically not possible.
The paper addresses key issues of the development of the negative ion sources covering the aspects of effective plasma generation, plasma parameters in the generation zone and in front of the extraction system, the plasma uniformity in such large sources, and correlations with the beam uniformity of such large beams on a global scale. Differences in beam properties of a single beamlet and a beam composed of multiple beamlets are discussed as well. Focus is laid on the activities at BUG and ELISE with operation in hydrogen. Challenges for the operation in deuterium, in particular for long pulses, are emphasized, and an outlook on the next steps to be taken is given.
The plasma of RF-driven H− ion sources is generated via inductive RF coupling at a frequency of 1 MHz in a cylindrical volume, the so-called driver (Figure 1 shows a schematic of the ion source setup and the RF circuit at BUG). A solid-state-based generator supplies the required RF power of up to 100 kW. In order to tune the plasma load impedance to the 50 Ω of the generator output (i.e., there is no reflected RF power for all operational parameters), an L-type matching network with variable vacuum capacitors is set up. As the ion source is on negative high voltage potential (of up to 45 kV at BUG) but the RF generator is on ground potential, a DC insulating ferrite core transformer is introduced in the matching network.
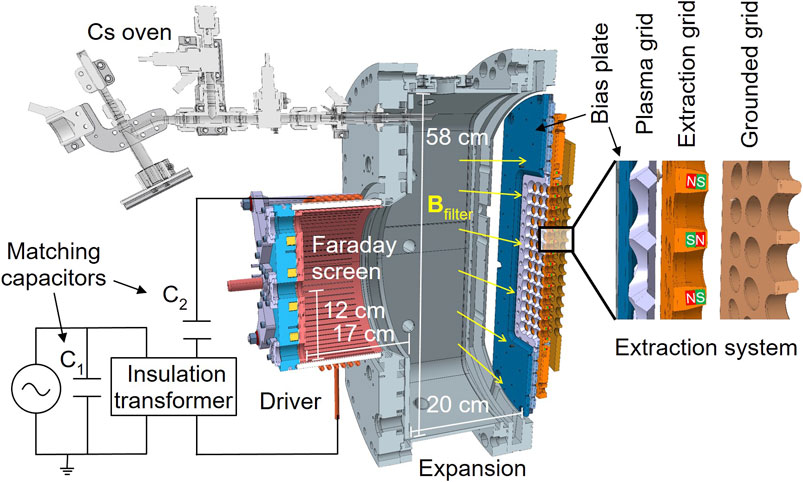
FIGURE 1. Schematic view of the ion source setup and the RF circuit of the prototype source at the BATMAN Upgrade testbed.
The driver itself is set up from a dielectric vessel (quartz or aluminium oxide) and a six-turn RF coil. In addition, a Faraday screen is inserted between the plasma and the dielectric in order to avoid plasma erosion by capacitive RF coupling. From the driver, the plasma expands towards the first grid of the extraction system, the plasma grid (PG). Caesium is evaporated from a dedicated Cs oven, which is located typically at the backplate of the source. The evaporation rate is in the order of 5 mg/h evaporating continuously. Caesium redistributes between the pulses (vacuum phase) by the elevated temperature of the source walls (around 40°C) and the grid surface, which is kept at around 150°C. During plasma pulses, the caesium redistribution is significantly enhanced by the plasma impact. The negative ions are predominantly formed at the grid surface by impinging atoms. A magnetic filter field is created in front of the PG via a current of several kA flowing in vertical direction through the plasma grid. This field has two effects: first, it cools down the electron temperature, resulting in a reduced destruction rate of H− ions via electron collisions, and second, it lowers the electron density, which reduces the amount of co-extracted electrons in the beam. In addition, the horizontal magnetic field causes plasma drifts in vertical direction (see Parameters Influencing the Uniformity). The PG is surrounded by the bias plate (BP), which is in principle an extension of the source walls (dark blue in Figure 1). Via the application of a positive voltage to the PG with respect to the BP and the source walls, the plasma in front of the PG can be influenced in a way that the co-extracted electron current is reduced further.
The extraction system consists of three grids (see insert in Figure 1): the plasma grid (up to 45 kV potential), the extraction grid (EG, typically 5–10 kV less than PG potential), and the grounded grid (GG, at ground potential). In the EG, permanent magnets are embedded in order to deflect the co-extracted electrons out of the beam onto the EG surface at rather low energies; nevertheless, the created heat load limits their tolerable amount. Besides local spots of heat loads of up to 40 MW/m2 around one extraction aperture, global vertical inhomogeneities can be expected as well due to the plasma drift. The arrangement of the apertures mimics one of the beamlet groups of the ITER layout (ITER: 15 × 6 apertures, BUG 14 × 6 apertures, both with an aperture diameter of 14 mm in chamfered geometry).
Typical plasma parameters in the driver are electron densities of 1018 m−3 with temperatures of about 10 eV and a ratio of atoms to molecules of 0.2 in hydrogen and about 0.3 in deuterium. Close to the extraction system, the electron density and temperature decrease by one order of magnitude (see Plasma Parameters). The density of neutral Cs in the source is in the range of 1014–1015 m−3, the negative ion density increases with Cs by one order of magnitude up to 1017 m−3 so that an ion-ion plasma evolves in front of the grid. Further details can be found in [19] and references therein.
For the size scaling, several drivers are used and mounted on a large expansion chamber. The arrangement is typically two drivers in horizontal direction, which are powered by one RF generator (providing up to 200 kW for the ITER cases) in series. ELISE is originally equipped with two tube-based generators (180 kW each) but presently operated with solid-state generators (up to 150 kW) with the advantage to allow for a perfect 50 Ω RF matching. This cannot be achieved with tube-based generators due to the occurring frequency flips, limiting the power that can be delivered to the drivers [21]. The extraction system follows the ITER concept, i.e., eight beamlet groups arranged in one row of four (horizontal direction) in each of the two grid segments. The plasma source can be operated in steady-state mode, but extraction and acceleration are limited to 9.5 s roughly every 3 min by the available power supply (30 A, 60 kV). Consequently, the beam is probed by so-called beam blips in the long-pulse operation. In general, repetitive pulses are performed in either the short-pulse mode (up to 10 s extraction) at BUG or ELISE, or longer pulses at ELISE, interrupted by minimum 3 min vacuum phases for data acquisition and for building up Cs reservoirs at the surfaces of the source to prepare for long pulses (see below).
The powerful RF-driven H− ion sources need RF generator powers of up to 100 kW per driver for the plasma generation at the required pressure of 0.3 Pa in the cylindrical volume of about 7 L. The ultimate goal is to generate high densities of atoms and positive ions in the driver to provide a sufficient flux of these particles onto the plasma grid for conversion to negative ions and for charge compensation. The high RF power levels impose significant strain on all RF circuit components, e.g., several hundreds of amperes for the coils and voltages in the kV range, which can cause electrical breakdowns lowering the reliability of the whole NBI beamline. Due to RF power losses by Joule heating of the RF conductors, the Faraday screen, and the metallic structure surrounding the RF circuit, where eddy currents are driven, only a fraction of the generator power is transferred to the plasma. This is quantified by the RF power transfer efficiency η, which is obtained by dividing the amount of power absorbed by the plasma Pplasma by the power provided by the generator Pgen. It should be noted that η neither considers the reflected RF power due to a possible improper impedance nor does it take into account power losses in the RF generator itself. In general, η depends in a non-trivial way on many parameters, such as the geometry of the ICP setup, the generator power, the RF frequency, the gas pressure, and the gas type (hydrogen or deuterium) as well as the strength and structure of DC magnetic fields present in the driver region.
In order to assess the RF power transfer efficiency for RF-driven H− ion sources fundamentally, a detailed experimental investigation has been carried out at BUG [22]. As the DC insulating transformer is specific for the electrical structure of the testbeds and not applied at the ITER sources (where the RF generators are also set at high voltage), the measurements were carried out without the transformer. Figure 2A shows the obtained RF power transfer efficiencies for a generator power variation at a fixed hydrogen filling pressure of 0.3 Pa. In general, η is surprisingly low: the plasma absorbs only 50–58% of Pgen without the installed transformer, and the transformer reduces this value by another 10–15% due to magnetization losses in the ferrites. For deuterium, systematically higher values by roughly 5% are obtained, independent of the actual operational parameters. Consequently, an increase of the RF power transfer efficiency by about 30% would strongly reduce the power rating and also the space demand of the RF generators, reduce the strain on the components, and thus the reliability of the whole RF setup. For optimizing η, self-consistent numerical investigations have recently been started with the aim to study the options for increasing the capability of the plasma to absorb the provided RF power (i.e., improving the coupling between RF coil and plasma) and to reduce the Joule losses in the RF conductors, the Faraday screen, and the metallic structure surrounding the RF circuit.
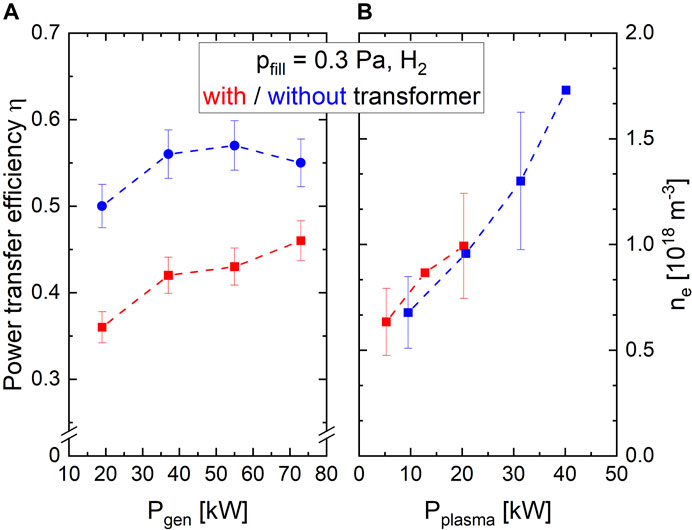
FIGURE 2. RF power transfer efficiency at BUG for varying generator power Pgen(A) and electron density obtained from Langmuir probe measurements in the driver center plotted as a function of the power absorbed by the plasma Pplasma(B). The figure is adapted from [22].
The power absorbed by the plasma is the quantity determining the plasma parameters and should be used for comparing two different ion source setups, as most likely η will not be the same. This is nicely demonstrated in Figure 2B, which shows electron densities evaluated from Langmuir probe measurements in the driver center for varying Pgen with and without the transformer, plotted as a function of Pplasma. The obtained values are within the error bars on top of each other, which would not be the case by using the generator power.
For gaining insights into the relevant physics both in the driver and in the region close to the PG where the negative hydrogen ions are formed, the determination of plasma parameters is of paramount importance. The plasma is diagnosed by different techniques (see Diagnostic Capabilities), but it is limited by the diagnostic ports available. One has to keep in mind that besides the access, the RF stray radiation is often limiting any signal-to-noise ratio, and the source with all its diagnostics is on high potential. Therefore, optical emission spectroscopy (OES) is preferred, providing a manifold of parameters line of sight (LOS) averaged.
Figures 3, 4 summarize the results of a dedicated OES campaign for the plasma parameter determination in the plasma regions (driver, expansion chamber, plasma close to the extraction system) of the ion source at BUG [23]. Focus is laid on the electron temperature Te and density ne as a function of the strength of the magnetic filter field as well as on the temperature of the neutral heavy particles. The latter is especially important for the calculation of the gas flow from the ion source through the extraction system, which determines the stripping losses of negative ions occurring predominantly in the first gap of the extraction system. The lines of sight are arranged such that one measures axially through the driver; two others are vertically centered and measure in horizontal direction at a distance of 18 cm (labeled expansion) and at 2.6 cm (labeled PG) upstream of the extraction system. It should be noted that this campaign was performed after cleaning the source from caesium, and without evaporation of Cs, which means that negative hydrogen ions are created predominantly by dissociative attachment (volume mode). The measured emissivities of the Balmer series of atomic hydrogen and of the molecular Fulcher-α transition were recorded and evaluated with the collisional radiative models Yacora H and H2 [24]. It is evident from Figure 3 that the filter field has no influence on the electron temperature and density of the driver and only little on the plasma parameters of the expansion region. Most affected—as intended—is the region close to the extraction system, where the filter field has the desired impact in significantly reducing the electron temperature and to a lesser extent the electron density. As the electrons start to be magnetized at about 1 mT, the effect of the filter field sets in here. It should be kept in mind that this is accompanied by the vertical plasma drift caused by the filter field (see Parameters Influencing the Uniformity). Also plotted are results of Langmuir probe measurements in front of the plasma grid (open symbols, details can be found in [25]). The two Langmuir probe tips are located at a distance of 2.6 cm upstream of the PG but above the bias plate. The results of the two probes do not differ much for one operational point, wherefore they are averaged for comparing them to the LOS-averaged OES data. A very good agreement between the OES and Langmuir probe values is obtained.
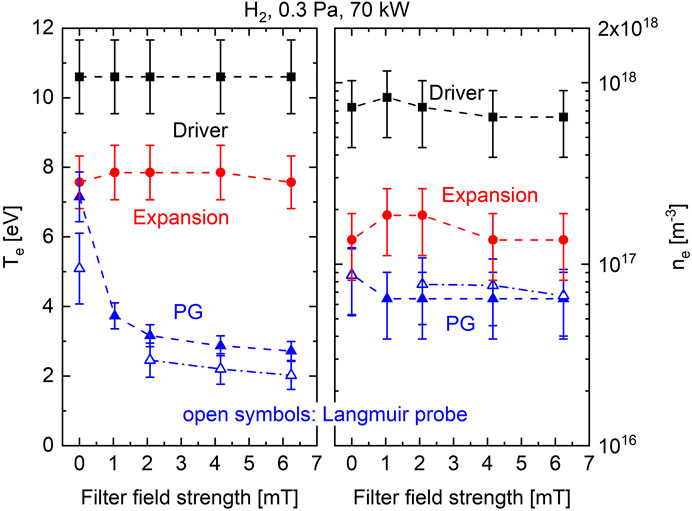
FIGURE 3. Electron temperature and density obtained for varying filter field strengths from OES at different lines of sight. For comparison, the values determined from Langmuir probe measurements at a distance of 2.6 cm upstream of the extraction system are also included (PG, open symbols). It should be noted that the filter field strength values are given for a position of 2 cm away from the PG surface and both vertically and horizontally centered.
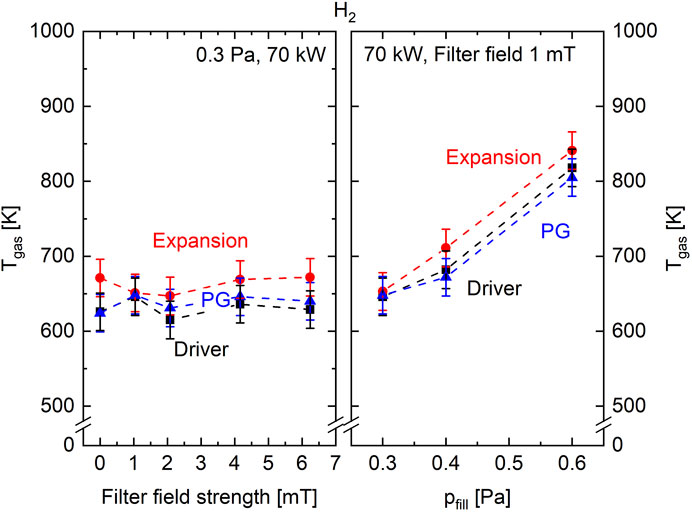
FIGURE 4. Gas temperature evaluated from OES for varying filter field strengths and filling pressures using LOS representing the different plasma regions. The filter field strength values are given for a position of 2 cm away from the PG surface and both vertically and horizontally centered.
From the evaluation of the Fulcher-α emission, the gas temperature Tgas of the plasma can be obtained. It should be noted that typically a two-temperature distribution is present in the rotational population of the hydrogen molecule. This has to be considered in the evaluation in order to avoid a potentially severe overestimation of the gas temperature (for a detailed explanation see [25]). Figure 4 shows the corresponding results for a variation of the filter field strength and filling pressure obtained from the three LOS. For a given set of operational parameters, the same value of Tgas is obtained within the error bars for the different plasma regions. The gas temperature is not sensitive to a variation of the filter field strength (left part of Figure 4) but increases from about 650 K at 0.3 Pa filling pressure to 820 K at 0.6 Pa (right part of Figure 4). An insight into the translational temperatures of the H atom can be gained via the evaluation of the profile of the Balmer emission lines. Here, a two-temperature distribution is evident where the cold ensemble has a temperature of about 2,200 K and the hot one of about 2.5 eV. The ratio between the cold and hot ensembles varies between 0.3 and 1 with changing operational parameters. However, it should be noted that OES only probes the temperatures of the excited hydrogen states, and it can only be assigned to the ground-state temperature as a first approximation. As the atomic hydrogen flux is the dominant parameter for the formation of negative ions at the PG surface, an independent measurement of the density and the temperature in the ground state by two-photon laser-induced fluorescence (TALIF) is in preparation.
The negative ion density measured by cavity ringdown spectroscopy (CRDS, see Diagnostic Capabilities) correlates well with the extracted ion current density. Figure 5 shows an example of measurements taken at the ELISE test facility using two lines of sight upstream of the PG: one above the upper PG segment and one above the lower half (corresponding to two of the seven horizontal lines of sight shown in yellow in Figure 6). The measurements represent the data obtained in a hydrogen campaign (roughly 1 month) with short pulses (20 s plasma with 10 s extraction) at the filling pressure of 0.3 Pa. The increase of the ion current density is basically due to the evaporation of fresh caesium into the ion source as deterioration of the caesium layers happens in the vacuum times (e.g., during the night; see Caesium Management and Caesium Work Function) as well as due to the increase of the RF power and extraction voltage, which represents the typical Cs conditioning process. A variation of the extraction voltage increases directly the extracted ion current, but to a much lesser extent, the negative ion density measured at a distance of about 2.5 cm upstream of the grid, which explains the data scatter seen in Figure 5 at higher ion current densities. A vertical asymmetry of the negative ion density is measured, revealing higher densities at the lower half of the ion source (see Parameters Influencing the Uniformity for a discussion of the uniformity). At current densities of ≈15% below the required ITER value for hydrogen (i.e., 329 A/m2), the negative ion densities reach values of up to 1017 m−3. As shown before for BUG, and also measured at ELISE, the electron densities in such plasmas are about 5 × 10¹⁶ m−3, which is significantly smaller than the negative ion density. This means that an ion-ion plasma with an electronegativity (α = n(H−)/n(e−)) above one evolves at the ITER source parameters. It should be noted that the correlation of the negative ion density with the extracted ion current reveals a pronounced pressure dependence [26].
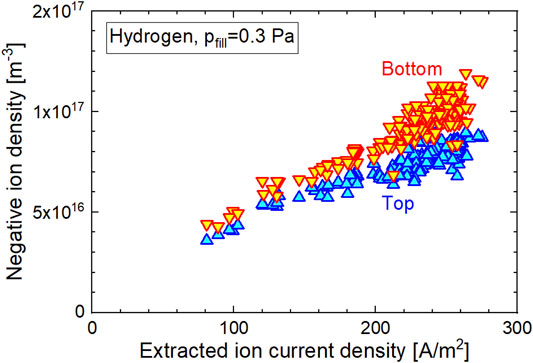
FIGURE 5. Negative ion density measured with CRDS at the test facility ELISE correlated with the extracted negative ion density at different applied RF powers and extraction voltages for caesiated hydrogen discharges. Two lines of sight are used: one above the upper grid segment (Top) and one above the lower grid segment (Bottom).
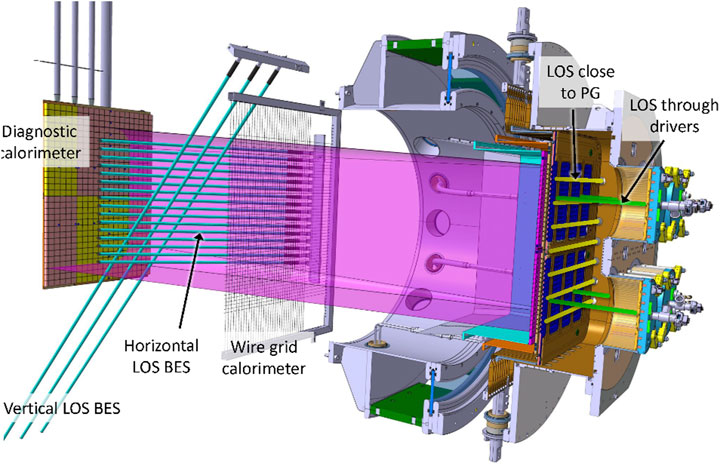
FIGURE 6. Vertical cut through the ELISE ion source (right) together with the extraction system and beamline, including the wire grid calorimeter and the diagnostic calorimeter. Some lines of sight used close to the PG by OES, TDLAS and CRDS are shown in yellow. Shown in green are OES lines of sight observing the driver plasma. The 16 horizontal LOS and three of the four vertical LOS used by BES are shown in cyan.
In a first approximation, it is reasonable to assume that the plasma properties in the plasma region close to the PG are directly correlated with the beam properties. Examples are the negative ion density and the extracted current density of negative ions or the electron density and the co-extracted electron current. On the other hand, negative ions and electrons are extracted from the plasma at the plasma meniscus (which is the transition between the quasi-neutral plasma and the extracted particle beam formed at the apertures of the plasma grid), a region, which is rarely accessible by plasma diagnostics as it is within the chamfered aperture. Also small-scale nonuniformities are expensive to detect in a routine manner in these large sources. Global dependencies and correlations of plasma parameters with beam properties, however, can be obtained by a versatile set of diagnostics for both, plasma and beam.
At ELISE, several diagnostic ports are available for different types of plasma diagnostics [27]. Illustrated in Figure 6 are seven horizontal lines of sight close to the PG (≈2 cm axial distance) used by OES. Vertical diagnostic ports in the same axial distance to the PG are also available, but the corresponding LOS are not shown in the figure. Additionally, several ports in the driver backplates allow diagnosing the driver plasma. Four OES LOS through the axial center of the drivers are illustrated in Figure 6. The simultaneous application of plasma diagnostics at several ports allows statements on the plasma symmetry, lacking, however, on spatial resolution to derive statements on the plasma uniformity. Typically, the top-bottom symmetry is investigated because the vertical plasma drift causes mainly asymmetries in this direction [28].
The flexible OES system is the most frequently used plasma diagnostic tool at ELISE. It consists of several low-resolution survey spectrometers and one high-resolution Echelle spectrometer [27]. The lens head holders used for OES allow for slightly shifting the position of the LOS a few millimeters perpendicular to the LOS direction [27].
Valuable information on the plasma properties close to the PG is available from two RF-compensated Langmuir pin probes and one compensated movable probe, determining local values of the positive ion density, the plasma potential, and the electron temperature [29].
The tunable diode laser absorption spectroscopy (TDLAS) working at the wavelength of the resonant D2 caesium emission line at 852 nm gives line of sight averaged neutral caesium densities [30]. CRDS is applied for determining the line of sight averaged density of negative hydrogen ions [31].
Several diagnostics for the beam homogeneity are available at the beam side: the extracted ion current and the co-extracted electron current are measured as the current impinging all beamline components downstream the extraction grid and the extraction grid itself, respectively. A unique feature of ELISE is that separate current measurements are available for the top and bottom segment of the extraction grid, i.e., the vertical asymmetry of the co-extracted electron current can be determined [32].
Additional beam diagnostics used at ELISE are a tungsten-wire calorimeter, beam emission spectroscopy (BES), and a diagnostic calorimeter. The tungsten-wire calorimeter, located downstream at 1.8 m axial distance to the grounded grid and consisting of 100 horizontally and vertically drawn tungsten wires (⌀ = 0.2 mm), allows a quick and qualitative analysis of the beam footprint [33]. Beam emission spectroscopy, measuring spectroscopically the non-shifted and the Doppler-shifted Balmer-α emission from the beam along 16 horizontal and four vertical LOS, gives vertical and horizontal profiles of the beam divergence and of stripping losses within the extraction system [34]. The used spectroscopic system is intensity calibrated, enabling to deduce profiles of the Balmer-α emission from the beam, which is correlated to the beam density. Observing with an IR camera the 30 × 30 blocks of the diagnostic calorimeter, located 3.5 m downstream the extraction system, together with a calibration based on thermocouples embedded into 48 of the blocks, allows conducting a quantitative analysis of the beam homogeneity on a scale of several centimeters [34].
Modeling efforts, mainly by fluid codes, deepened the insights into the physics behind the vertical plasma drift. It is demonstrated that the drifts are driven by the interplay of the magnetic filter field with gradients of the electron temperature (diamagnetic drift, close to the exit of the RF drivers) and with electric fields (E × B drift, close to the PG) [35]. Simple transport codes as well as particle-in-cell (PIC) code modeling predict that also nonuniformities within the single extracted beamlets can occur [36, 37] (see also Beam Extraction and Formation.
Asymmetries in the plasma flow expanding from the driver towards the PG can affect the homogeneity and stability of the extracted negative ion beam via different mechanisms: the caesium flux impinging on the PG can be non-homogeneous, resulting—in particular during long pulses—in a local degradation of the PG surface work function [38]. Plasma asymmetries can affect also—via interaction of charged and neutral particles—the flux of atomic hydrogen towards the PG and thus the surface generation of negative ions. Additionally, asymmetries in the positive ion density close to the PG can limit the transport of the surface-produced negative ions towards the extraction apertures [39]. A local reduction of the negative ion density caused by these effects results in a reduced plasma electronegativity and thus in a locally increased electron density.
Asymmetries in the negative ion and electron densities in the plasma are directly linked to the beam properties, as illustrated by Figure 7: results obtained in hydrogen are shown, using the standard magnetic field setup of ELISE, i.e., the magnetic filter is created by IPG flowing from the bottom to the top of the PG, strengthened by external permanent magnets [40], and using a magnetic filter with reversed polarity.
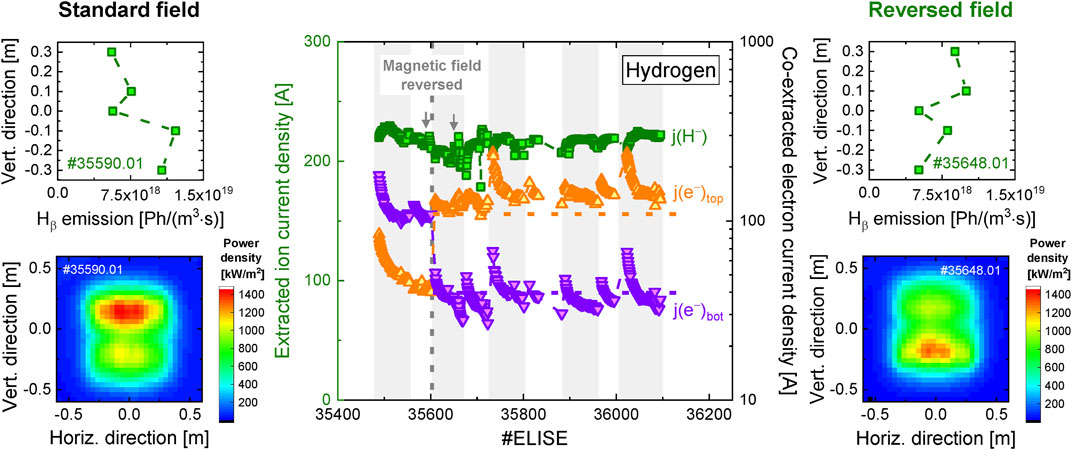
FIGURE 7. Center: extracted negative ion current density and co-extracted electron current density for the top and bottom segment of the extraction system measured before and after reversing the magnetic filter field at ELISE (based on [41]). Left and right: vertical profiles of the Balmer-β emission close to the PG, and beam footprints at the calorimeter recorded with an IR camera for both polarities of the magnetic filter.
The central part of the figure shows the extracted negative ion current density and the co-extracted electron current density for the top and bottom segment over the course of two operational days before reversing the filter field and 7 days afterwards. Each symbol represents the averaged result for one short pulse (20 s plasma-on time, 9.5 s beam time). The different operational days are distinguished by the white and grey background shading, respectively, and the reversal of the magnetic field by the vertical dashed line. The small figures show for one pulse with the standard filter polarity (on the left side) and for one pulse using the reversed filter (on the right side) a vertical OES profile of the Balmer-β emission close to the PG and the 2D profile of the beam power deposited at the calorimeter. The two respective pulses are marked by arrows in the central part of the figure. In the standard configuration (current from bottom to top), the net drift typically observed at the PG is directed upwards. A more intense Balmer-β emission is seen in the ion source bottom, while the accelerated beam is more intense in the top and turns round with reversing the polarity of the magnetic filter. The counterintuitive behavior can be explained by the fact that in the cold plasma (Te ≈1 eV), the Balmer-β emission can be caused by a multitude of mostly recombining excitation channels [24] and is thus not directly correlated to the negative ion density.
At the beginning of each operational day, a distinct caesium conditioning phase can be seen, i.e., a pulse-to-pulse reduction of the co-extracted electrons. The observed asymmetry in the co-extracted electrons is much stronger than the one observed for the plasma emission and the extracted negative ions. The reason behind this observation is that electrons are the minority species close to the meniscus in a strongly electronegative ion-ion plasma, reacting much more sensitive to small local changes in the caesium dynamics and the generation and transport of negative ions [19].
The vertical plasma emission profile as well as the extracted negative ion current and the co-extracted electron current are instantaneously flipped after reversing the magnetic filter, in accordance with the statement that the observed plasma and beam asymmetries are caused by plasma drifts.
The pulses shown in Figure 7 have been done at slightly reduced RF power (60 kW/driver compared to the maximum available power of 75 kW/driver) and in hydrogen. The asymmetry in the co-extracted electron current is acceptable, i.e., the power load onto both segments of the EG is still below its limit. However, this asymmetry drastically increases with the RF power or when changing the isotope from hydrogen to deuterium [42], and it can be a limiting factor for the source performance.
Two approaches are followed for extending the operational space by avoiding such limitations: symmetrizing the plasma itself by means of modifying the electric and magnetic fields within the ion source in order to reduce the plasma drifts or diminishing the effects of the asymmetric plasma, e.g., by evaporating caesium in a way that ensures also for an asymmetric plasma a homogeneous caesium flux on the PG that is sufficient to keep the surface work function low, i.e., by evaporating caesium in the direct vicinity of the PG [43].
Promising steps regarding the first approach have been done in the past years. One example is the addition of the potential rods close to the PG [44], i.e., water-cooled vertical plates made of nickel-coated copper installed in-between the groups of extraction apertures. The potential rods are set to the PG potential, i.e., they increase the biased area, and they cause a distinct reduction and stabilization of the co-extracted electrons as well as reduced asymmetries in the plasma and the co-extracted electrons [45]. The potential rods enabled to demonstrate that in hydrogen operation, the ITER requirements regarding the extracted negative ion current density and the beam homogeneity can be fulfilled during reproducible series of long pulses (1,200 s plasma-on time). These results are a significant step towards the operation of the ITER NBI system in hydrogen, i.e., during the first operational phase of ITER up to 2035 [20]. The addition of potential rods would, however, add a large complexity to the twice as large ITER NBI ion sources, and thus, further investigations on alternative methods, like biasing the bias plate and changing its position, are currently ongoing for symmetrizing the plasma.
The beam transport from the extraction system to the duct of the ITER torus imposes strong demands on the beam divergence and its uniformity. Optic optimization for big (meter scale) ion beams composed of hundreds of individual beamlets can only be done by magnetic correction on the level of individual beamlets or by electrostatic lenses, and thus only within the extraction and acceleration system. For this reason, the beam needs to fulfill its requirements already right behind the accelerator.
The divergence of individual beamlets is a result of several effects, among them the perpendicular velocity of negative ions, the shape and position of the plasma meniscus, and the beam shaping in the accelerator (caused by the electrostatic lenses from the grid system and magnetic field inside the accelerator). Valuable insight for designing and further optimizing the extraction and acceleration system is given by simulations. Particularly crucial are the formation of the plasma meniscus and the origin of extracted beam particles, for which the surface production of negative ions and their transport into and inside the plasma needs to be taken into account. For covering this aspect, 3D simulation codes resolving the plasma sheath are required. Among them is the ONIX code [46–48], which is a 3D particle-in-cell code using a self-consistent description of the plasma-wall interface in the presence of surface-emitted negative ions. Since 3D PIC codes resolving the plasma sheath are extraordinary computational demanding, only a small simulation domain can be used (one aperture, plasma a few mm upstream of the PG until the EG surface). For the design of acceleration systems, particle trajectory codes are widely used. Among them is IBSimu [49], a 3D particle trajectory code, which is self-consistently calculating the space charge and thus the electric field in the accelerator, while further B-fields can be taken into account.
A result of an ONIX simulation for the former BATMAN test facility is shown in Figure 8 [50]. Plotted is the negative hydrogen ion density for a vertical cross-section through one extraction aperture, axially starting 15 mm upstream of the PG surface until the EG surface. At the position of the plasma meniscus, a strong gradient in the H− density can be seen, caused by the acceleration of negative ions downstream of the meniscus. In addition, the ONIX results show the importance of directly extracted negative hydrogen ions (i.e., ions that do not traverse the plasma before being accelerated by the extraction potential) for the beam composition. The much simpler plasma models used in beam trajectory codes when simulating the whole extraction and acceleration cannot treat such particles. The directly extracted negative ions, however, have a higher perpendicular velocity to the beam direction and might produce for this reason a more divergent part of the beamlet, whereas negative ions extracted through the meniscus create a less divergent beamlet core. For further studying this topic, a direct combination of ONIX results with IBSimu (for simulating the beam downstream of the EG) is highly desirable and is in progress. An experimental proof of the relevance of directly extracted particles on the extracted beam, however, is still pending. Previous investigations of extraction of negative ions from an arc source demonstrated the presence of a halo [51], for which the production of negative ions at the backside of the plasma grid was discussed. For this reason, ITER specified the two components for the beamlet (a beamlet core and a halo) described above. In addition, a beamlet misalignment of 2 mrad in the horizontal and 4 mrad in the vertical direction is considered as a worst-case scenario that still meets the ITER requirements [2].
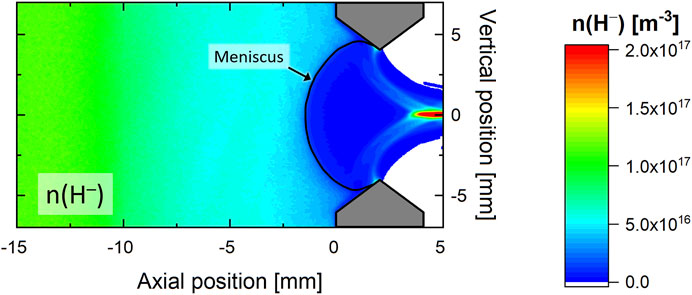
FIGURE 8. Negative hydrogen ion density for a vertical cross-section through one extraction aperture of the former BATMAN test facility. Simulation result from ONIX [50]. Used input parameters: hydrogen, extraction voltage 10 kV, 0.6 eV temperature of surface-produced negative ions.
The BUG facility is dedicated to, among others, investigations of beam properties of the beam from a beamlet group and a single aperture. Since its ion source has only 1/8 of the size of the ITER source, the focus of these investigations is mainly the beam divergence and less the beam homogeneity (effects on the beam homogeneity are investigated at ELISE, as discussed in Parameters Influencing the Uniformity). BUG is for this reason well equipped with beam diagnostics; among them is BES (see Parameters Influencing the Uniformity) and a calorimeter with Carbon Fibre Composite (CFC) tiles. CFC tile calorimetry uses a 1D-CFC tile on which the beam is shot, while its footprint is analyzed with an IR camera from the backside [52–54], a permanent one installed at BUG in 2020 [55]. Depending on the beamlet divergence and the distance of the CFC tile to the accelerator, it is possible or not to resolve the footprint of individual beamlets on the CFC. To enable single beamlet investigations at BUG for a wide range of beam properties, the top half of the PG is widely masked at BUG, isolating a single, individual beamlet [56].
The e-folding half-width divergence as a function of the applied acceleration voltage (at a fixed extraction voltage) for the single beamlet (measured by BES and CFC), as well as for the group of beamlets (measured by BES only), is shown in Figure 9. The measurement campaign was carried out in collaboration with Consorzio RFX, for which their mini-STRIKE CFC tile calorimeter has been temporarily installed at BUG [56–58]. Since the variation of the acceleration voltage changes the second lens of the extraction and acceleration system, a minimum of the divergence is expected at a certain voltage (depending on the design and distance of the grids in the accelerator). There have been two main findings for the comparison of the measured divergences [56]: 1) both diagnostics measure within the error bars the same divergence for the single beamlet and 2) the divergence for the group of beamlets is significantly higher as the one of the single beamlet.
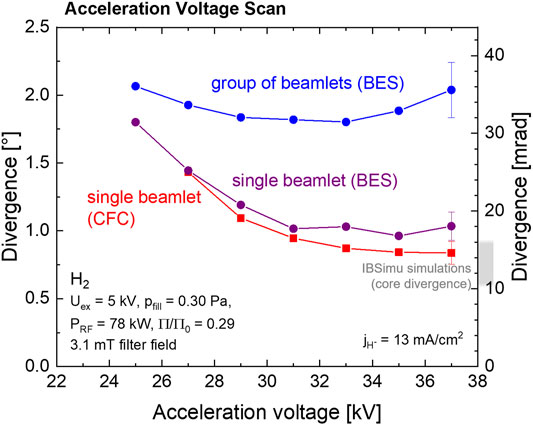
FIGURE 9. Horizontal divergence measured at BUG for a group of beamlets (using BES) and an isolated, single beamlet (using BES and the mini-STRIKE CFC tile calorimeter) as a function of the applied acceleration voltage [56]. The expected minimum of the core divergence predicted by IBSimu is indicated as well.
Regarding the divergence measured for the single beamlet using the CFC tile, one obtains a minimum between 14 and 16 mrad, which is above the 7 mrad required for ITER. The difference is partly attributed to the different grid geometry. Beam optic calculations using IBSimu for the BUG system at these parameters predict a core divergence of 11–16 mrad in the range of the applied acceleration voltage. A perpendicular temperature component of 1 eV is used for the negative ions, being a crucial parameter for the calculations but not known from experiments. The main parameter influencing the divergence is, however, the acceleration voltage, which is in this case up to 37 kV, whereas for ITER, up to 1 MeV is used such that the angle describing the divergence is decreased by accelerating the beamlet to high energies [59]. Open points are thus the energy of the negative ions and the contribution of the directly extracted ions, which are not taken into account in the IBSimu predictions. In addition, a pronounced pressure dependence of the divergence at otherwise same parameters is experimentally observed: the 14 mrad at 0.3 Pa decreases to about 11 mrad at 0.6 Pa; an effect not clarified up to now and hence not included in calculations up to now.
The larger divergence measured for the group of beamlets is explained as follows: the co-extracted electron suppression magnets in the EG create a mainly vertical B-field, which changes polarity from one horizontal row to the next. This magnetic field leads to a horizontal deflection of every beamlet (also seen in Figure 8, where the beam at the grounded grid is not horizontally centered); this horizontal deflection changes its direction from one beamlet row to the next. Since several rows of beamlets contribute to the Doppler-shifted light measured at the respective BES LOS [56], the effectively measured beam divergence for the group of beamlets is significantly higher. For the ITER NBI, a magnetic compensation of the row-wise zigzag deflection is foreseen [60, 61]; a similar compensation is also planned at the BUG test facility in collaboration with the ITER Organization for the near future.
The operation of negative hydrogen ion sources in deuterium is significantly more demanding than in hydrogen because for comparable source parameters (i.e., RF power, extraction voltage, filling pressure, strength and topology of the magnetic filter, ...) the co-extracted electron current is typically much higher, shows a higher asymmetry, and its increase during pulses is much more pronounced [42]. An isotope effect is also observed in the extracted negative ion current, but less pronounced: in deuterium, the extracted negative ions are reduced only by a few percent compared to hydrogen, and they show a slightly more pronounced decrease with time. Due to the stronger asymmetries in the co-extracted electrons in deuterium, the demonstration of the ITER requirements is not possible up to now in deuterium: about 66% of the ITER target for the extracted negative ion current density in deuterium has been achieved at ELISE over 1 h [42].
The physics behind the isotope effect is investigated by switching within one operational day of ELISE the operational gas from hydrogen to deuterium for otherwise unchanged source parameters (PRF = 50 kW/driver, filter field strength ≈2.7 mT close to the PG, extraction voltage = 7 kV, filling pressure = 0.3 Pa). Figure 10A shows pulse-averaged values of the extracted negative ion current density j(H−) or j(D−) and the co-extracted electron current density j(e−). The vertical dashed line illustrates the time when the isotope was switched. While the extracted negative ion current density does only weakly depend on the isotope, j(e−) increases by a factor of about 6 (first pulse in D2) up to about 9 (second and subsequent pulses). It can be stabilized only by prolonging the break between two pulses from 5 to 17 min, which leads to an increase of the Cs fluence, i.e., the caesium amount evaporated into the source between the pulses.
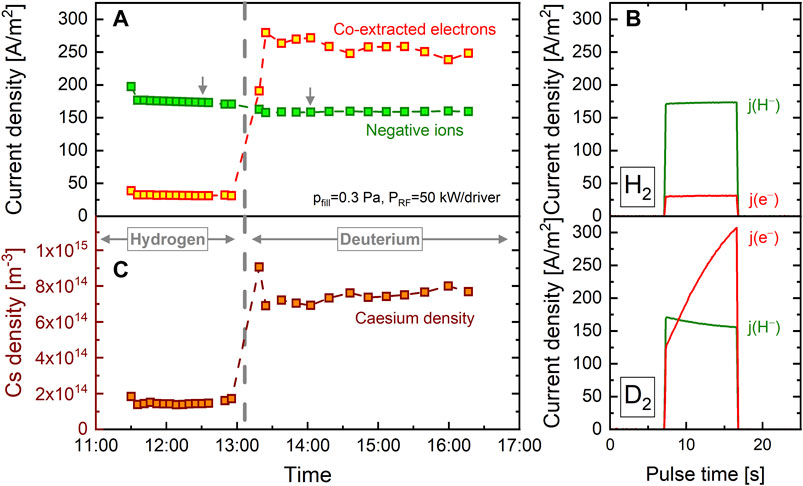
FIGURE 10. Signals taken during one operational day when switching from H2 to D2 for identical source parameters. (A) Extracted negative ion current and co-extracted electron current. (B) Time traces of the negative ion current density and the co-extracted electron current density in hydrogen and deuterium. (C) Density of neutral Cs particles close to the plasma grid surface evaluated by TDLAS.
Time traces for a typical hydrogen pulse are shown in the top of Figure 10B, and for a deuterium pulse in the bottom (the two pulses are marked by arrows in Figure 10A). While in hydrogen j(H−) and j(e−) show no temporal dependence in deuterium j(D–) decreases by ≈10% during the 9.5 s of the extraction blip and j(e−) increases by a factor of about 2.5. Increasing the negative ion current density by increasing the RF power steepens the increase of j(e−) and increases its asymmetry. Thus, compared to hydrogen, the operational space in deuterium is significantly reduced and defined by the power limit of the extraction grid. Hence, typically, a significantly stronger filter field strength is used in deuterium [42]: up to 4.6 mT close to the PG compared to up to 3 mT in hydrogen.
In Figure 10C, the line of sight averaged neutral caesium densities measured by TDLAS close to the plasma grid are shown for the pulses in hydrogen and deuterium (note that a substantial fraction of caesium is ionized during plasma operation due to its low ionization threshold). A strong increase in the neutral caesium density is observed directly after switching to deuterium. For the second and subsequent pulses in deuterium, a slightly lower neutral caesium density is observed compared to the first one. Surface ionization detectors close to the oven nozzles [62] demonstrate that the caesium flux evaporated from the ovens is not affected by changing the isotope. Thus, the observations made indicate a strong impact of the used isotope on the caesium redistribution inside the ion source. In deuterium, the caesium reservoirs at the source walls and at the PG itself are more rapidly depleted than in hydrogen, and the caesium flux impinging on the PG is not sufficient to keep the surface work function at a low value during the pulses. The increase of the caesium flux evaporated from the ovens during deuterium operation in order to increase the caesium flux onto the PG is limited by an increased risk of high voltage breakdowns in the extraction system.
Caesium management in terms of optimizing consumption and understanding the redistribution dynamics during plasma operation with the two hydrogen isotopes is one of the most urgent and demanding tasks. An in situ and on-line work function measurement of the PG surface would be desirable for the optimization of the caesium management, but the installation of such a monitoring system is challenging in the harsh environment of ion source operation and is thus not established up to now. Therefore, dedicated studies are performed at the small-scale laboratory experiment ACCesS [38, 63] in order to gain insights into the caesium work function dynamics under ion source conditions. At ACCesS, caesium is evaporated with the same caesium oven as used for the ion sources under vacuum conditions of ∼10−6 mbar onto a sample of the PG material (polycrystalline Mo layer on Cu). Hydrogen (or deuterium) plasmas are ignited via inductive RF coupling such that the plasma parameters are comparable to those close to the PG of the ion sources. The work function of the Mo surface is measured photoelectrically using an enhanced work function measurement setup, which is presented in detail elsewhere [64], and the neutral caesium density is continuously monitored by means of a TDLAS system along a line of sight parallel to and close to the sample surface.
Figure 11 shows an example of the temporal behavior of the measured surface work function during a caesium re-conditioning campaign at ACCesS. The Mo surface was caesiated in a preceding campaign and left in vacuum for some days, leading to a degraded caesium layer with an initial work function of about 3 eV [65]. This work function is already substantially lower than the 4.3 eV measured after hydrogen plasma exposure without caesium. As soon as fresh caesium is evaporated in the vacuum phase at room temperature, the work function starts to decrease and reaches a value of about 2 eV [64] with typical neutral caesium densities in the range of 1014–1015 m−3 [19, 66]. After the built-up of a fresh caesium multi-layer under the given moderate vacuum conditions, H2 gas is fed into the experiment. As can be measured with a residual gas analyzer attached to the chamber, the first H2 gas inlet after an operational break of some days is accompanied by a substantial amount of impurity gases (mainly N2, O2, and H2O), which have been accumulated in the gas line and are pumped out after some minutes. The release of the impurity gases leads to an instant drop of the measured neutral caesium density below the TDLAS detection limit of about 2×10¹³ m−3 and to an increase of the work function to slightly above 3 eV. This demonstrates the high sensitivity of the caesium evaporation and the vulnerability of the surface work function due to the high chemical reactivity of caesium. The deteriorated surface work function recovers, however, quickly by the application of H2 plasma pulses and reaches a stable plateau of 1.75 ± 0.10 eV after a few 5 s plasma pulses. Hence, the plasma-surface interaction is an efficient way to condition the fresh caesium coating. The beneficial impact of the plasma pulses on the caesium work function explains the strong enhancement of the ion source performance during the conditioning phases, which are required after operational breaks for optimizing the extracted ion and co-extracted electron currents [67, 68]. Furthermore, the continuous monitoring of the neutral caesium density via TDLAS shows that a strong caesium redistribution is driven during the discharges and the caesium content during the vacuum phases gradually recovers. It reaches nearly the same level as before the first gas inlet after about half an hour in the present case (without changing the settings of the caesium oven).
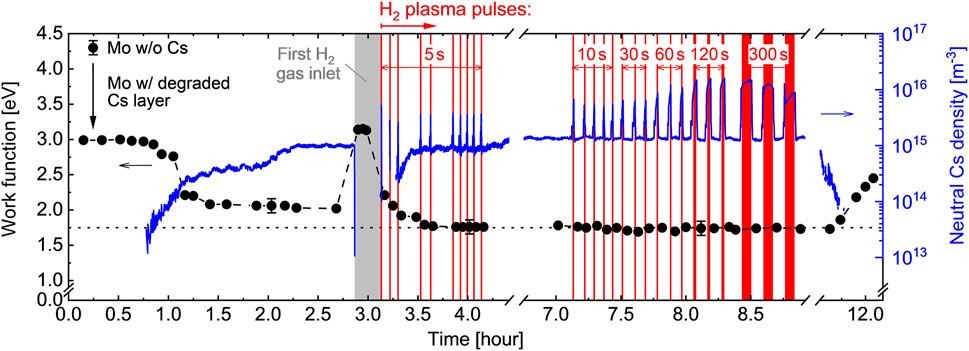
FIGURE 11. Temporal development of the surface work function during a caesium re-conditioning scenario applied at ACCesS: a degraded caesiated Mo surface is re-caesiated and exposed to a sequence of hydrogen plasma pulses with variable length. The neutral caesium density is measured via TDLAS, the plasma-on time is indicated by the red shaded areas (10 Pa gas pressure and 250 W RF power applied).
As can be seen in Figure 11, the low surface work function can be maintained during prolonged vacuum phases and additionally kept after plasma exposure, since the caesium flux in the vacuum phases is sustained (∼9×10¹⁶ m−2s−1). Moreover, the prolonged plasma phases up to several minutes lead to an enhanced caesium release and redistribution, and to a steady improvement of the photoelectric quantum efficiency of the surface. When the caesium evaporation from the oven is stopped, however, the work function gradually increases in the vacuum phase. The degradation depends on the vacuum conditions and is on the order of 1 eV/h. By the application of continuous plasma pulses without active caesium evaporation, the low work function passivation is slowed down [38], depending on the caesium reservoirs in the source which are gradually depleted by the plasma recycling. These examples demonstrate the challenge to maintain a spatially and temporally stable low work function of the PG surface in the ion sources, especially during long-pulse operation, which critically determines the co-extracted electrons and thus the source performance limits. Since the temporal caesium dynamics are much more challenging in deuterium than in hydrogen [42, 69], stabilizing the PG surface work function seems to be mandatory for demonstrating the ITER requirements in deuterium. Consequently, efforts are needed to provide a sufficient caesium flux onto the PG, and one candidate would be the already mentioned caesium evaporation in the direct vicinity of the PG [43].
Besides providing an intense, stable, and homogeneous negative ion beam, a second aim during long pulses is to keep the co-extracted electron current below the ITER requirement of j(e−)/j(H−) <1. Moreover, the power load onto the EG segments needs to be below their limits. At the NBTF and in the ITER NBI beamline, only limited or no diagnostics are available for non-homogeneities in the co-extracted electron current. In order to avoid local EG overheating, it is thus desirable to develop operational scenarios such that the co-extracted electron current is on the global scale intrinsically homogeneous (see also discussion in Parameters Influencing the Uniformity).
As mentioned earlier, the current high power supply at ELISE allows short beam extraction phases roughly every 3 min from steady-state plasma operation. During such pulses, an increase in the co-extracted electron current as well as in the asymmetry of the co-extracted electrons is typically observed from one extraction blip to the next. These effects are particularly pronounced for operation in deuterium and for high RF power and are illustrated in Figure 12A for a 700 s deuterium pulse (PRF = 62.5 kW/driver, filter field strength ≈4.6 mT, extraction voltage = 10 kV, filling pressure = 0.3 Pa) with five extraction blips. Typically, the length of long pulses or the achievable source performance is limited by the increase of the co-extracted electrons.
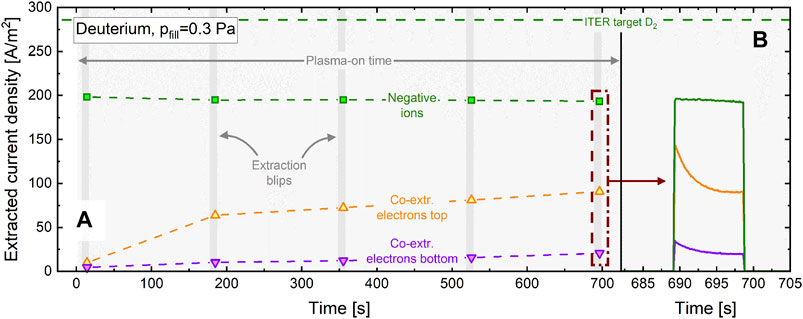
FIGURE 12. Current densities of extracted negative ions and co-extracted electrons for the top and bottom segment during a 700 s pulse in deuterium. (A) Averaged values for the five extraction blips. (B) Time traces measured during the very last extraction blip.
One very successfully applied measure for stabilizing the co-extracted electrons is caesium over-conditioning, i.e., increasing the caesium evaporation and thus the caesium density in the ion source above the optimum for short pluses (defined by a decrease of the negative ions with increasing caesium in the source). In hydrogen, over-conditioning enabled series of ITER-relevant long pulses [20] and is reached for a neutral caesium density (measured by TDLAS) significantly larger than about 1014 m−3 [45]. At the beginning of long pulses, caesium is re-distributed on a time scale of several hundred seconds in a way that results in a distinct stabilization of the co-extracted electrons compared to pulses without over-conditioning and can result in an extremely stable negative ion current. Reaching the over-conditioning status in deuterium is much more difficult, although in general, higher neutral caesium densities are present in the plasma than in hydrogen. Further increasing the neutral caesium density is correlated with increasing the risk for a premature termination of pulses caused by arcing in the extraction system. The deuterium pulse shown in Figure 12 is done without over-conditioning.
In Figure 12B, time traces of the extracted ion current density and the co-extracted electron current density are shown for the last extraction blip of the pulse shown in Figure 12A. During the 9.5 s of the extraction blip, a slight decrease of the extracted negative ion current density and a significant decrease of the co-extracted electron current density can be seen. This temporal behavior does not seem to fit the observed blip to blip behavior. The mismatch is explained by different caesium dynamics during the source plasma phase when compared to the beam phase: in between the extraction blips, caesium deposited by the plasma creates reservoirs at the backplate. When the extraction is switched on, positive ions that are created in the extraction system by the interaction of the beam with the background gas are accelerated back into the ion source. These back-streaming positive ions deplete the caesium reservoirs, resulting in the observed improvement of the caesium conditioning status. These observations of the complex caesium dynamics by measuring the neutral Cs density along a line of sight close to the PG are very supportive for the operation of the ion source; a direct quantity for the temporal dynamics of the Cs layer would, however, be the surface work function (ideally spatially resolved) of the PG. Bringing such a diagnostic setup into operation at these ion sources with its harsh environment is a very challenging task and has not been achieved yet.
In order to investigate the Cs dynamics for the ITER scenario, i.e., plasma with steady-state extraction in a large source, ELISE is currently upgraded with a CW power supply. The power supply is delivered and installed, and commissioning at the experiment will start in the first half of 2021.
ITER’s neutral beam injection system requires large and powerful ion sources for negative hydrogen (and deuterium). They are based on inductive RF coupling using a modular concept for plasma generation to illuminate the plasma grid surface (of about 1 m × 2 m for the ITER sources). Effective RF coupling at the used frequency of 1 MHz and power levels of up to 800 kW for a source pressure of 0.3 Pa is a challenging task. At present, the measured RF power transfer efficiencies are in the range of 55–60%, which reveals a high optimization potential. Increasing the RF power transfer efficiency would relax the demands on the generators and the RF circuit, reducing the probability of RF breakdowns, which is for example currently an issue at the SPIDER test bed of the NBTF [13].
The magnetic filter field causes plasma drifts in vertical direction, influencing strongly the homogeneity of the particle fluxes of electrons onto the plasma grid. Thus, the co-extracted electron current measured at the two grid segments of the half-size ITER source ELISE reveals a strong asymmetry that can be partly counteracted by biasing additional surfaces in the source. Such asymmetries might bear a risk for the ITER sources with their four grid segments as only the total co-extracted electron current is monitored on a fast time scale. Consequently, measures to reduce the co-extracted electrons are driving the current research.
Although the ITER source parameters have been met for hydrogen, the values for deuterium could not be demonstrated yet, because the co-extracted electron current is much larger, much more unstable, and vertically much more asymmetric than in hydrogen. The RF power and the extraction voltage have to be reduced, such that the electrons hit the extraction grid with the tolerable heat load, and limit the achievable ion source performance with respect to the negative ion current density. Although the generation of negative ions is sensitive to the caesium and thus the work function on the grid surface, the electrons reveal a very pronounced and dynamic behavior. This is addressed to the fact that the electrons are a minority species in the plasma in front of the grid, where an ion-ion plasma is present at optimum source performance such that small changes have a huge impact. It was demonstrated that negative ion densities close to 1017 m−3 upstream of the plasma grid are required to extract about 300 A/m2 negative hydrogen ions at 0.3 Pa (ITER target: 329 A/m2). For such parameters, the electronegativity is above one, and the ratio of co-extracted electrons to ions is well below one. Plasma and beam diagnostics are indispensable to support the source developments and are accompanied by modeling activities.
Beam diagnostics of such large beams composed of several hundreds of beamlets is not straightforward as demonstrated in a dedicated investigation of a group of beamlets simultaneously with a single beamlet by masking the grid. For the reduced acceleration voltage used at the test facilities, single beamlet divergences of 14–16 mrad are measured with about 32 mrad for the group of beamlets caused by the non-compensated zigzag deflection of the ions by the electron deflection magnets in the extraction grid. Compensation of the latter is implemented in the ITER sources and will be investigated at the BUG test facility in collaboration with ITER. The divergence of the single beamlet is in reasonable agreement with predictions of beam optics calculations using a perpendicular temperature of negative ions of 1 eV. The difference to the ITER value of 7 mrad is mainly attributed to the much lower accelerator voltage, decreasing the angle of the particles with higher energies. Contributions of directly extracted ions and the measured pressure dependence of the divergence are the subject of further studies.
Insights into the extraction of negative ions from one chamfered aperture by using a 3D PIC code revealed asymmetries of the electrons in front of the meniscus to the deflection magnets embedded in the extraction grid influencing also the negative ion beam. On the global scale, asymmetries can evolve mostly due to the magnetic filter field, the additional bias of surfaces, and the caesium distribution.
Promising measures are in preparation with focus on operation in deuterium to meet the ITER requirements in terms of source parameters and beam uniformity at ELISE accompanied by beam optics studies at BUG to pave the way towards reliable sources for the ITER NBI. Among them is the biasing of surfaces adopted to the change of parameters in vertical direction, i.e., segment-wise. The test facility SPIDER, operating since 2018, gives already valuable insights into the operation of such a large source enclosed in a vacuum vessel. Adding caesium is the next step, and lessons learned will be of uttermost relevance for the operation of MITICA, the prototype HNB for ITER. Currently, high voltage tests for the 1 MeV are ongoing at MITICA; first plasma experiments are scheduled for 2023; beam extraction is foreseen in 2024 [70]. The valuable experience gained at MITICA is essential for the ITER HNB, for which commissioning at ITER is foreseen in 2030. In view of a DEMOnstration power plant (DEMO), NBI heating is one of the options for heating and current drive. The return of experience from ITER and the connected R&D serve as one of the cornerstones for any concrete design.
UF, SB, CW, and DW contributed to conception and design. UF compiled the first draft of the manuscript. UF, SB, AH, CW, and DW wrote sections of the manuscript. All authors contributed to manuscript revision, read, and approved the submitted version.
This work has been carried out within the framework of the EUROfusion Consortium and has received funding from the Euratom research and training programme 2014–2018 and 2019–2020 under grant agreement No 633053. The views and opinions expressed herein do not necessarily reflect those of the European Commission.
The authors declare that the research was conducted in the absence of any commercial or financial relationships that could be construed as a potential conflict of interest.
All claims expressed in this article are solely those of the authors and do not necessarily represent those of their affiliated organizations, or those of the publisher, the editors and the reviewers. Any product that may be evaluated in this article, or claim that may be made by its manufacturer, is not guaranteed or endorsed by the publisher.
The authors would explicitly like to thank all members of the team working at and for the test facilities at IPP. In particular we would like to thank Niek den Harder and Andrew Hurlbatt for the valuable discussions on beam optics, Isabella Mario for providing data on reversed magnetic field configuration, and Alessandro Mimo for providing the data of the CRDS measurements.
1.ITER. [Online]. Available from: www.iter.org (Accessed April 15, 2021).
2. Hemsworth RS, Boilson D, Blatchford P, Palma MD, Chitarin G, de Esch HPL, et al. Overview of the design of the ITER heating neutral beam injectors. New J Phys (2017) 19:025005. doi:10.1088/1367-2630/19/2/025005
3. Chakraborty A, Rotti C, Bandyopadhyay M, Singh MJ, Gangadharan Nair R, Shah S, et al. Diagnostic Neutral Beam for ITER-Concept to Engineering. IEEE Trans Plasma Sci (2010) 38:248–53. doi:10.1109/tps.2009.2035809
4.ITER EDA Documentation Series No. 24. In: ITER Technical Basis. Vienna: International Atomic Energy Agency (2002).
5. Ikeda Y, Umeda N, Akino N, Ebisawa N, Grisham L, Hanada M, et al. Present status of the negative ion based NBI system for long pulse operation on JT-60U. Nucl Fusion (2006) 46:S211–S219. doi:10.1088/0029-5515/46/6/s02
6. Hanada M, Kojima A, Inoue T, Watanabe K, Taniguchi M, Kashiwagi M, et al. Development of the JT‐60SA Neutral Beam Injectors. AIP Conf Proc (2011) 1390:536.
7. Takeiri Y, Kaneko O, Tsumori K, Oka Y, Ikeda K, Osakabe M, et al. High-Power and Long-Pulse Injection with Negative-Ion-Based Neutral Beam Injectors in the Large Helical Device. Nucl Fusion (2006) 46:S199–S210. doi:10.1088/0029-5515/46/6/s01
8. Kojima A, Hiratsuka J, Umeda N, Hanada M, Kashiwagi M, Yoshida M, et al. Development of Long-Pulse High-Power-Density Negative Ion Beams with a Multi-Aperture Multi-Grid Accelerator. Fusion Eng. Des. (2017) 123:236–40. doi:10.1016/j.fusengdes.2017.01.060
9. Speth E, Falter HD, Franzen P, Fantz U, Bandyopadhyay M, Christ S, et al. Overview of the RF Source Development Programme at IPP Garching. Nucl Fusion (2006) 46:S220–S238. doi:10.1088/0029-5515/46/6/s03
10. Masiello A, Agarici G, Bonicelli T, Simon M, Alonso J, Bigi M, et al. The European Contribution to the Development of the ITER NB Injector. Fusion Eng. Des. (2011) 86:860–3. doi:10.1016/j.fusengdes.2011.03.035
11. Toigo V, Piovan R, Dal Bello S., Gaio E, Luchetta A, Pasqualotto R, et al. The PRIMA Test Facility: SPIDER and MITICA test-beds for ITER neutral beam injectors. New J Phys (2017) 19:085004. doi:10.1088/1367-2630/aa78e8
12. Toigo V, Marcuzzi D, Serianni G, Boldrin M, Chitarin G, Bello SD, et al. On the road to ITER NBIs: SPIDER improvement after first operation and MITICA construction progress. Fusion Eng. Des. (2021) 168:112622. doi:10.1016/j.fusengdes.2021.112622
13. Serianni G, Toigo V, Bigi M, Boldrin M, Chitarin G, Dal Bello S, et al. First Operation in SPIDER and the Path to Complete MITICA. Rev Sci Instrum (2020) 91:023510. doi:10.1063/1.5133076
14. Boldrin M, Valente M, Dal Bello S, Grando L, Toigo V, Zaccaria P, et al. 1 MV Power Supplies Integration Issues in MITICA Experiment, the ITER Heating Neutral Beam Injector Prototype. Fusion Eng. Des. (2021) 164:112170. doi:10.1016/j.fusengdes.2020.112170
15. Singh MJ, Chakraborty AK, Bandyopadhyay M, Joshi J, Patel H, Pandya K, et al. R&D Status of the Indian Test Facility for ITER Diagnostic Neutral Beam Characterization. Nucl Fusion (2019) 59:096034. doi:10.1088/1741-4326/ab1ff8
16. Fantz U, Bonomo F, Fröschle M, Heinemann B, Hurlbatt A, Kraus W, et al. Advanced NBI Beam Characterization Capabilities at the Recently Improved Test Facility BATMAN Upgrade. Fusion Eng Des (2019) 146:212–5. doi:10.1016/j.fusengdes.2018.12.020
17. Kraus W, Fantz U, Franzen P. Long Pulse H− Beam Extraction with a RF Driven Ion Source on a High Power Level. Rev Sci Instrum (2010) 81:02B110. doi:10.1063/1.3273065
18. Franzen P, Falter H, Heinemann B, Martens C, Fantz U, Berger M, et al. RADI-A RF Source Size-Scaling Experiment Towards the ITER Neutral Beam Negative Ion Source. Fusion Eng. Des. (2007) 82:407–23. doi:10.1016/j.fusengdes.2007.03.041
19. Heinemann B, Fantz U, Kraus W, Schiesko L, Wimmer C, Wünderlich D, et al. Towards large and powerful radio frequency driven negative ion sources for fusion. New J Phys (2017) 19:015001. doi:10.1088/1367-2630/aa520c
20. Wünderlich D, Riedl R, Bonomo F, Mario I, Fantz U, Heinemann B, et al. Achievement of ITER-Relevant Accelerated Negative Hydrogen Ion Current Densities Over 1000 s at the ELISE Test Facility. Nucl Fusion (2019) 59:084001. doi:10.1088/1741-4326/ab246c
21. Kraus W, Fantz U, Heinemann B, Franzen P. Solid State Generator for Powerful Radio Frequency Ion Sources in Neutral Beam Injection Systems. Fusion Eng. Des. (2015) 91:16–20. doi:10.1016/j.fusengdes.2014.11.015
22. Zielke D, Briefi S, Fantz U. RF Power Transfer Efficiency and Plasma Parameters of Low Pressure High Power ICPs. J Phys D: Appl Phys (2021) 54:155202. doi:10.1088/1361-6463/abd8ee
23. Briefi S, Fantz U, Team N. Spectroscopic Investigations of the Ion Source at BATMAN Upgrade. Sixth International Symposium on Negative Ions, Beams and Sources (NIBS 2018). AIP Conf Proc (2018) 2052:040005.
24. Wünderlich D, Fantz U. Evaluation of State-Resolved Reaction Probabilities and Their Application in Population Models for He, H, and H2. Atoms (2016) 4:26. doi:10.3390/atoms4040026
25. Briefi S, Fantz U. A Revised Comprehensive Approach for Determining the H2 and D2 Rovibrational Population from the Fulcher-α Emission in Low Temperature Plasmas. Plasma Sourc Sci Technol (2020) 29:125019. doi:10.1088/1361-6595/abc085
26. Berger M, Fantz U, Christ-Koch S, Team NNBI. Cavity Ring-Down Spectroscopy on a High Power RF Driven Source for Negative Hydrogen Ions. Plasma Sourc Sci Technol (2009) 18:025004. doi:10.1088/0963-0252/18/2/025004
27. Wünderlich D, Fantz U, Franzen P, Riedl R, Bonomo F. Optical Emission Spectroscopy at the Large RF Driven Negative Ion Test Facility ELISE: Instrumental Setup and First Results. Rev Sci Instrum (2013) 84:093102. doi:10.1063/1.4820806
28. Fantz U, Schiesko L, Wünderlich D. Plasma Expansion Across a Transverse Magnetic Field in a Negative Hydrogen Ion Source for Fusion. Plasma Sourc Sci. Technol. (2014) 23:044002. doi:10.1088/0963-0252/23/4/044002
29. Schiesko L, Wimmer C, Fantz U. Langmuir Probe Investigations of Different Magnetic Filter Field Configurations at BATMAN Upgrade. AIP Conf Proc (2018) 2052:040006. doi:10.1063/1.5083740
30. Wimmer C, Lindauer M, Fantz U. Determination of the Cs Distribution Along a Line of Sight by the Zeeman Splitting in an Inhomogeneous Magnetic Field. J Phys D: Appl Phys (2018) 51:395203. doi:10.1088/1361-6463/aad93d
31. Mimo A, Nakano H, Wimmer C, Wünderlich D, Fantz U, Tsumori K. Cavity Ring-Down Spectroscopy System for the Evaluation of Negative Hydrogen Ion Density at the ELISE Test Facility. Rev Sci Instrum (2020) 91:013510. doi:10.1063/1.5129341
32. Franzen P, Heinemann B, Fantz U, Wünderlich D, Kraus W, Fröschle M, et al. Commissioning and First Results of the ITER-Relevant Negative Ion Beam Test Facility ELISE. Fusion Eng. Des. (2013) 88:3132–40. doi:10.1016/j.fusengdes.2013.09.006
33. Nocentini R, Fantz U, Franzen P, Froeschle M, Heinemann B, Riedl R, et al. Beam Diagnostic Tools for the Negative Hydrogen Ion Source Test Facility ELISE. Fusion Eng. Des. (2013) 88:913–7. doi:10.1016/j.fusengdes.2013.01.031
34. Mario I, Bonomo F, Wünderlich D, Fantz U, Nocentini R. Reconstruction of the Large Multi-Aperture Beam via IR Calorimetry Technique and Beam Emission Spectroscopy at the ELISE Test Facility. Nucl Fusion (2020) 60:066025. doi:10.1088/1741-4326/ab8573
35. Lishev S, Schiesko L, Wünderlich D, Wimmer C, Fantz U. Fluid-Model Analysis on Discharge Structuring in the RF-Driven Prototype Ion-Source for ITER NBI. Plasma Sourc Sci Technol (2018) 27:125008. doi:10.1088/1361-6595/aaf536
36. Taccogna F, Minelli P. PIC Modeling of Negative Ion Sources for Fusion. New J Phys (2017) 19:015012. doi:10.1088/1367-2630/aa5305
37. Gutser R, Wünderlich D, Fantz U. Negative Hydrogen Ion Transport in RF-Driven Ion Sources for ITER NBI. Plasma Phys Control Fusion (2009) 51:045005. doi:10.1088/0741-3335/51/4/045005
38. Cristofaro S, Friedl R, Fantz U. Correlation of Cs Flux and Work Function of a Converter Surface During Long Plasma Exposure for Negative Ion Sources in View of ITER. Plasma Res Express (2020) 2:035009. doi:10.1088/2516-1067/abae81
39. Wünderlich D, Gutser R, Fantz U. PIC Code for the Plasma Sheath in Large Caesiated RF Sources for Negative Hydrogen Ions. Plasma Sourc Sci Technol (2009) 18:045031. doi:10.1088/0963-0252/18/4/045031
40. Wünderlich D, Kraus W, Fröschle M, Riedl R, Fantz U, Heinemann B. Influence of the Magnetic Field Topology on the Performance of the Large Area Negative Hydrogen Ion Source Test Facility ELISE. Plasma Phys Control Fusion (2016) 58:125005. doi:10.1088/0741-3335/58/12/125005
41. Mario I. Correlation Between Plasma and Beam Properties at the ELISE Test Facility. [PhD thesis]. Germany: Universität Augsburg (2020).
42. Wünderlich D, Riedl R, Mario I, Mimo A, Fantz U, Heinemann B, et al. Formation of Large Negative Deuterium Ion Beams at ELISE. Rev Sci Instrum (2019) 90:113304. doi:10.1063/1.5127832
43. Mimo A, Wimmer C, Wünderlich D, Fantz U. Studies of the Cs Dynamics in Large Ion Sources Using the CsFlow3D Code. AIP Conf Proc (2018) 2052:040009. doi:10.1063/1.5083743
44. Heinemann B, Fantz U, Kraus W, Wünderlich D, Bonomo F, Froeschle M, et al. Latest Achievements of the Negative Ion Beam Test Facility ELISE. Fusion Eng. Des. (2018) 136:569–74. doi:10.1016/j.fusengdes.2018.03.025
45. Wünderlich D, Riedl R, Bonomo F, Mario I, Fantz U, Heinemann B, et al. Long Pulse Operation at ELISE: Approaching the ITER Parameters. AIP Conf Proc (2018) 2052:040001.
46. Mochalskyy S, Lifschitz AF, Minea T. 3D Modelling of Negative Ion Extraction from a Negative Ion Source. Nucl Fusion (2010) 50:105011. doi:10.1088/0029-5515/50/10/105011
47. Mochalskyy S, Fantz U, Wünderlich D, Minea T. Comparison of ONIX Simulation Results With Experimental Data from the BATMAN Testbed for the Study of Negative Ion Extraction. Nucl Fusion (2016) 56:106025. doi:10.1088/0029-5515/56/10/106025
48. Montellano I, Wünderlich D, Mochalskyy S, Fantz U. 3D-PIC Modelling of a Low Temperature Plasma Sheath with Wall Emission of Negative Particles and its Application to NBI Sources. J Phys D: Appl Phys (2019) 52:235202. doi:10.1088/1361-6463/ab0f44
49. Kalvas T, Tarvainen O, Ropponen T, Steczkiewicz O, Ärje J, Clark H, et al. IBSIMU: A Three-Dimensional Simulation Software for Charged Particle Optics. Rev Sci Instrum (2010) 81:02B703. doi:10.1063/1.3258608
50. Wünderlich D, Mochalskyy S, Montellano IM, Revel A. Review of Particle-in-Cell Modeling for the Extraction Region of Large Negative Hydrogen Ion Sources for Fusion. Rev Sci Instrum (2018) 89:052001. doi:10.1063/1.5011799
51. de Esch HPL, Svensson L. Negative Ion Beam Halo Mitigation at the 1MV Testbed at IRFM. Fusion Eng. Des. (2011) 86:363–8. doi:10.1016/j.fusengdes.2011.02.098
52. Tsumori K, Osakabe M, Takeiri Y, Kaneko O, Nagaoka K, Ikeda K, et al. Beamlet Characteristics in the Accelerator With Multislot Grounded Grid. Rev Sci Instrum (2010) 81:02B117. doi:10.1063/1.3298844
53. Chitarin G, Kojima A, Agostinetti P, Aprile D, Baltador C, Hiratsuka J, et al. Experimental Validation of an Innovative Deflection Compensation Method in a Multi-Beamlet Negative-Ion Accelerator. AIP Conf Proc (2017) 1869:030026. doi:10.1063/1.4995746
54. Rizzolo A, Dalla Palma M, De Muri M, Serianni G. Design and Analyses of a One-Dimensional CFC Calorimeter for SPIDER Beam Characterisation. Fusion Eng. Des. (2010) 85:2268–73. doi:10.1016/j.fusengdes.2010.09.003
55. Orozco G, Bonomo F, den Harder N, Heinemann B, Hurlbatt A, Nocentini R, et al. Design and First Results of a Retractable 1D-CFC Beam Target for BATMAN Upgrade. Fusion Eng. Des. (2021) 165:112225. doi:10.1016/j.fusengdes.2021.112225
56. Hurlbatt A, Bonomo F, Pimazzoni A, Veltri P, Agostini M, Barbisan M, et al. First Direct Comparison of Whole Beam and Single Beamlet Divergences in a Negative Ion Source With Simultaneous BES and CFC Tile Calorimetry Measurements. AIP Adv (2021) 11:025330. doi:10.1063/5.0039080
57. Serianni G, De Muri M, Muraro A, Veltri P, Bonomo F, Chitarin G, et al. First Negative Ion Beam Measurement by the Short-Time Retractable Instrumented Kalorimeter Experiment (STRIKE). Rev Sci Instrum (2014) 85:02A736. doi:10.1063/1.4861391
58. Serianni G, Bonomo F, Brombin M, Cervaro V, Chitarin G, Cristofaro S, et al. Negative Ion Beam Characterisation in BATMAN by Mini-STRIKE: Improved Design and New Measurements. AIP Conf Proc (2015) 1655:060007.
60. Chitarin G, Agostinetti P, Aprile D, Marconato N. Cancellation of the Ion Deflection Due to Electron-Suppression Magnetic Field in a Negative-Ion Accelerator. Rev Sci Instrum (2014) 85:02B317. doi:10.1063/1.4826581
61. Cavenago M, Veltri P. Deflection compensation for multiaperture negative ion beam extraction: Analytical and numerical investigations. Plasma Sourc Sci Technol (2014) 23:065024. doi:10.1088/0963-0252/23/6/065024
62. Fröschle M, Riedl R, Falter H, Gutser R, Fantz U. Recent Developments at IPP on Evaporation and Control of Caesium in Negative Ion Sources. Fusion Eng Des (2009) 84:788–92. doi:10.1016/j.fusengdes.2008.12.063
63. Friedl R, Fantz U. Fundamental Studies on the Cs Dynamics Under Ion Source Conditions. Rev Sci Instrum (2014) 85:02B109. doi:10.1063/1.4830215
64. Heiler A, Friedl R, Fantz U. Impact of the Photoelectric Threshold Sensitivity on the Work Function Determination - Revealing Ultra-Low Work Functions of Caesiated Surfaces. Rev Sci Instrum (2021).
65. Friedl R, Fantz U. Influence of H2 and D2 Plasmas on the Work Function of Caesiated Materials. J Appl Phys (2017) 122:083304. doi:10.1063/1.5000373
66. Fantz U, Wimmer C. Cesium Dynamics in Long Pulse Operation of Negative Hydrogen Ion Sources for Fusion. Rev Sci Instrum (2012) 83:02B110. doi:10.1063/1.3670347
67. Fantz U, Franzen P, Wünderlich D. Development of Negative Hydrogen Ion Sources for Fusion: Experiments and Modelling. Chem Phys (2012) 398:7. doi:10.1016/j.chemphys.2011.05.006
68. Wünderlich D, Riedl R, Fantz U, Heinemann B, Kraus W. Initial Caesium Conditioning in Deuterium of the ELISE Negative Ion Source. Plasma Phys Control Fusion (2018) 60:085007. doi:10.1088/1361-6587/aac7fb
69. Wimmer C, Mimo A, Lindauer M, Fantz U. Improved Understanding of the Cs Dynamics in Large H- Sources by Combining TDLAS Measurements and Modeling. AIP Conf Proc (2018) 2011:060001.
Keywords: ion source, negative hydrogen ion, neutral beam injection, ICP, ITER
Citation: Fantz U, Briefi S, Heiler A, Wimmer C and Wünderlich D (2021) Negative Hydrogen Ion Sources for Fusion: From Plasma Generation to Beam Properties. Front. Phys. 9:709651. doi: 10.3389/fphy.2021.709651
Received: 14 May 2021; Accepted: 09 August 2021;
Published: 29 September 2021.
Edited by:
Roderick William Boswell, Australian National University, AustraliaReviewed by:
Kazunori Takahashi, Tohoku University, JapanCopyright © 2021 Fantz, Briefi, Heiler, Wimmer and Wünderlich. This is an open-access article distributed under the terms of the Creative Commons Attribution License (CC BY). The use, distribution or reproduction in other forums is permitted, provided the original author(s) and the copyright owner(s) are credited and that the original publication in this journal is cited, in accordance with accepted academic practice. No use, distribution or reproduction is permitted which does not comply with these terms.
*Correspondence: U. Fantz, dXJzZWwuZmFudHpAaXBwLm1wZy5kZQ==
Disclaimer: All claims expressed in this article are solely those of the authors and do not necessarily represent those of their affiliated organizations, or those of the publisher, the editors and the reviewers. Any product that may be evaluated in this article or claim that may be made by its manufacturer is not guaranteed or endorsed by the publisher.
Research integrity at Frontiers
Learn more about the work of our research integrity team to safeguard the quality of each article we publish.