 Sun Tong
 Zhu Tianqi1
 Zhang Hao
94% of researchers rate our articles as excellent or good
Learn more about the work of our research integrity team to safeguard the quality of each article we publish.
Find out more
ORIGINAL RESEARCH article
Front. Phys. , 28 May 2021
Sec. Interdisciplinary Physics
Volume 9 - 2021 | https://doi.org/10.3389/fphy.2021.697698
This article is part of the Research Topic Advanced Sensing, Materials and Intelligent Algorithms for Multi-Domain Structural Health Monitoring View all 23 articles
Parameter optimization analysis on the negative stiffness device (NSD) installed in the benchmark highway bridge is carried out in this study. Key parameters and constrain conditions are determined in accordance with the characteristics of NSD, and an objective function is designed with safety and comfort being considered. Individual fitness value–related cross and mutation operators are designed to protect excellent chromosome and improve the efficiency and convergence of computation. The genetic algorithm is used to realize parameter optimization of the NSD used in a benchmark highway bridge. Dynamic responses of structure without NSD, with random NSD, and with optimal designed NSD are compared. By analyzing the time history of displacement and acceleration, it can be concluded that dynamic responses of the structure decrease obviously when the NSD is added, and a better seismic reduction effect can be reached when the NSD is designed optimally in accordance with the optimization method and different earthquake excitations have slight influence on the optimization results.
The conventional way to reduce the structural deformation and internal shear force under severe ground motions is to design the structure with high stiffness. Larger stiffness can resist more external force, while inter-story shear force would be increased with the increasing of stiffness [1, 2]. To address this problem, Reinhorn et al. [3] and Viti et al. [4] proposed the concept of structural weakening, which can cause the reduction of internal shear force or accelerations. The concept of apparent weakening is proposed by Nagarajaiah et al. [5] along with a negative stiffness device (NSD) which can simulate the structural yielding without inducing the structural real inelastic behavior. Nowadays, negative stiffness device is given considerable attention by engineers and researchers among many structural control strategies [6–8]. Yet, most of the related research of negative stiffness control is qualitative concept verification.
Optimization strategy of a rail-type NSD [9] in a benchmark highway bridge under seismic excitation was investigated in this study. A two-step optimal design method is proposed. The first step is to analyze the device and find out the factors that are determining mechanical properties of the device. The amplitude of the curve function A and frequency ω are chosen as the damper design parameters. The arrangement of dampers was determined by a comparison method [10]. Numerical example is used to verify the proposed method for optimal device placement and to demonstrate the effectiveness of an optimally applied control system.
The open-loop model of an n degree-of-freedom seismic response–controlled structure under earthquake excitation can be described as follows:
where M, C, and K are n × n dimensional mass, damping, and stiffness constant matrices of the controlled building, respectively; X(t) is the n dimensional relative displacement vector with respect to the ground; H is the location matrix of control devices; U(t) is control force vector;
As shown in Figures 1A,B, the rail-type negative stiffness device developed in this work is composed of a roller pushed by a pre-compressed spring as well a curved template that the wheel can roll on. There is a flat gap on the curve around equilibrium, so that the stiffness of the combination of NSD and isolation system will be the same as that of the original isolation system only. When the roller goes beyond the gap, the pre-compressed spring 1) and the slope 3) will generate a force F in the same direction as the imposed displacement, thus the composite system appears to yield or soften, that is, apparent yielding. The negative force F is given by the following equation:
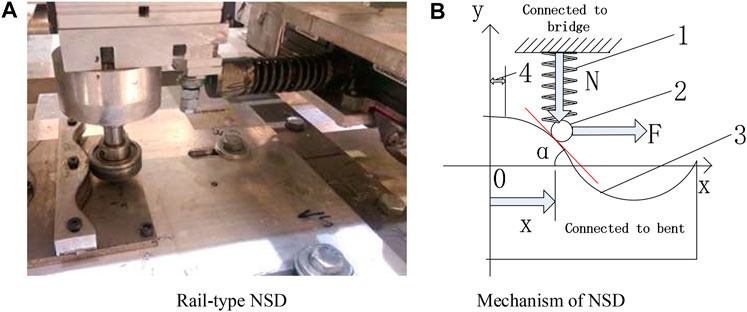
FIGURE 1. Basic mechanism of the NSD. (A) Rail-type NSD and (B) Mechanism of NSD.
in which k is the stiffness of pre-compressed spring,
According to the mechanical model of the device [11], the key parameters that affect the mechanical property of the NSD device are: 1) stiffness of the compressed spring k, 2) compression length of the spring, and 3) the curve function of the template f(x). The first two factors mainly affect the spring pressure, which has little optimization potential due to the insufficient spring force. The two key parameters in the track curve function, amplitude A and frequency ω, representing the track fluctuation degree and slope, respectively, play a decisive role in the force-displacement curve of the device.
The friction component in Eq. 2 is
The curve function of the original NSD is given by the following equation (the length unit is meter):
Since the negative force of the NSD is controlled by amplitude A and frequency ω, they are set as the optimization parameters [12]. A 0.05 m flat gap is set on the template around equilibrium. The device will not generate negative stiffness force when the displacement is within this range, so that the controlled structure will maintain the original stiffness when the displacement is small and avoid the amplification of small excitation disturbance. The length of flat gap only needs to be selected properly to achieve the design purpose, so the original value remains unchanged.
Safety and comfort are two key indexes of structural vibration control, which is governed by displacement response and acceleration response, respectively [13]. According to the characteristics of negative stiffness control, the following objective function is proposed:
where
Selection operation is to select genes with better adaptability according to the idea of survival of the fittest and the results of individual fitness evaluation [15, 16]. The idea is to give preference to the individuals with good fitness scores and allow them to pass their genes to the successive generations. Selection operation can improve global convergence, computational efficiency, and avoid gene deletion. Considering the population size and convergence demand, the roulette method [17] is used as the selection operator:
where pi is the probability of the ith individual being selected and fi is the fitness value of the ith individual.
Crossover plays a key role in obtaining new excellent individuals by genetic algorithm [18]. Before the crossover operation, the individuals in the population need to be paired. The common way is random pairing. The design of crossover operator not only needs to keep the existing excellent genes but also can produce better individuals. In this research, two point crossover is adopted, that is, two points are randomly set in the code of the parent gene to exchange the first and last segments of the gene.
Mutation is to change one or some bit values of an individual gene with a small probability and then generate a new individual. Mutation itself is a kind of random algorithm, and its local search ability can accelerate the evolution of individuals to the optimal solution [19]. Mutation can avoid the loss of some information caused by selection and crossover operation and maintain the diversity in population to avoid the premature convergence.
The crossover operator and mutation operator cooperate with each other to complete the global search and local search of the search space, so that the genetic algorithm can complete the optimization process of the optimal problem with good search performance. However, randomness can accelerate the local convergence, and it may also destroy the current excellent individuals, which is not conducive to the convergence of the algorithm. In order to protect excellent chromosome and improve the efficiency and convergence of computation, the probability of cross and mutation is set as a function of individual fitness scores, which is given by Eq. 6 and Eq 7:
where
The numerical analysis on a benchmark highway bridge [20] is carried out to verify the effectiveness of the proposed optimization method. The bridge model used for the benchmark study is based on the 91/5 highway bridge in Southern California, as shown in Figure 2A. The locations of control devices and sensors on the bridge are shown in Figure 2B The superstructure of the bridge consists of a two-span, cast-in-place, prestressed concrete (PC) box girder, and the substructure is in the form of PC outriggers. Each span of the bridge is 58.5 m long, spanning a four-lane highway, with two abutments skewed at 33°. The width of the deck is 12.95 m along the east direction and 15 m along the west direction. The deck is supported by a 31.4-m-long and 6.9-m-high prestressed concrete outrigger, resting on two pile groups. The total mass of the benchmark highway bridge is 4,237,544 kg, and the mass of the deck is 3,278,404 kg.
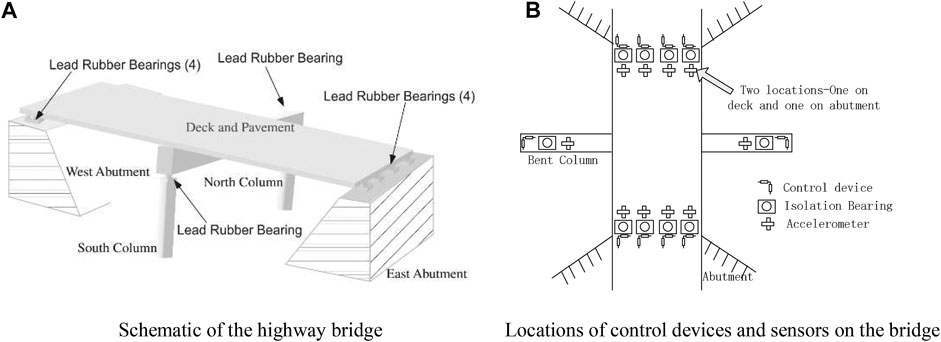
FIGURE 2. enchmark highway bridge model [20]. (A) Schematic of the highway bridge. (B) Locations of control devices and sensors on the bridge.
A finite element model (FEM) is developed to study the structural dynamic characteristics of the highway bridge. The first six natural frequencies [21, 22] of vibration of the FEM are shown in Table 1.
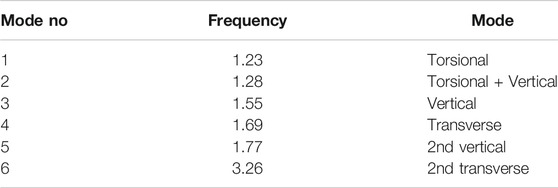
TABLE 1. Natural Frequencies of the highway bridge.
The peak value of displacement and acceleration of the structure from the time history analysis of the benchmark model [23] are taken as the key parameters of the objective function value to evaluate the optimization effect. Meanwhile, they are the basis of calculating individual fitness, and the fitness function is given by the following formula:
where
Given the nonlinear characteristics of the controlled structure, the most unfavorable seismic record is selected as the seismic excitation: El Centro and NPalmspr. The peak acceleration is set as 400 gal.
Genetic algorithm is designed as follows: the initial population size is 20, the evolution algebra is 20, the binary length is 20, the generation gap is 0.9, the probability of cross operation is 0.7, the probability of variation operation is 0.1, the selection operator adopts the roulette method, the cross operator adopts a two-point crossing mode, the variation operator adopts a discrete type, and embeds the benchmark program into the main program of genetic algorithm. For the rail-type negative stiffness device, the optimization results are shown in Table 2.
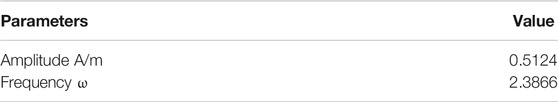
TABLE 2. Optimization parameters.
The iterative process of genetic algorithm is shown in Figure 3. It can be seen that the stable decline of function value from the tenth generation to the 29th generation is the process of outstanding genes emerging; after the 30th generation, the function value tends to be stable, which indicates that the genetic algorithm has very good convergence.
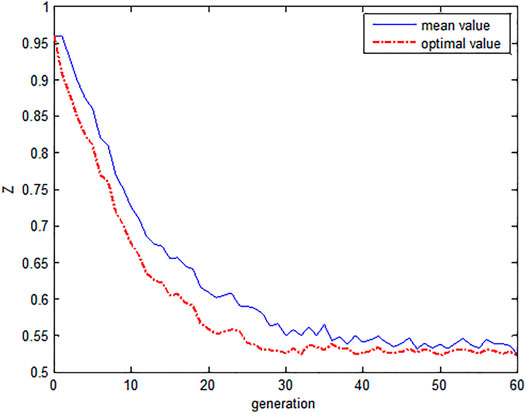
FIGURE 3. Iterative process of the genetic algorithm.
The control effects of three different control strategies are studied: isolation (Iso), original NSD, and optimized NSD with the simulation duration of 20s. Figures 4,5 show comparisons of the time history of displacement and acceleration at mid-span with different control strategies under 400 gal El Centro earthquake excitations, respectively. It can be seen from Figure 4 that the peak displacement response of the structure with NSD is smaller than that of the isolated structure. Peak response is reduced from 0.251 to 0.108 m by the decrease of 56.9%. After optimization, the peak displacement is further reduced to 0.080 m by the decrease of 69.1%. The same phenomenon can be also seen in Figure 5; when NSD is applied, the maximum acceleration response is reduced from 1.127 m/s2 to 1.091 m/s2 by the decrease of 3.1%. The peak response after optimization is 12.2% lower than that of NSD before optimization. It can be seen from the figure that the displacement time history curve (dotted line) after optimization is wrapped with the displacement time history curve (solid line) before optimization, indicating that the control effect has been comprehensively improved.
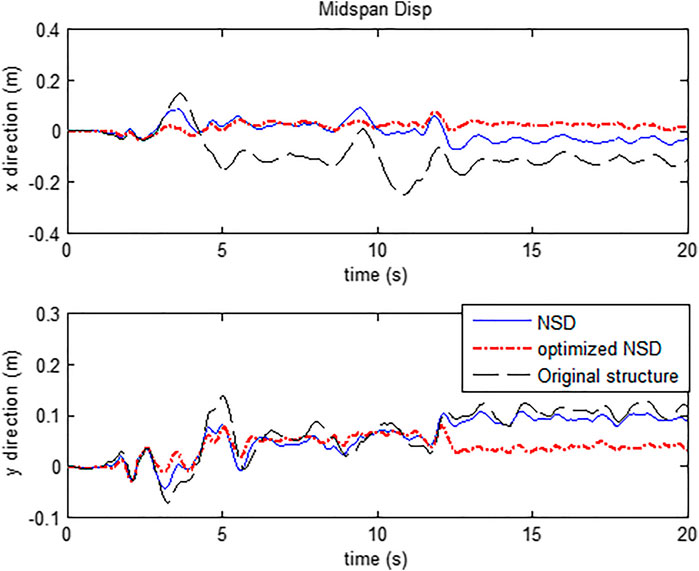
FIGURE 4. Time history of displacement responses at mid-span under El Centro earthquake.
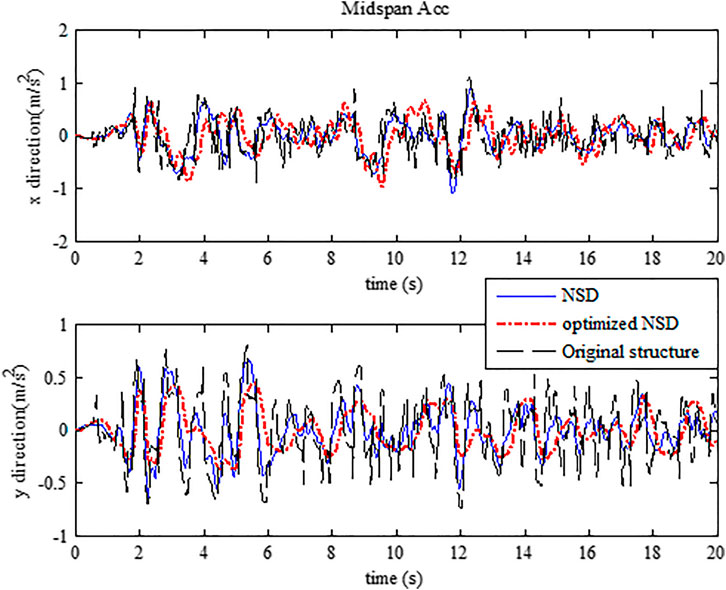
FIGURE 5. Time history of acceleration responses at mid-span under El Centro earthquake.
Through optimization, the peak value of seismic displacement of the structure is greatly reduced, and the safety of the structure is improved; after the earthquake, the structure has smaller residual deformation, which can ensure the economy.
Table 3 shows the peak displacement and acceleration response of the benchmark model under the El Centro wave excitation under three working conditions: isolation (Iso), original NSD, and optimized NSD. The reduction rate of displacement in Table 3 is defined as the ratio of the difference between the displacement response before and after optimization and the displacement response before optimization. The reduction rate of acceleration is the same in which, the response value before optimization is taken from the relevant literature [24]. As shown in the table, peak displacement and acceleration response are effectively reduced when NSD is applied. Moreover, the optimal designed NSD can further improve the seismic performance of the benchmark highway bridge.

TABLE 3. Peak acceleration and displacement at mid-span (El Centro).
To determine the suitability of the proposed optimization method, the sensitivity of the objective function to earthquake excitations is studied. Take NPalmspr earthquake for example, comparison of displacement and acceleration time history under different control cases are shown in Figure 6 and Figure 7, respectively. It can be seen from Figure 6 that displacement response in both x and y directions are significantly reduced when NSD is applied, and they are further mitigated when the NSD is optimal designed. The same phenomenon can be also seen in Figure 7; the acceleration time history of optimized NSD is wrapped by that of NSD and both of them are wrapped by the curve of original structure. The analysis above indicates that the seismic response of the highway bridge can be effectively reduced when NSD is optimal designed.
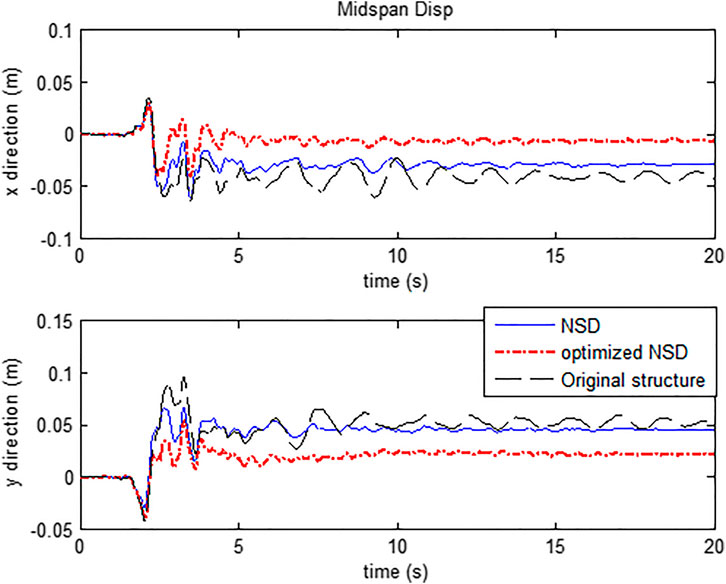
FIGURE 6. Time history of displacement responses at mid-span under NPalmspr earthquake.
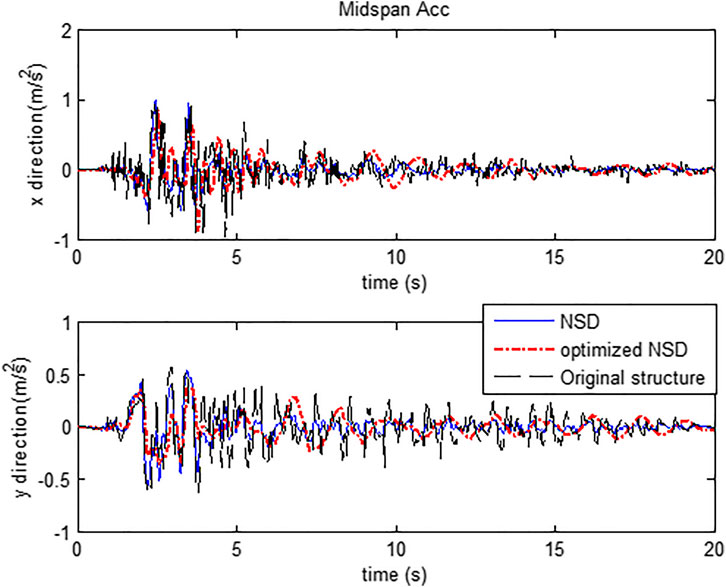
FIGURE 7. Time history of acceleration responses at mid-span under NPalmspr earthquake.
The values of the objective function under earthquake excitations with different amplitude and spectrum characteristics are shown in Figure 8. It can be seen that the objective function value is relatively stable under amplitude from 200 gal to 700 gal. Moreover, the value of objective function also changes slightly when different excitation is applied. In all cases, the value of objective function fluctuates within a range of 0.529–0.549. It can be drawn that the proposed objective function can be used for optimizing NSD added in the benchmark highway bridge under different earthquake excitations.
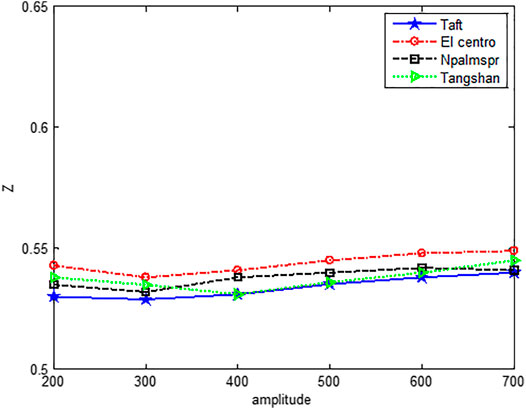
FIGURE 8. Sensitivity of the objective function to earthquake excitations.
In this article, parametric optimization analysis on the NSD added in the benchmark highway bridge is carried out. Optimization parameters and constrain conditions are determined in accordance with characteristics of the NSD. Considering safety and comfort, objective function is proposed. Individual fitness value–related cross and mutation operators are designed to protect excellent chromosomes and improve the efficiency and convergence of computation. Then the genetic algorithm is used to realize parameter optimization of the NSD used in the benchmark highway bridge. The following conclusions can be obtained from analysis:
(1) Both displacement and acceleration response of the benchmark highway bridge are effectively reduced when NSD is applied.
(2) Optimization of the parameter of NSD can further improve the seismic performance of the benchmark highway bridge.
(3) The optimization results tend to be consistent under different earthquake excitations which indicates that the optimization strategy has good robustness
The raw data supporting the conclusion of this article will be made available by the authors, without undue reservation.
Conceptualization, ST and ZH. Methodology, ST and SL. Software, ZT. Formal analysis, ZT. Data curation, ST. Writing—original draft preparation, ST and HZ. Project administration, ST. Funding acquisition, ST. All authors have read and agreed to the published version of the manuscript.
Some or all data, models, or code that support the findings of this study are available from the corresponding author upon reasonable request.
The authors are grateful for the financial support from the National Natural Science Foundation of China (51808355) and the China Postdoctoral Science Foundation (2019M651146).
The authors declare that the research was conducted in the absence of any commercial or financial relationships that could be construed as a potential conflict of interest.
1. Mashhadi J, Saffari H. Effects of Postelastic Stiffness Ratio on Dynamic Increase Factor in Progressive Collapse[J]. J Perform Constructed Facil (2017) 31(6):04017107. doi:10.1061/(asce)cf.1943-5509.0001109
2. Zhang C. Control Force Characteristics of Different Control Strategies for the Wind-Excited 76-story Benchmark Building Structure. Adv Struct Eng (2014) 17(4):543–59. doi:10.1260/1369-4332.17.4.543
3. Pasala DTR, Sarlis AAS, Reinhorn AM. A New Structural Modification Approach for Seismic Protection Using Adaptive Negative Stiffness Device. SEI Struct Congress (2011) 2892–904. doi:10.1061/41171(401)251
4. Reinhorn AM, Viti S, Cimellaro GP. Retrofit of Structures: Strength Reduction with Damping Enhancement. In: Proceedings of the 37th Joint Meeting of U.S.-Japan Panel on Wind and Seismic Effects; 2005 May 16–18; Tsukuba, Japan. UJNR (2005). p. 16–21.
5. Pasala DTR, Sarlis AA, Nagarajaiah S, Reinhorn AM, Constantinou MC, Taylor D. Adaptive Negative Stiffness: New Structural Modification Approach for Seismic Protection. J Struct Eng (2013) 139(7):1112–23. doi:10.1061/(asce)st.1943-541x.0000615
6. Qu CX, Li* HN, Huo LS, Yi TH. Optimum Value of Negative Stiffness and Additional Damping in the Civil Structures. ASCE J Struct Eng (2017) 143(8):04017068. doi:10.1061/(asce)st.1943-541x.0001805
7. Sarlis AA, Pasala DTR, Constantinou MC, Reinhorn AM, Nagarajaiah S, Taylor DP Negative Stiffness Device for Seismic Protection of Structures: Shake Table Testing of a Seismically Isolated Structure[J]. J Struct Engineering (2016) 142(5):1124–33.
8. Saha A, Mishra SK. Adaptive Negative Stiffness Device Based Nonconventional Tuned Mass Damper for Seismic Vibration Control of Tall Buildings. Soil Dyn Earthquake Eng (2019) 126:57–67. doi:10.1016/j.soildyn.2019.105767
9. Li HN, Sun T. Optimal Design for Rail-type Negative Stiffness Control System. Earthquake Eng Eng Vibration (2018) 38(1):21–7. doi:10.13197/j.eeev.2018.01.21.lihn.003
10. Jin B, Li ZY, Zhou W. Optimal Analysis on Location and Quantity of Dampers Based on Improved Genetic Algorithm. J Hunan Univ (Natural Sciences) (2019) 46(11):114–21. doi:10.16339/j.cnki.hdxbzkb.2019.11.013
11. Sun T, Li HN, Lai ZL. Study on Structural Vibration Control Using Curve-Based Negative Stiffness Device. J Vibration Eng (2017) 30(03):449–56.
12. Zhang Y, Xue SL, Chang J. Parameter Optimization and Application of Vibration Damping Device Based on Negative Stiffness. Earthquake Eng Eng Dyn (2018) 38(02):201–9. doi:10.13197/j.eeev.2018.02.201.zhangy.023
13. Suresh L, Mini KM. Effect of Multiple Tuned Mass Dampers for Vibration Control in High-Rise Buildings. Pract Period Struct Des Constr (2019) 24(4):04019031. doi:10.1061/(asce)sc.1943-5576.0000453
14. Izard AG, Alfonso RF, Mcknight G, Valdevit L. Optimal Design of a Cellular Material Encompassing Negative Stiffness Elements for Unique Combinations of Stiffness and Elastic Hysteresis[J]. Mater Design (2017) 135:37–50. doi:10.1016/j.matdes.2017.09.001
15. Mirosław K, Jan B, Marcin B. Optimization of Warehouse Operations with Genetic Algorithms. Appl Sci (2020) 10:4817. doi:10.3390/app10144817
16. Sakalli US, Atabas I. Ant Colony Optimization and Genetic Algorithm for Fuzzy Stochastic Production-Distribution Planning. Appl Sci (2018) 8:2042. doi:10.3390/app8112042
17. Wei B, Yu F, Xu X. Interactive Evolutionary Algorithm Based on Improved Roulette Wheel Selection Strategy. Comput Digital Eng (2014) 42:1763–834. doi:10.15961/j.jsuese.2016.02.019
18. Liu WG, Yu XX, Xu H. Seismic Response of High-Rise Isolated Building Based on Negative Stiffness Device with Damping. J Building Structures (2020) 41(07):36–44. doi:10.14006/j.jzjgxb.2018.0171
19. Zhang X. Application of Genetic Algorithm in Computer Network Optimization Design. Digital Technol Appl (2020) 38(6):105–6. doi:10.19695/j.cnki.cn12-1369.2020.06.47
20. Nagarajaiah S, Narasimhan S. Smart Base-Isolated Benchmark Building. Part II: Phase I Sample Controllers for Linear Isolation Systems[J]. Struct Control Health Monit (2010) 13(2–3):589–604. doi:10.1002/stc.100
21. Qu C-X, Yi* T-H, Zhou Y-Z, Li H-N, Zhang Y-F. Frequency Identification of Practical Bridges through Higher Order Spectrum. ASCE J Aerospace Eng (2018) 31(3):04018018. doi:10.1061/(asce)as.1943-5525.0000840
22. Qu C-X, Yi* T-H, Yi H-N, Chen B. Closely Spaced Modes Identification through Modified Frequency Domain Decomposition. Measurement (2018) 128:388–92. doi:10.1016/j.measurement.2018.07.006
23. Nagarajaiah S, Narasimhan S. Smart Base Isolated Benchmark Building Part II: Phase I Sample. J Struct Control (2002) 00:1–6.
Keywords: optimal design, NSD, genetic algorithm, benchmark model, optimization analysis
Citation: Tong S, Tianqi Z, Li S and Hao Z (2021) Optimal Design of Negative Stiffness Devices for Highway Bridges Using Performance-Based Genetic Algorithm. Front. Phys. 9:697698. doi: 10.3389/fphy.2021.697698
Received: 20 April 2021; Accepted: 10 May 2021;
Published: 28 May 2021.
Edited by:
Chun-Xu Qu, Dalian University of Technology, ChinaReviewed by:
Yanan Li, CITIC Construction, ChinaCopyright © 2021 Tong, Tianqi, Li and Hao. This is an open-access article distributed under the terms of the Creative Commons Attribution License (CC BY). The use, distribution or reproduction in other forums is permitted, provided the original author(s) and the copyright owner(s) are credited and that the original publication in this journal is cited, in accordance with accepted academic practice. No use, distribution or reproduction is permitted which does not comply with these terms.
*Correspondence: Zhang Hao, aF96aGFuZ0Bzanp1LmVkdS5jbg==
Disclaimer: All claims expressed in this article are solely those of the authors and do not necessarily represent those of their affiliated organizations, or those of the publisher, the editors and the reviewers. Any product that may be evaluated in this article or claim that may be made by its manufacturer is not guaranteed or endorsed by the publisher.
Research integrity at Frontiers
Learn more about the work of our research integrity team to safeguard the quality of each article we publish.