- Department of Ophthalmology, Scientific Institute San Raffaele Hospital, University Vita-Salute, Milan, Italy
Background: In this study, we aimed to discriminate high reflectivity and low reflectivity macular neovascularization (MNV) lesions secondary to age-related macular degeneration (AMD)and to assess the influence of blood flow features on the amount of MNV detected by optical coherence tomography angiography (OCTA).
Methods: The study was designed as observational, cross-sectional. Type 1 and type 2 MNV lesions were included. All the patients underwent fluorescein angiography (FA), indocyanine green angiography (ICGA) and OCTA. MNV size was calculated on early FA for type 2 MNV and on both early and late phases of ICGA for type 1 lesions. From OCTA, we calculated both MNV size and MNV reflectivity. We assessed the agreement between FA/ICGA and OCTA MNV sizes. Moreover, we studied the relationship between MNV reflectivity properties and MNV OCTA detection.
Results: Fifty eyes (50 patients) were included. MNV was identified as follows: 35 /70%) type 1 and 15 (30%) type 2. We found a good agreement between early ICGA size and OCTA size for type 1 MNV (2.10 ± 1.91 mm2 vs 2.09 ± 1.87 mm2; p > 0.05), whereas MNV lesions turned out to be remarkably bigger on late ICGA phase (3.41 ± 2.87 mm2; p < 0.01). Interestingly, OCTA well-matched with FA in terms of MNV size for type 2 lesions (2.36 ± 2.15 mm2 vs 2.37 ± 2.25 mm2). MNV reflectivity was higher in type 2 MNV and it was strongly associated with the OCTA ability to reconstruct the neovascular network.
Conclusion: Our study quantitatively showed that MNV filling pattern and MNV blood flow reflectivity features influence the OCTA detection of the MNV in its entirety.
1 Introduction
Optical coherence tomography (OCT) angiography (OCTA) has considerably improved and simplified the diagnostic approach to macular neovascularization (MNV) secondary to age-related macular degeneration (AMD), by revealing with great accuracy the morphology of the neovascular network and its clinical features [1, 2]. However, OCTA can reveal only a part of the entire MNV lesion, which is detected in its entirety by fluorescein angiography (FA) and indocyanine green angiography (ICGA) [3]. The reasons of this discrepancy are not fully understood and FA/ICGA still remains the gold standard for the proper detection of MNV. The reliability of MNV detection by OCTA also depends on the localization of the MNV. Indeed, whereas type 2 lesions can be often well detected by OCTA, because of the pattern of growth occurring above the retinal pigment epithelium (RPE), type 1 lesions are often challenging to be distinguished in their entirety, because of a growing pattern occurring below the RPE often interfering with the proper blood flow signal detection performed by OCTA [3]. Since the final OCTA output, namely the reconstruction of the intraretinal capillaries, directly depends both on the amount and speed of blood flow interesting the capillary network, in our case the MNV, it may be assumed that the reflectivity intensity of the MNV might be related with these two OCTA features. On the other side, the detection of physiological and pathological retinal capillaries can be also influenced by the different OCTA device technology. Indeed, previous studies highlighted how swept source OCTA technology is able to provide more information regarding the intraretinal vascular status, compared with spectral domain OCTA one [4, 5].
For all these reasons, the aim of the present study was to analyze the quantitative MNV features, in order to distinguish high reflectivity and low reflectivity MNV secondary to AMD and to assess the influence of MNV blood flow features on the amount of MNV revealed by means of OCTA.
2 Methods
The study was designed as a cross-sectional, observational case series. Patients affected by AMD complicated by naïve sub-foveal MNV were recruited at the Ophthalmology Unit of San Raffaele Hospital in Milan from January 2018 to January 2019. Signed informed consent was obtained by all patients before the examination. The study was approved by the Ethical Committee of the Vita-Salute San Raffaele University in Milan (protocol ID: MIRD) and was conducted in accordance with the Declaration of Helsinki.
The inclusion criterion was the identification of naïve type 1 or type 2 sub-foveal MNV secondary to AMD in pseudophakic eyes.
The following exclusion criteria were considered: polypoidal choroidal vasculopathy (PCV) and retinal angiomatous proliferation (RAP), owing to the scant information OCTA is able to provide about the neovascular net; other media opacities; ophthalmologic surgery within the last six months; glaucoma; diabetic retinopathy; history of uveitis; uncontrolled systemic arterial hypertension; uncontrolled diabetes mellitus.
MNV diagnosis was confirmed by means of FA and ICGA examinations (Spectralis HRA + OCT; Heidelberg Engineering, Heidelberg, Germany).
Ophthalmologic examination included BCVA measurement using standard ETDRS charts, slit lamp biomicroscopy of anterior and posterior segments, and Goldmann applanation tonometry. The structural OCT (HRA Spectralis Heidelberg, Germany) acquisition protocol included raster, radial and dense scans with a high number of frames (ART>25), and enhanced depth imaging (EDI). OCTA images were obtained using a swept source OCT DRI Topcon Triton (Topcon Corporation, Tokyo, Japan) (100.000 a-scan/second; resolution 8 µm). OCTA scans included high-resolution 3 × 3mm and 6 × 6mm acquisitions. Only high-quality images, evaluated by the Topcon Imaging Quality factor >70, were considered. The diagnostic flowchart for all the patients was: BCVA measurement, slit lamp examination and tonometry, structural OCT, OCTA, FA/ICGA examinations.
We obtained the automatic segmentation of the neovascular network from 3 × 3mm high resolution OCTA scans and assessed the MNV lesions with multiplanar segmentations. In particular, we exported the most superficial portion of the MNV lesion obtained from one segmentation, then modified the segmentation boundaries in order to highlight the deepest portion of the MNV. Once the entire neovascular network had been exported, we merged all the partial reconstructions so as to obtain the whole MNV detected by OCTA. Projection-artifacts removal tool provided by ImageNET6 Topcon software was used to remove the projections of superficial and deep capillary plexa. MNV size was calculated in both OCTA and dye-based angiography images. In accordance with the clinical practice routine, type 1 MNV size was measured on ICGA images, whereas type 2 MNV size was measured on FA ones. Type 1 MNV size was measured during early (1 min) and late (30 min) ICGA phases, whereas type 2 MNV size was measured in early FA phase.
All the analyses were performed by two expert graders (AA, AB) and the intergraders agreement coefficient was calculated for each collected parameter. We loaded MNV reconstructions in ImageJ software (https://imagej.net/Welcome) and measured MNV reflectivity intensity. We used the mean reflectivity value as a threshold for each MNV in order to separate the higher values, which we interpreted as highly detected flow, from the lower values, interpreted as poorly detected flow. Next, we calculated the percentage of the highly detected flow MNV lesion and the proportion of the poorly detected flow MNV lesion. Finally, we assessed the relationship between this quantitative categorization, as regards differences in degree and size revealed by OCTA and dye-based angiography. In order to test the reliability of OCTA to detect and reconstruct MNV network, we performed at least two OCTA acquisitions to extract repeatability and reproducibility values of MNV size and MNV reflectivity.
The statistical analysis was performed with the SPSS package (SPSS, Chicago, Illinois, United States), by using two-tailed t test for continuous variables and setting the statistical significance set at p < 0.05. Gender and sex were considered as fixed factors. The Tau-Kendall correlation test was used to assess the relationship between MNV reflectivity properties and the ratio between OCTA and dye-based angiography sizes of the MNV.
3 Results
We included 50 eyes of 50 patients affected by naïve MNV (34 males; mean age 76 ± 8 years). Mean BCVA was 0.51 ± 0.63 LogMAR and mean CMT was 410 ± 136 µm. MNV angiographic classification revealed 35 eyes with type 1 MNV (70%) and 15 with type 2 MNV (30%).
Type 1 MNV disclosed a mean size of 2.10 ± 1.91 mm2 in the early ICGA phase, increasing to 3.41 ± 2.87 mm2 in the late ICGA phase (p < 0.01) (Figure 1). Type 2 MNV showed a mean size of 2.36 ± 2.15 mm2 on early FA phase (Figure 2).
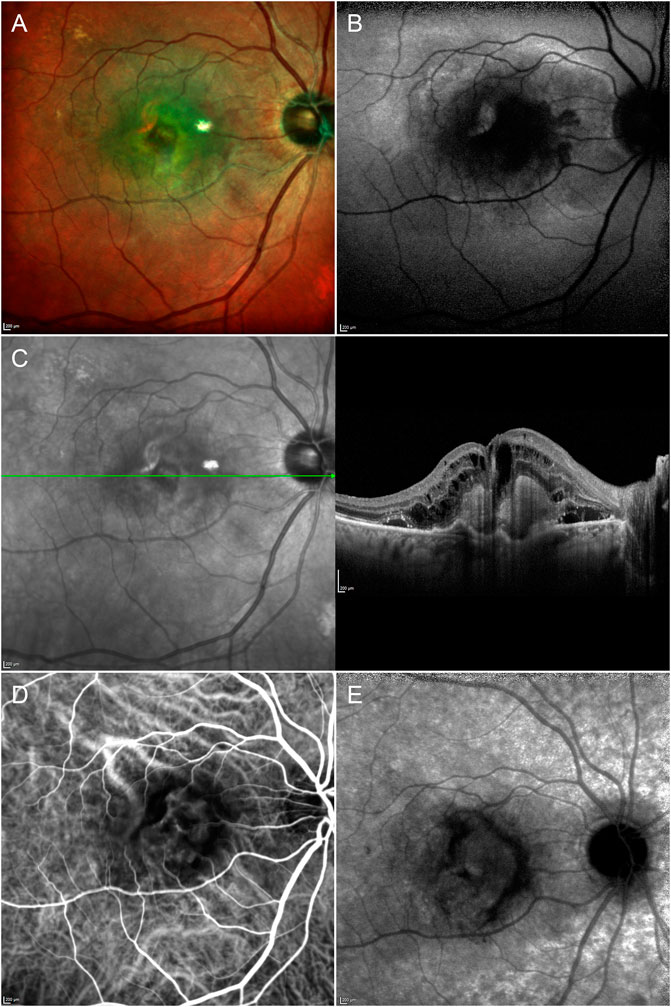
FIGURE 1. Multimodal imaging in type 1 MNV. Multicolor (A) and fundus autofluorescence (B) images reveal a macular lesion surrounded by depigmentation phenomena and a hypoautofluorescent signal involving the posterior pole. Structural OCT (C) shows a hyperreflective type 1 lesion with subretinal exudation. The type 1 MNV plaque is already detectable in the early (D) ICGA phase and increases in size in the late (E) ICGA phase.
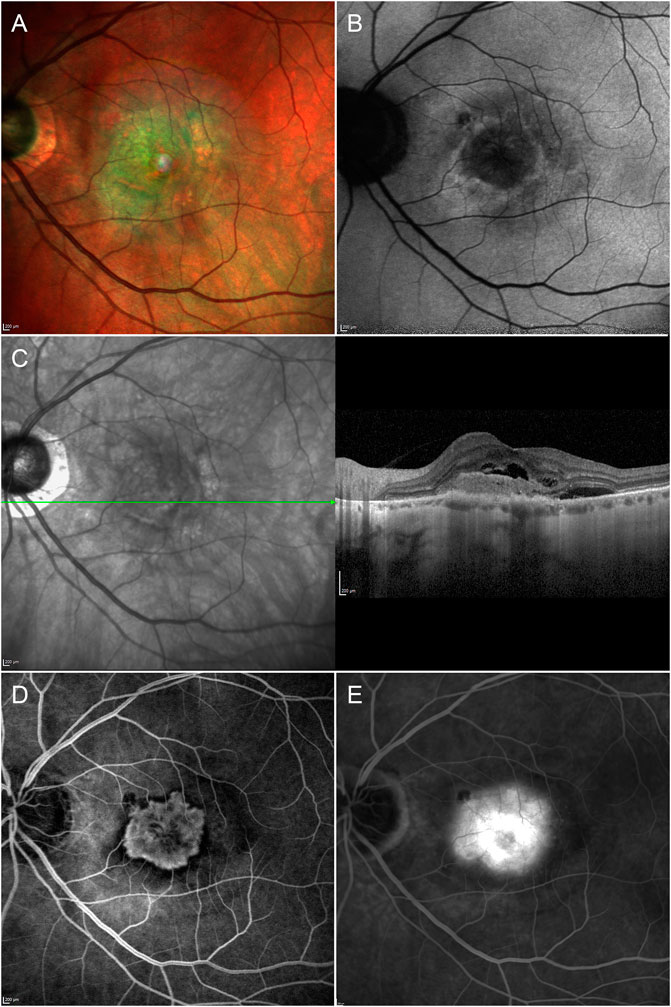
FIGURE 2. Multimodal imaging in type 2 MNV. Multicolor (A) and fundus autofluorescence (B) images reveal depigmentation phenomena and a hypoautofluorescent signal characterizing the macular region. Structural OCT (C) shows a hyperreflective type 2 lesion surrounded by subretinal exudation. The type 2 MNV lesion is fully detectable in the early (D) FA phase and is shown to be of similar size in the late (E) FA phase, with increased perilesional leakage.
Type 1 MNV size was 2.09 ± 1.87 mm2, while type 2 MNV size was 2.37 ± 2.25 mm2 on OCTA (p = 0.03) (Figure 3).
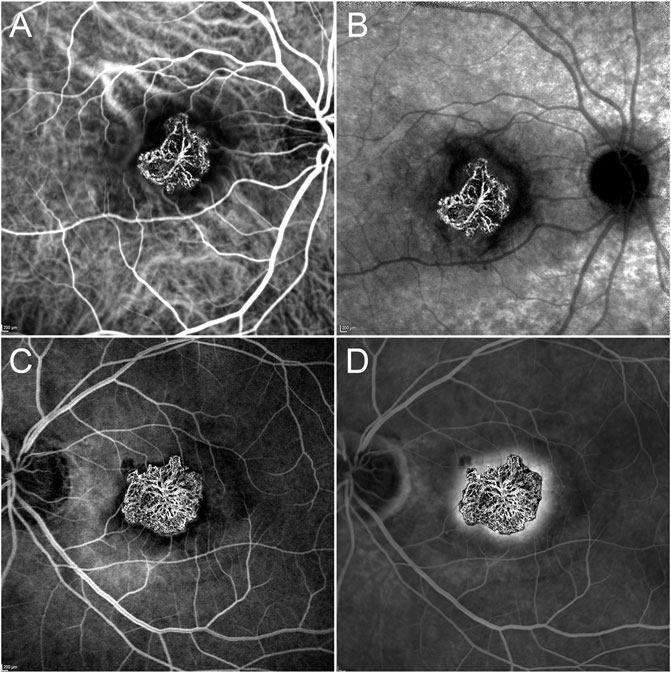
FIGURE 3. OCTA vs dye-based angiography in type 1 and type 2 MNV. OCTA MNV reconstruction overlaps well with the ICGA plaque in the early phase (A) but is found to be considerably smaller than the ICGA lesion in the late phase (B). On the other hand, type 2 MNV is of similar size in both OCTA and early FA examinations (C), maintaining the dimensions even in the late FA phase (D).
The type 1 MNV OCTA size coincided well with the measure obtained from the early ICGA phase (p > 0.05). On the contrary, a statistically significant difference was found comparing the OCTA size of MNV type 1 with the ICGA size in the late phase of the same MNV (p < 0.01).
OCTA and FA were well matched in terms of MNV type 2 detection (p > 0.05).
The mean OCTA reflectivity values were 100 ± 15 for type 1 MNV and 120 ± 10 for type 2 MNV (p < 0.01). Taking these values as thresholds, we found that 85 ± 5% of the entire type 2 MNV was distinguished by highly detected flow, whereas the proportion was just 56 ± 12% in type 1 MNV (p < 0.01) (Figure 4). In both cases, the poorly detected flow signal was distributed mainly in the peripheral MNV region. All the data are reported in Table 1.
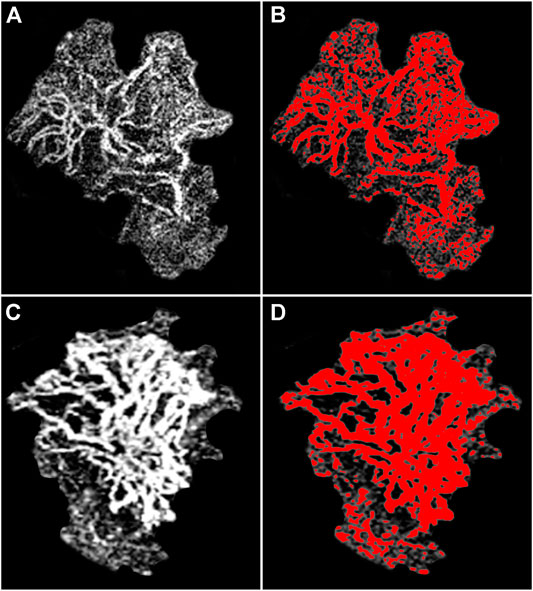
FIGURE 4. High and low flow signal distribution in OCTA MNV reconstruction. Type 1 MNV (A) shows a scattered highly detected flow signal distribution (red)–with a notable portion of the MNV, especially in the peripheral regions, exhibiting a poorly detected flow signal (B). In contrast, the highly detected flow signal (red) is shown to be more evenly distributed in type 2 MNV (C), and only a small portion of the entire MNV is characterized by poorly detected flow signal (D).
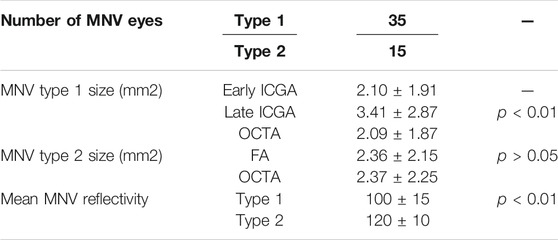
TABLE 1. Quantitative analyses. The following abbreviations are used: macular neovascularization (MNV), fluorescein angiography (FA), indocyanine green angiography (ICGA).
Both for MNV size and MNV reflectivity, repeatability and reproducibility were very-high (overall values of 0.93 and 0.91, respectively) (all p < 0.001). Furthermore, the mean calculated intergraders agreement resulted 0.89 (range 0.88–0.92; p < 0.01).
As regards the ratio between OCTA and dye-based angiography sizes, the higher the percentage of poorly detected flow signal found by OCTA, the higher the ratio between both sizes (Tau-Kendall correlation coefficient 0.76; p < 0.001).
4 Discussion
In the present paper, we assessed the OCTA reflectivity properties of type 1 and type 2 MNV secondary to AMD and their influence on the proper detection of the entire MNV lesion, compared with FA/ICGA examinations. MNV size proved larger on FA/ICGA than on OCTA, corroborating the findings of previous investigations [2]. We confirmed the size discrepancy of type 1 MNV, with regard to early and late phases of ICGA [6]. In particular, the type 1 MNV plaque can be visualized in its entirety in the late stages of the ICGA examination, proving to be significantly larger than the corresponding OCTA reconstruction. On the other hand, type 2 MNV showed unvaried size in both early and late stages of FA/ICGA examination and offered an excellent match with the corresponding OCTA reconstruction.
In our investigation, we applied a novel quantitative approach to study the perfusion features of MNV detected by OCTA. In our cohort of patients, type 2 MNV lesions turned out to be significantly more detected on OCTA than type 1 MNV, as assessed by the mean reflectivity intensity calculated from OCTA reconstructions. This means that the perfusion properties of type 2 MNV lesions resulted better enclosed within the range of sensitivity of OCTA device, than type 1 MNV.
Moreover, if interpreting the higher reflectivity of type 2 MNV as the sign of highly perfused neovascular lesions, our findings may explain previous evidence reporting higher exudation phenomena in type 2 MNV than in type 1 MNV [7]. Furthermore, we conducted a separate analysis of the high reflectivity and low reflectivity signals detected by the MNV reconstruction, whose readings may be related to the blood flow decorrelation signal detected and analyzed during OCTA acquisition. We found the highly detected flow signal to be more evenly distributed in type 2 MNV than in type 1 MNV. Indeed, it was found in 85% of the entire type 2 MNVs, compared with just 56% of the entire type 1 MNV. The distribution of this signal was concentrated predominantly in the central portion of the MNV and tended to become gradually weaker in the peripheral MNV region. This finding, in addition to the ICGA evidence of a slower but gradual filling of the MNV plaque, as discovered in the later stages of the ICGA, suggests that the degree and speed of MNV blood perfusion influences MNV detection by OCTA. Indeed, MNVs are distinguished by their earlier, faster, and more intense perfusion, which is well detected by OCTA, followed by the slower and less intense perfusion typical of more peripheral, smaller new vessels. This filling pattern is more typical of type 1 MNV than type 2 MNV. The type 1 MNV filling signal proved to be poorly detected by OCTA or not detected at all, probably because of the intrinsic shortcomings of current OCTA devices which cannot detect a blood flow signal over a given speed interval [8]. However, it is worth noting that our swept source OCTA MNV reconstructions showed unremarkable differences from dye-based angiography, with regard to type 2 MNV and the early ICGA phase of type 1 MNV; the only significant size mismatch being registered in respect of the late ICGA phase of type 1 MNV.
We are aware that our study contains a number of limitations. First of all, we restricted our analyses to type 1 and type 2 MNV subforms. Secondly, OCTA can be influenced by a number of image artifacts, which can potentially affect proper MNV detection and quantitative analyses [9]. Moreover, the reflective properties of MNV may be influenced by the number of media opacities, although we excluded patients with high media opacities and assumed media opacity influence would be evenly distributed across high and low flow signals and would thus not be an issue when analyzing the distribution of both signals within the MNV.
It is mandatory to open a technical parenthesis on our interpretation of MNV reflectivity. OCTA acquisition is an extremely complex procedure, strictly depending on several factors, including the acquisition speed, the resolution, the reliability of OCTA detector and many others. The final signal is governed by the number of particles (erythrocytes) passing through each voxel and their speed, which must be included in the range of sensitivity of the OCTA device to be detected. At the same time, the final OCTA reconstruction is the result of several steps related with the elaboration of the decorrelation signal, the tridimensional reconstruction of this signal and the enface visualization of the vascular network. In addition to these technical features, each acquisition may be affected by the above-mentioned artifacts. This means that our exploratory study related with the assessment and interpretation of MNV reflectivity should be considered just an attempt to indirectly quantify the flow features (flow speed + number of erythrocytes) characterizing the core and the peripheral regions of the MNV network. Although the relationship between MNV reflectivity features and FA/ICGA information was strong, further studies are warranted to better clarify the factors characterizing the final MNV reflectivity. We believe our investigation, designed to improve our understanding of type 1 and type 2 MNV flow characteristics, may be considered a proof-of-concept study.
In conclusion, the filling pattern of type 1 MNV can provide a possible explanation of the discrepancy in MNV size, as measured on ICGA and OCTA images. Further studies, providing a more thorough assessment of the perfusion features of central and peripheral MNV portions and gauging possible changes associated with anti-VEGF treatments, are warranted.
Data Availability Statement
The datasets presented in this article are not readily available because Special permission by the IRCCS San Raffaele Scientific Institute and by the authors required. Requests to access the datasets should be directed to YWxlc3NhbmRyby5hcnJpZ29AaG90bWFpbC5jb20=.
Ethics Statement
The studies involving human participants were reviewed and approved by the Ethical Committee of IRCCS San Raffaele Scientific Institute, Milan, Italy. The patients/participants provided their written informed consent to participate in this study.
Author Contributions
AA and EA: study design, data acquisition, data analysis, data interpretation, manuscript draft. AB, AAM and AS: data analysis, data acquisition. FB and Maurizio BP: data interpretation, manuscript revision, study supervision.
Conflict of Interest
The authors declare that the research was conducted in the absence of any commercial or financial relationships that could be construed as a potential conflict of interest.
References
1. Perrott-Reynolds R, Cann R, Cronbach N, Neo YN, Ho V, McNally O, et al. The Diagnostic Accuracy of OCT Angiography in Naive and Treated Neovascular Age-Related Macular Degeneration: a Review. Eye (2019) 33(2):274–82. doi:10.1038/s41433-018-0229-6
2. Arrigo A, Romano F, Aragona E, Di Nunzio C, Battista M, Bandello F, et al. Optical Coherence Tomography Angiography Can Categorize Different Subgroups of Choroidal Neovascularization Secondary to Age-Related Macular Degeneration. Retina (2020) 40(12):2263–9. doi:10.1097/iae.0000000000002775
3. Told R, Sacu S, Hecht A, Baratsits M, Eibenberger K, Kroh ME, et al. Comparison of SD-Optical Coherence Tomography Angiography and Indocyanine Green Angiography in Type 1 and 2 Neovascular Age-Related Macular Degeneration. Invest Ophthalmol Vis Sci (2018) 59(6):2393–400. doi:10.1167/iovs.17-22902
4. Haas AM, Ahmed D, Stattin M, Graf A, Krepler K, Ansari‐Shahrezaei S. Comparison of Macular Neovascularization Lesion Size by the Use of Spectral‐Domain Optical Coherence Tomography Angiography and Swept‐Source Optical Coherence Tomography Angiography versus Indocyanine Green Angiography. Acta Ophthalmol (2021) 99(2):e260–e266. doi:10.1111/aos.14572
5. Scharf J, Corradetti G, Corvi F, Sadda S, Sarraf D. Optical Coherence Tomography Angiography of the Choriocapillaris in Age-Related Macular Degeneration. J Clin Med (2021) 10(4):751. doi:10.3390/jcm10040751
6. Costanzo E, Miere A, Querques G, Capuano V, Jung C, Souied EH. Type 1 Choroidal Neovascularization Lesion Size: Indocyanine Green Angiography versus Optical Coherence Tomography Angiography. Invest Ophthalmol Vis Sci (2016) 57(9):OCT307–13. doi:10.1167/iovs.15-18830
7. Farecki M-L, Gutfleisch M, Faatz H, Rothaus K, Heimes B, Spital G, et al. Characteristics of Type 1 and 2 CNV in Exudative AMD in OCT-Angiography. Graefes Arch Clin Exp Ophthalmol (2017) 255(5):913–21. doi:10.1007/s00417-017-3588-y
8. Spaide RF, Fujimoto JG, Waheed NK, Sadda SR, Staurenghi G. Optical Coherence Tomography Angiography. Prog Retin Eye Res (2018) 64:1–55. doi:10.1016/j.preteyeres.2017.11.003
Keywords: age-related macular degeneration, optical coherence tomography angiography, macular neovascularization, fluorescein angiography, indocyanine green angiography
Citation: Arrigo A, Aragona E, Bordato A, Amato A, Saladino A, Bandello F and Parodi MB (2021) High Reflectivity and Low Reflectivity Properties on OCTA Influence the Detection of Macular Neovascularization in AMD. Front. Phys. 9:694035. doi: 10.3389/fphy.2021.694035
Received: 12 April 2021; Accepted: 07 June 2021;
Published: 17 June 2021.
Edited by:
Sijung Hu, Loughborough University, United KingdomReviewed by:
Ron Summers, Collegium Basilea, SwitzerlandV. N. Du Le, Florida International University, United States
Copyright © 2021 Arrigo, Aragona, Bordato, Amato, Saladino, Bandello and Parodi. This is an open-access article distributed under the terms of the Creative Commons Attribution License (CC BY). The use, distribution or reproduction in other forums is permitted, provided the original author(s) and the copyright owner(s) are credited and that the original publication in this journal is cited, in accordance with accepted academic practice. No use, distribution or reproduction is permitted which does not comply with these terms.
*Correspondence: Alessandro Arrigo, YWxlc3NhbmRyby5hcnJpZ29AaG90bWFpbC5jb20=
 Alessandro Arrigo
 Emanuela Aragona