 Sheng Liu
 Yibo Wei
 Yongxin Yin3
- 1Department of Mechanics, School of Applied Science, Taiyuan University of Science and Technology, Taiyuan, China
- 2Faculty of Infrastructure Engineering, Dalian University of Technology, Dalian, China
- 3Shenzhen JEMETECH Co., Ltd, Shenzhen, China
Pantograph-catenary system provides electric energy for the subway lines; its health status is essential to the serviceability of the vehicle. In this study, a real-time structural health monitoring method based on strain response inversion is proposed to calculate the magnitude and position of the dynamic contact force between the catenary and pantograph. The measurement principle, calibration, and installation detail of the fiber Bragg grating (FBG) sensors are also presented in this article. Putting this monitoring system in use, an application example of a subway with a rigid overhead catenary is given to demonstrate its performance. The pantograph was monitored and analyzed, running underground at a maximum speed of 80 km/h. The results show that the strain response inversion method has high measurement accuracy, good data consistency, and flexibility on sensor installation. It can accurately calculate the magnitude and location of the contact force exerted on the pantograph.
Introduction
With the rapid urbanization progress in China, subway lines have become longer and faster, as an indicator of city growth. By 2019, rail transit in China has reached a total length of 6,600 km, where the newly built lanes were 300 km. Considering mainland China in 2019, the subway-conducted passenger count was 23.814 billion, which has increased by 11.8% than that of 2018 [1–3]. Currently, subways are mainly powered by electricity harnessed through the pantograph–catenary coupling system while running. Thus, the structural health monitoring (SHM) of the coupling is crucial to the safety of the subway lines [4–9]. The contact resistance increases as the force between the catenary and pantograph decreases, consuming energy and generating heat, which could cause separation of the coupling and erosion of the contacting surface. On the contrary, if the force exceeds the safe level, the friction between the carbon slider and the catenary could lead to failure of the parts and thus accident [10].
At present, the main method of contact force measurement is to lay pressure sensors and acceleration sensors. The pantograph–catenary contact force can be obtained by balancing the force and using the inertia compensation method [11]. Japanese railway system applied an optimized measuring system by using the same number of sensors as the number of vibration modes and combining them to form a weighted average [12]. Studying the relation between the pantograph’s input and output, Japanese researchers have developed an inversion method using the vibration response for calculating the contact force [13]. In Germany, the pantograph monitoring system considers the horizontal and vertical forces and the vertical acceleration on each side of the carbon plating above the vehicle [14]. The methods mentioned above utilize electrical sensors such as resistance-based strain gauges to collect data; these sensors suffer from electromagnetic interference, and therefore they could be inaccurate. Tatsuya Koyama developed a camera recognition system that could analyze the internal force, inertial force, and contact force without installing sensors directly on the structures [15]. However, such an arrangement could be challenging to implement due to the inevitable complexation of the actual application. Recently, the researcher developed a method based on the transfer function to calculate the contact force, which considers the pantograph arc vibration waveform or the transfer function related to the contact force and the strain response [16]. Yet, this method lacks accuracy and has many restraints in the calculation.
A fiber Bragg grating (FBG) sensor has become a hotspot in the field of SHM system; it has been the vital component in the maintenance and management of a wide range of structures [17–21]. FBG sensors are ideal for monitoring the pantograph–catenary system, as it has the advantage of electromagnetic resistance, long-term reliability, and versatility in terms of implementation. In 2013, researchers applied bare FBG strain sensors underneath the pantograph head to monitor the magnitude of the contact force [22]. However, the monitoring of the contact force location remains unresolved, and the bare fiber can be challenging to install.
In this article, an inversion method based on the pantograph’s strain response to calculate the magnitude and location of the contact force is proposed. First, the mechanical model used in the calculation will be presented. Then, the relation between the contact force and the strain response measured by FBG sensors will be discussed along with the casing and temperature compensation method, which guides the design of the monitoring scheme. Finally, after a detailed calibration and adjustment process of the sensing system, the in-line test result will be presented.
Principle of Pantograph–Catenary Dynamics
Inversion Method Based on Strain Response
The pantograph consists of two conducting plates made of carbon which are mounted on a pneumatic suspension system. Figure 1 is a picture taken on-site at the Xi’an subway.
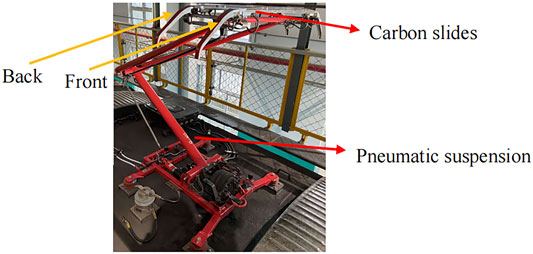
FIGURE 1. Picture of the pantograph.
The carbon slides are modeled as two simply supported beams, namely front and back. The mechanical model is shown in Figure 2.
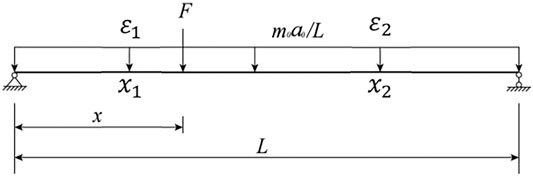
FIGURE 2. mechanical model of the pantograph.
As the vehicle runs, the beam would have a vertical acceleration of
The dynamic contact force presents itself in terms of strain distribution, as follows:
Here,
Solving for
Here,
Again, the derivation above is obtained by taking
Sensor Types and Sensing Principle
One of the challenges of pantograph monitoring is the electromagnetic interference caused by high voltage power lines. In this project, fiber Bragg grating (FBG) sensors are used to measure the strain response. The sensor itself has the advantages of high sensitivity, low noise, electromagnetic resistance, and long-term reliability, which suit the need for pantograph–catenary monitoring [24]. However, FBG sensors’ wavelength variation is a joint result of temperature fluctuation, contact force, and the Poisson effect [25].
To counter the thermal expansion, this project used a type of FBG sensor, shown in Figure 3, that had a layer of thermal shrinkage material embedded. Improving the performance of the strain sensors even further, a type of micro-FBG was also used that had a smaller size and only sensed the temperature change.

FIGURE 3. FBG strain sensor with thermal shrinkage insert.
In the following derivation, the quantities related to micro-FBGs are denoted with underscore
Here,
The thermal expansion coefficient
Here,
Here,
Substituting Eqs 7–9 into Eqs 5, 6 yields the following equation:
Judging from the results on-site, the vertical strain caused by the Poisson effect was insignificant; thus, the micro-FBG’s wavelength variation was considered only as a result of temperature variation. A calibration process was done to evaluate
Also, to monitor the acceleration dynamics, the FBG accelerometers were implemented.
Calibration
Temperature Compensation Factor Calibration
To compensate for the thermal effect, every strain sensor on the pantograph was paired with a micro-FBG. The pantograph was then placed outdoor overnight; as the temperature changes through the night, the wavelength data of each FBG was collected and used to calculate the compensation factor,
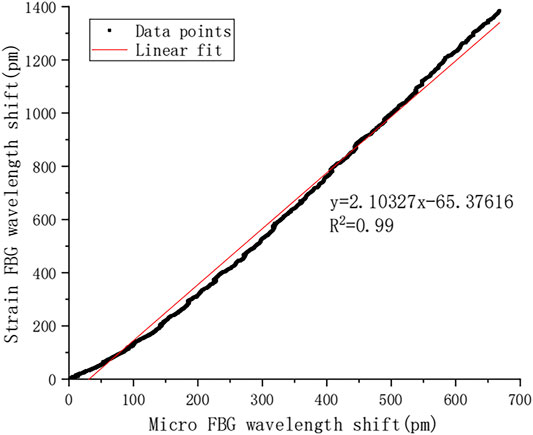
FIGURE 4. Linear fit of wavelength change between the micro-FBG sensor and the FBG strain sensor.
Each side yielded a fit that has a
EW Calibration
The length of the slide is 800 mm. Marking the left side as 0 and the right side 800, five points were selected at 200, 300, 400, 500, and 600, as shown in Figure 5. The weight loaded on each point started from 0 N and increases to 110 N with a 10 N increment.

FIGURE 5. Top view of the pantograph head.
During the calibration, sensors’ wavelengths varied linearly as the load increased. The root mean squares were greater than 0.99 for all sensors. Figure 6 below is the data plotted for one sensor’s wavelength with different load locations.
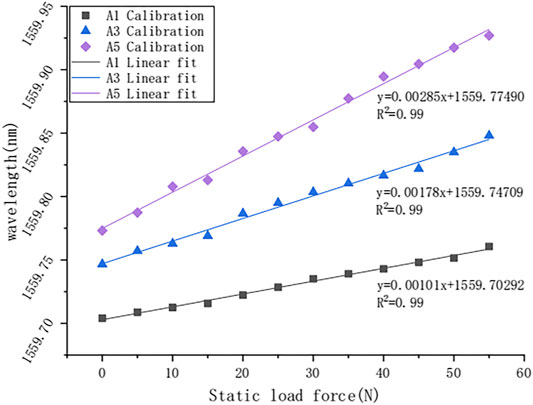
FIGURE 6. Front-right FBG wavelength variation.
The wavelength value was used in Eq. 10 to obtain the strain value, which was then substituted into Eqs 1, 2 to calculate the
Real-Time Monitoring and Analysis
Background and Sensor Layout Scheme
The subway line in this project has a total length of over 35 km with more than 25 stations, all of which are underground, and adopted the rigid overhead catenary design. Measurement was done as the vehicle departing the base station and making a stop at each station.
According to the measurement principle, strain sensors should be installed symmetrically so that the contact force is bounded in between the two sensors. Judging from the working condition and the abrasion of the other pantographs, strain sensors were installed 135 mm away from the ends. As shown in Figure 7, this pantograph had a set of two carbon slides, which contributed to 4 strain sensors. In addition, micro-FBGs, sensing only the temperature change, were installed perpendicular to the strain sensors.
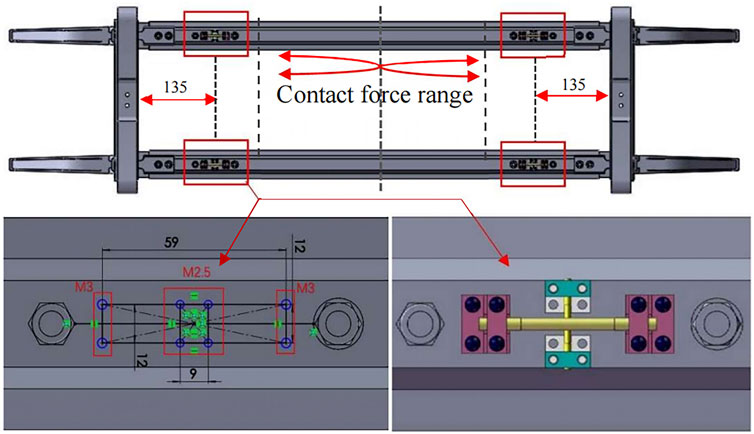
FIGURE 7. Illustration of the sensor layout (bottom view).
The accelerometers were installed at the front and back slides of the pantograph, as shown in Figure 8.
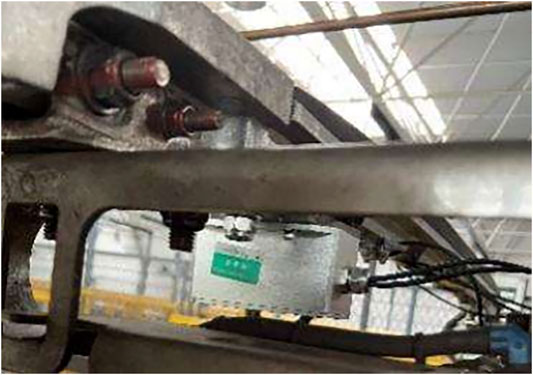
FIGURE 8. Configuration of the sensors.
Data Analysis of Pantograph Elevation
The elevation process is what gives the subway its power. The process itself is powered by high-pressure air, which pushes the pantograph toward the catenary [26]. Therefore, the contacting force should increase linearly during this process.
As shown in Figure 9, the contacting force increased from 0 to 118.24 N and stayed at 110 N with a standard deviation of 1.81 N. The initial contact position was 351.16 mm from the left support of the arc. The force’s magnitude calculated from the strain response agrees with the force that drives the pantograph, and the calculated position fits well with the directly measured result. This monitoring test of the elevation process shows that the algorithm is valid in the static condition.
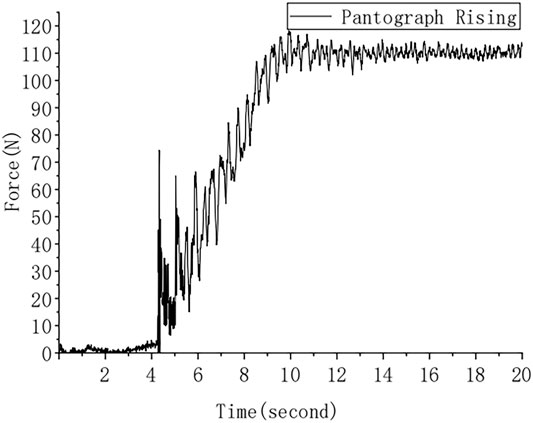
FIGURE 9. Contact force of the elevation process.
Data Analysis of the Subway in Motion
The subway departed from the base making stops at each station. The desired speed was 80 km/h, and the distance between stations was not long enough. Consequently, the vehicle accelerated, leaving the stations, and then decelerated as it approached the next.
It can be foreseen that the contact force would have a magnitude of 120 N with deviation caused by vibration and rail conditions. As presented in Figure 10, going from one stop to the next, the contact force has a maximum of 125.86N, a minimum of 115.71 N, and a standard deviation of 3.23 N. The contact force is constantly greater than 0 N, which means no separation of the pantograph and the catenary.
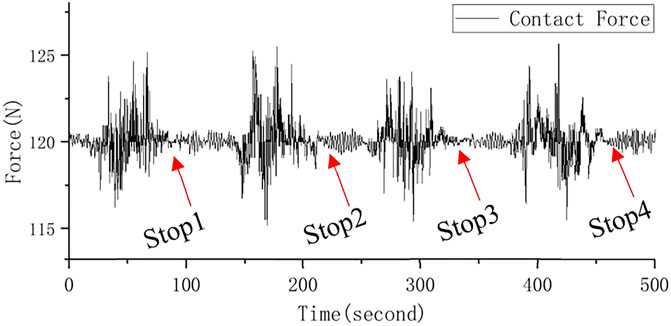
FIGURE 10. In-line contact force variation.
Monitoring the magnitude of the contact force is crucial for SHM of the pantograph–catenary system; equally important is the force’s location detection, as it gives information about possible erosion and fatigue on the carbon slider.
The rigid overhead catenary system has a zigzag shape responsible for the position variation, when the subway is in motion. For example, in Figure 11, the contact position was oscillating between 200 and 600 mm, indicating that the subway was passing through the zigzagged catenary.
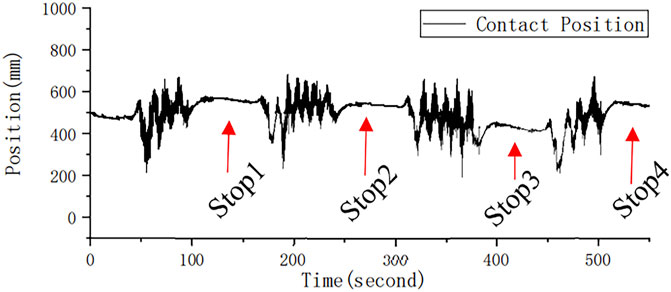
FIGURE 11. Contact force position varying with a “Z” shape manner.
Figure 12 is an enlarged time interval, corresponding to the vehicle departing from one stop to the next. The shift of the contact position is roughly the same as boxed in the figure. Given the symmetrical property of the catenary’s ‘Z’ shape, it is reasonable to conclude that the inversion method is able to detect the location of the force with minor discrepancy.
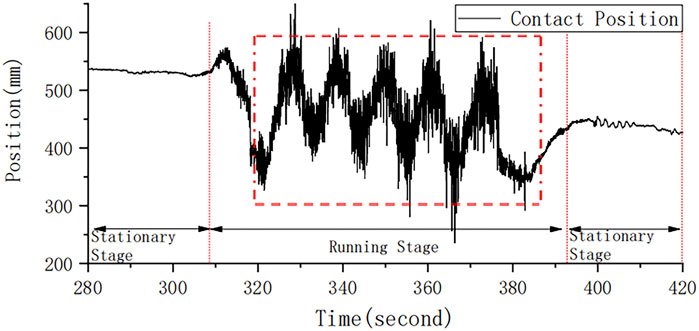
FIGURE 12. Contact position of one interval.
Conclusion
This study proposed an inversion method for calculating and locating the dynamic contact force of the pantograph–catenary system based on its strain response using fiber Bragg grating (FBG) sensors. It has overcome the electromagnetic inference that traditional sensors suffer, making it ideal for the task. The carbon slide on the pantograph has been modeled as simply supported beams for the calculation. This model then guided the design of a structural health monitoring project in Xi’an. After the calibration, the sensing system was tasked with monitoring the progress of the pantograph elevation. Finally, real-time data were collected and analyzed for the subway in motion. The magnitude and the location of the contact force were in good agreement with the prediction; that is, the location result resembles the “Z” shape of the overhead catenary, and the magnitude mainly fluctuates between 115 and 125 N.
The strain response inversion method is shown to be accurate, consistent, and relatively easy to install. Not only does it monitor the force’s magnitude but also the position of the force exerted, giving the SHM system another angle to evaluate the reliability of pantograph–catenary coupling.
Data Availability Statement
The original contributions presented in the study are included in the article/Supplementary Material, and further inquiries can be directed to the corresponding author.
Author Contributions
JL guided the development of the theory and the design of the experiment. SL, YY, and TF were responsible for sensors installation, equipment calibration, and data collection. YW and SL then processed and analyzed the raw data producing usable results and plots.
Conflict of Interest
Author YY and TF were employed by the company Shenzhen JEMETECH Co., Ltd.
The remaining authors declare that the research was conducted in the absence of any commercial or financial relationships that could be construed as a potential conflict of interest.
References
1. Cao B-K. The Development of the Subway in the World Is Striking [J]. Urban Public Transport (2003) 5:33. doi:10.3969/j.issn.1009-1467.2003.05.017
2. Bao-ming H, Jia-hao C, Yun-jie Y, Lei Q, Zhi-xuan Y, Wei D. Statistical Analysis of Urban Rail Transit Operation in the World in 2019: A Review [J]. Urban Mass Transit, 2020, 33(01):4–8. doi:10.3969/j.issn.1672-6073.202
3. Niu A. Summary of China’s Urban Subway Passenger Volume in 2019 [J]. China Metros (2020)(02) 33–7. doi:10.14052/j.cnki.china.metros.2020.02.008
4. Wang J-P, Zou Y. Optimization of Pantograph Upper Frame Structure Design for Urban Rail Multiple Unit [J]. Urban Mass Transit (2019) 22(07):46–9. doi:10.16037/j.1007-869x.2019.07.011
5. Zai-min L, Zhao-peng Z. Necessity of Reviewing Rules for Interface between Pantograph and Catenary Based on Their Failures [J]. Mod Urban Transit (2016)(2) 36–1. doi:10.3969/j.issn.1672-7533.2016.02.009
6. Zhang S, Fu X-Q, Zhan M-J. Development and Application of on Board Pantograph/ Catenary Dynamic Monitoring System for Changzhou Metro Line 1 [J]. Electric Railway (2019) 30(06):72–4. doi:10.19587/j.cnki.1007-936x.2019.06.017
7. Yang Z-P. Research on Characteristics and Diagnosis of Pantograph/Catenary Contact Force Defects [J]. Electric Railway (2018) 29(01):27–30. doi:10.19587/j.cnki.1007-936x.2018.01.006
8. Yan-Long L, Wen-Feng W, Tao W, Zhi-Peng Y, Wen-Xuan . Defect Analysis, Diagnosis and Treatment of Pantograph/ Catenary Contact Force [J]. Electric Railway (2019) 30(06):56–9. doi:10.19587/j.cnki.1007-936x.2019.06.014
9. Wang Z, Tian L. Research and Application of Comprehensive Evaluation Index for OCS Quality of High-Speed Railway [J]. Electric Railway (2019) 30(S1):144–6. doi:10.19587/j.cnki.1007-936x.2019z.037
10. Gui-Ming M. A Research on the Dynamic Contact Force of Pantograph-Centenary System[D]. Chengdu: Southwest Jiaotong University (2001). doi:10.7666/d.y394565
11. Xiang-Dong L, Sun Z. Key Technology of Pantograph/Catenary Contact Force Detection [J]. Railway Tech Innovation (2012)(01) 72–4. doi:10.19550/j.issn.1672-061x.2012.01.020
12. Xiao-lin Z, Xiao-Rong G, Li W, Ze-yong W. Introduction on the Detection of Pantograph Catenary Contact Force [J]. Railway Qual Control (2010) 38(08):11–3. doi:10.3969/j.issn.1006-9178.2010.08.004
13. Zhu Y. A New Measuring Method of Pantograph Contact Force [J]. Rail Transportation Equipment Technology (2004)(03) 32. doi:10.3969/j.issn.1007-6042.2004.03.012
14. Xiao-na Z, Xing-jun W, Gen-Hou X. Catenary Detection System of German High-Speed Railway [J]. China Railway (2008)(09) 60–2. doi:10.3969/j.issn.1001-683X.2008.09.016
15. Koyama T, Ikeda M, Kobayashi S, Nakamura K, Tabayashi S, Niwakawa M. Measurement of the Contact Force of the Pantograph by Image Processing Technology. QR of RTRI (2014) 55(2):73–8. doi:10.2219/rtriqr.55.73
16. Meng-ying T, Dong Z, Rui-Ping L, Yan L, Ning Z, Gui-ming M, et al. New Contact Force Measuring Method for Overhead Catenary Systems Based on Strain [J]. J Southwest Jiaotong Univ (2017) 52(06):1208–15. doi:10.3969/j.issn.0258-2724.2017.06.023
17. Hong-Nan L, Li-Dong Y, Liang R, Zi-guang J. Design and Development of Structural Health Monitoring System for the Dalian Stadium [J]. J Building Structures (2013) 34(11):40–9. doi:10.14006/j.jzjgxb.2013.11.007
18. Hong-Nan L, Liang T, Ting-Hua Y, Liang R. Design and Development of Structural Health Monitoring System for Long Span Skew Arch Bridge [J]. J Vibration Eng (2015) 28(04):574–84. doi:10.16385/j.cnki.issn.1004-4523.2015.04.010
19. Liang R, Tao J, Dong-Sheng L, Shu-li F, Hong-nan L Application of Small FBG Strain Sensors in Dam Model Experiment [J]. J Vibration, Measurement Diagn (2013) 33(02):277–83. doi:10.16450/j.cnki.issn.1004-6801.2013.02.029
20. Hong-Nan L, Xue-Heng J, Liang R, Jian-yuan C, Tong Z. Application of FBG Strain Sensors to Experiments of Artificial concrete Dam Models [J]. J Dalian Univ Technology (2011) 51(01):103–8. doi:10.7511/dllgxb201101019
21. Zhi-Wei C. Fatigue Reliability Assessment of Multi-Loading Suspension Bridges Based on SHMs [J]. Eng Mech (2014) 31(07):99–105. doi:10.6052/j.issn.1000-4750.2013.01.0043
22. Marco B, Giuseppe B, Andrea C, Lorenzo C. Pantograph–catenary Monitoring by Means of Fiber Bragg Grating Sensors: Results from Tests in an Underground Line. J Mech Syst signal Process (2013) 41(1-2):226–38. doi:10.1016/j.ymssp.2013.06.030
23. Xing L, Jian D, Yao Z, Guo-feng P. Impact of the Aerodynamics of Pantograph of a High-Speed Train on Pantograph-Catenary Current Collection [J]. J Zhejiang University (Engineering Science) (2013) 47(3):558–64. doi:10.3785/j.issn.1008-973X.2013.03.024
24. Liang R, Hong-nan L, Zhi-Qiang H, Jian-bo L, Gao L. Development and Application of FBG Strain Sensor with Enhanced Sensitivity in the Model Vibration experiment [J]. J Optoelectronics·Laser (2008)(11) 1437–41. doi:10.3321/j.issn:1005-0086.2008.11.003
Keywords: pantograph, dynamic contact force, inversion, structural health monitoring, FBG sensor
Citation: Liu S, Wei Y, Yin Y, Feng T and Lin J (2021) Structural Health Monitoring Method of Pantograph–Catenary System Based on Strain Response Inversion. Front. Phys. 9:691510. doi: 10.3389/fphy.2021.691510
Received: 06 April 2021; Accepted: 19 May 2021;
Published: 07 June 2021.
Edited by:
Liang Ren, Dalian University of Technology, ChinaReviewed by:
Peng Zhang, Dalian Maritime University, ChinaXuemin Chen, Texas Southern University, United States
Tao Jiang, Shantou University, China
Copyright © 2021 Liu, Wei, Yin, Feng and Lin. This is an open-access article distributed under the terms of the Creative Commons Attribution License (CC BY). The use, distribution or reproduction in other forums is permitted, provided the original author(s) and the copyright owner(s) are credited and that the original publication in this journal is cited, in accordance with accepted academic practice. No use, distribution or reproduction is permitted which does not comply with these terms.
*Correspondence: Yibo Wei, weiyibo1995@gmail.com