 Jun Hu
 Chengbin Chu
 Ling Xu1
 Peng Wu
 Hui-jia Lia
95% of researchers rate our articles as excellent or good
Learn more about the work of our research integrity team to safeguard the quality of each article we publish.
Find out more
ORIGINAL RESEARCH article
Front. Phys. , 09 August 2021
Sec. Social Physics
Volume 9 - 2021 | https://doi.org/10.3389/fphy.2021.687883
This article is part of the Research Topic Data-Driven Mathematical and Statistical Models of Online Social Networks View all 16 articles
The past years have witnessed increasingly widespread terrorism, violently destroying world peace and regional prosperity. Therefore, uncovering terrorist plots has become the most crucial step for eliminating terrorist attacks. However, with the terrorist scheme being disguised under the huge amount of data flow on the internet, identifying terrorist organizations still remains challenging. Since many terrorist organizations are prone to launch terrorist attacks together, here, we model their relationships as a Terrorist Organization Alliance (TOA) network and propose a novel method to identify the key terrorist organizations in the TOA network. The TOA network utilizes existing key nodes in order to extract useful information, and, with the help of the entropy weight method, the new solution to the TOA network is effective and precise. The experiments are performed on the dataset from the Global Terrorism Database, and the results are statistically validated through t-tests and convergence analysis. Compared with the traditional methods, our method is proven to be superior in terms of measure the harm of terrorist attack organizations and find the key terrorist organizations.
In recent years, terrorist attacks have happened frequently around the world. With the rapid and widespread data flow on the internet and media contents, terrorist attacks are becoming increasingly serious. Terrorism has a significant and lasting impact on the social security, political process, and social ecology of all countries [1, 2]. The task of counter-terrorism and terrorism prevention is urgent and arduous; however, the cost is extremely expensive.
Globally, with terrorist organizations such as Al-Qaeda (and the extremist group Islamic State in 2017) suffering heavy blows, terrorist organizations have begun to change their operational strategies. Their activity areas have begun to show a diffuse expansion from the center to periphery, illustrating a new trend of organizational terrorism to individual terrorism, cyber terrorism, and so on. Compared with the government, terrorist organizations are generally relatively weak, and they often cooperate with each other in order to enhance their strength. This is becoming a new trend in the current development of terrorism, manifesting in international cooperation.
In the research of terrorist activity, the traditional studies mostly focus on the forecast of the terrorist attack event based on the terrorist activity characteristic. Xue A. et al (2011) proposed a prediction algorithm PBCS based on context subspace, and it aims to predict terrorist behavior [3]. Nurudeen. M et al. (2018) proposed a hybrid neural fuzzy model in order to predict criminal behavior in a wide range of areas through simulating crime indication events extracted from wide-area surveillance networks [4]. Li Z. et al.(2018) proposed a comprehensive framework that combines social network analysis, wavelet transform, and the pattern recognition approach to investigate the dynamics and eventually predict the attack behavior of terrorist group [5]. According to the new characteristics of terrorist organization cooperation, scholars introduce network analysis methods to the investigation of terrorist organizations and terrorist attacks. Carly et al (2002) analyzed the terrorist network and suggested that the corresponding terrorist attack prevention strategy should be formulated according to the time of the terrorist attack [6]. Li G. et al.(2019) analyzed the construction process of the terrorist attack alliance network and adopted a new dynamic interactive clustering algorithm to analyze the subgroups of tourist organizations [7, 8]. Hakim et al.(2020) studied the role social contexts played in the link between interpersonal networks and social identity dynamics of a mujahid, found that constraints for the participation in different interpersonal networks. The constraints influenced the process of identity negotiation as a mujahid versus alternative identities of a family member and belonging to a neighborhood [9].
There exist various methods to evaluate the importance of nodes in networks, and many are essentially derived from graph theory [10–11] and graph-based data mining [13, 14]. The research on the importance of nodes in complex networks originates from the field of sociological network analysis [15–18]. Freeman and other scholars have done a lot of research on sociological networks in the early stage. Since then, the fields of system science research, information search, and document retrieval have raised similar problems independently and explored the important sections in networks. The importance of nodes in networks has become a basic problem in various research fields of complex networks.
In this paper, we proposed a new way to analyze the key terrorist organizations. In section 2, a definition of the TOA network is provided, and a figure is given to explain the construction process of this network. In section 3, some traditional methods are given to find the key terrorist organizations, and an entropy method to find critical organizations is also given base on these traditional methods. In section 4, we calculate the importance of nodes by using the traditional method and our method, respectively; In section 5, we use the t-test and convergence analysis to test the results, which found that the accuracy of our method is better than that of traditional methods.
Up to now, various countries have been attacked by terrorist organizations, as shown in Figure 1, The frequencies of attacks occurring in South Asia, the Middle East, North Africa, and Sub-Saharan Africa amount to 81%, which means that these places are frequently affected by terrorist attacks. In the future, some countries might also be attacked, and it is thus of great significance to analyze the regular pattern of the terrorist attack is very meaningful. In this section, we first propose a Critical Nodes Finding Model for Terrorist Organization Alliance Networks and present a solution.
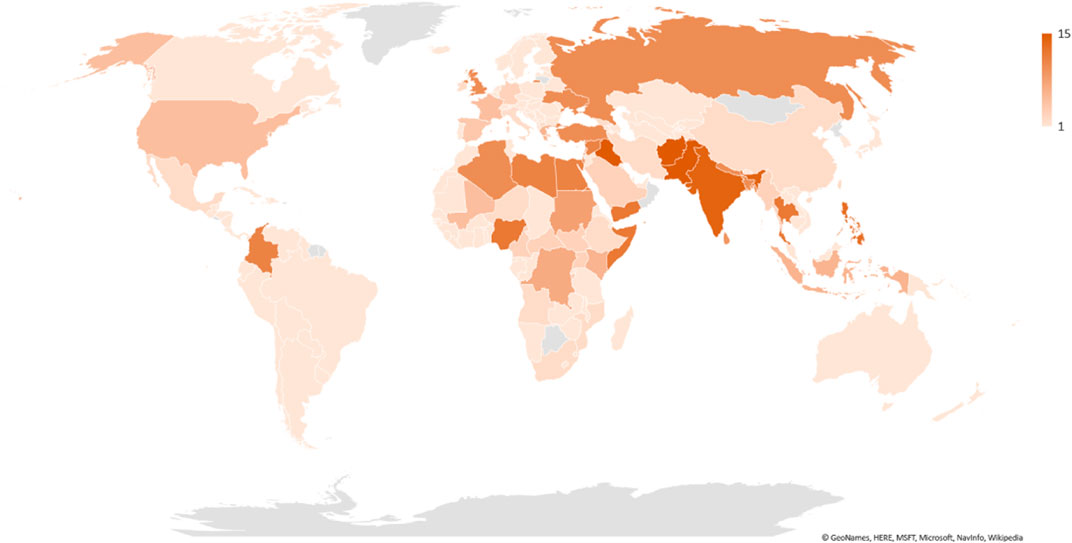
FIGURE 1. The number of countries suffering from terrorist attacks from terrorist organizations: In this map, there are 15 levels (from 1 to 15). If the number of attacks is fewer than 100, the level is 1; if the number of terrorism attacks is more than 100 and fewer than 200, the level is 1. Thus, the corresponding level will be increased by 1 if the number of terrorism attacks is increased by 100.
We know that there exist certain social relationships between terrorist groups, including but not limited to sectarian, blood relatives, ethnic relations, etc. At the same time, within the same regions and similar terrorist organizations of related skill fields, resources, and tasks, there is often cooperation. In terms of terrorist attacks, there will be the phenomenon of coalition, and these coalitions will often make some terrorist attacks escalate.
Figure 2 illustrates the construction process of the terrorist groups network. When a terrorist attack event occurs, some groups usually claim that this attack was launched by them. Based on this fact, we suppose there is a relationship between these groups, and these groups will be linked. Thus, a complex network G = (V, E) of terrorist organizations is built. The point set V(G) is the terrorist groups, and the link in E indicates that they make the same attacks at the same time.
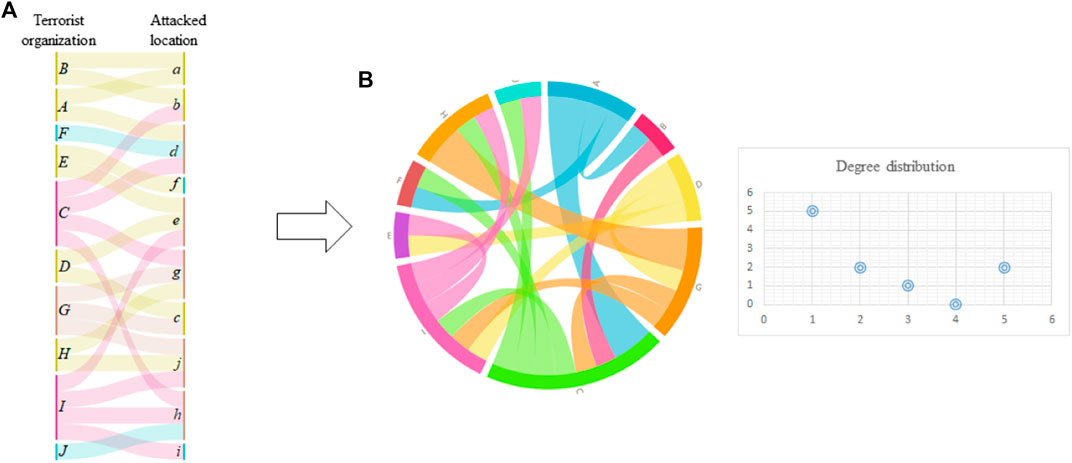
FIGURE 2. Terrorist organization alliance network construction diagram; In (A), the letters A to G are the terrorist groups’ name, and a − j are the locations attacked by a terrorist group; if the terrorist groups attacked the same location in the same time, we think that there is a cause to link these two nodes. Thus we can get the terrorist group network as in (B).
This is a terrorist organizations graph G = (V, E) with n = |V| nodes and m = |E| edges. Various methods are proposed to measure the importance of nodes, such as Degree centrality (DC), closeness centrality (CC), and betweenness centrality (BC) [19]. The TOA network as shown in the Figure 3.
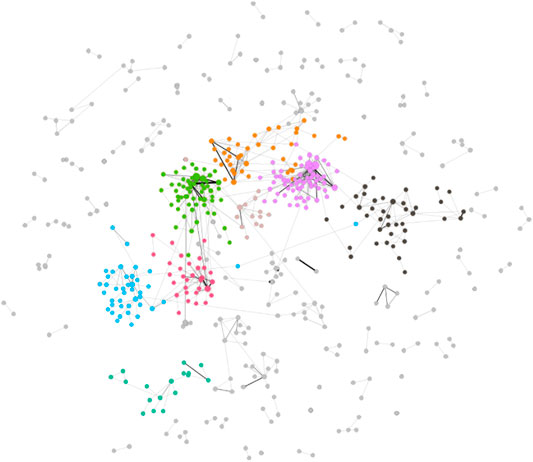
FIGURE 3. Terrorist organization alliance network.
The degree centrality (short for DC) of terrorist organization alliance network’s node i, being denoted as CD(i), is defined as
where i is the focal node, j represents certain node, N is the total number of nodes, and xij represents the connection between node i and node j. The value of xij is defined as 1 if node i is connected to node j, and 0 otherwise.
The betweenness centrality (short for BC) of terrorist organization alliance network’s node i, being denoted as CB(i), is defined as
where gjk denotes the number of the shortest paths between nodes j and k, and gjk(i) means the number of the shortest paths between nodes j and k that go through node i.
The closeness centrality of terrorist organization alliance network’s node i, being denoted as CC(i), is defined as
where dij denotes the distance between node i and node j.
Let A be an n × n similarity matrix. The eigenvector centrality xi of terrorist organization alliance network’s node i is the ith entry in the normalized eigenvector, which belongs to the largest eigenvalue of A. In the matrix A, λ is the largest eigenvalue and n is the number of vertices.
with proportionality factor
The PageRank is a eigenvector centrality which is used to rank the websites, PageRank is one of these key nodes fingding ways for the key nodes. Mathematically, the PR value of terrorist organization alliance network’s node vi at t step is
where n is the total number of nodes in the network, and
In information theory, entropy is defined as measuring the level of uncertainty. The order of the data determines the degree of entropy, i.e., according to the definition of information entropy, we know that the information entropy of this group of data will be greater when a group of data contains more information. Therefore, the larger the entropy of the data, the greater its weight.
Whether people can get high-quality decision-making information is determined by the quality of data. Therefore, it is particularly important to find high-quality data in multiple data. Entropy is utilized to measure the data’s order, which can reflect the importance of data. Thus, based on the information theory, we can find the important factors, which are the high-weight data. In the multi-index decision-making problem, the greater the variability of the index is, the smaller the information entropy is, thus we can more information from this index. Therefore, the weight of this index is bigger than other indexes [20–22].
Definition 1. Among the problems of evaluating n objects and M evaluation indicators, the entropy of the i−th evaluation indicator is
where
Because 0 ≤ fij ≤ 1, we can get
Definition 2 In the problem of (m, n) evaluation, the entropy weight of the first evaluation index is defined as
From the above definition and the properties of the entropy function, the following properties of the entropy weight can be obtained:
Remark 1.
1) When the values of each evaluated object on index i are identical, the maximum value of entropy is 1 and the weight of entropy 0. This also means that the indicator does not provide any useful information to decision makers, and the indicator can be considered to be canceled.
2) When the values of each evaluated object on index i are quite different, the entropy value is small, and the entropy weight is large, it shows that the index provides useful information for decision makers. At the same time, it is pointed out that in this problem, there are obvious differences among the objects in this index, which should be investigated emphatically.
3) The bigger the index’s entropy is, the smaller its entropy weight is. The less important the index is, the more satisfied it is.
4) Entropy weight, as a weight, has special significance. It is not the actual importance coefficient of an index in decision-making or evaluation, but the relative intensity coefficient of each index in the sense of competition when the value of various evaluation indexes is determined after the set of evaluated objects is given.
5) Considering from the information point of view, it represents the extent to which the index provides useful information in this problem.
6) The Size of the Entropy Weight is Directly Related to the Targets Being Evaluated
Algorithm 1 Calculating entropy weight.
(1) Case 1 the Large Value of the indicator, the Better indicator
Case 2 the less value of the indicator, the better indicator
(2) For i ← 1: n for j ← 1: m
end end
(3) For i ← 1: n
end.
(4) For i ← 1: n
end.
In this section, we used a network of Terrorist Organization Alliance Network to demonstrate that the proposed method does a lot better than other centrality approaches when the influential nodes in the network are not entirely determined by a high degree or good robustness. The Terrorist Organization Alliance Network is a network of Terrorist Organizations between 567 organizations with similarities. The Statistical characteristics of the TOA Network are shown in Table 1.
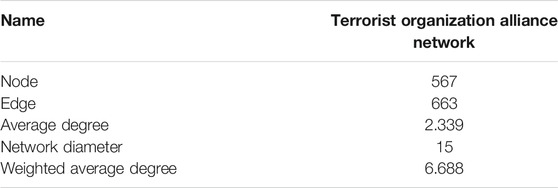
TABLE 1. The statistical features of terrorist organization alliance network.
According to Table 1, we find that the number of nodes in the TOA network is 567, which means that in this network, there are 567 terrorist organizations with a joint attack on the same area. The average degree of this network is 2.399, which means that the number of other organizations joined by each organization is two. The weight average degree of this network is 6.68.
Figure 3 depicts the network topology of the TOA network. As a simple corollary of community funding [23] of our analysis, we found there is a community structure in this network. Thus there is evidence that terrorist organization make attacks with other terrorist organizations. Mining the terrorist organizations for details is very useful. Various community detection algorithms can be applied [24].
As shown in the Figures 4, 5, 6, the double-logarithmic relationship between cumulative node degree function P(k) and degree k, node weight degree function P(k), and weight degree k is described. First of all, we used the power law fitting for the degree distribution and weight distribution and found that all R2 are greater than 0.9, which means that the TOA network is a scale-free network. Thus the TOA network is a social network. And in the TOA network, we find that there are a large number of nodes with degree 1. According to analysis of the source data, most of the organizations carry out the attack once or the event is only between the two organizations creating terrorist attacks. However, such organizations are not rare. It is very likely that these organizations are temporarily organized to launch an attack and then disband or change their names.
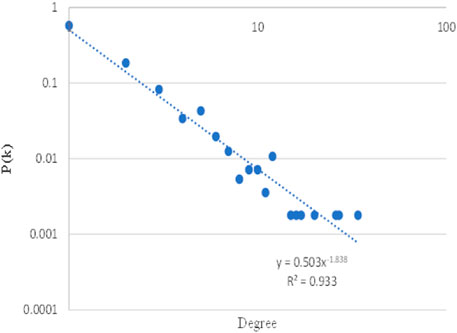
FIGURE 4. The degree of TOA Network: Plot the number of the degree on the vertical Y-axis to logarithmic against weight degree on the horizontal x-axis to logarithmic.
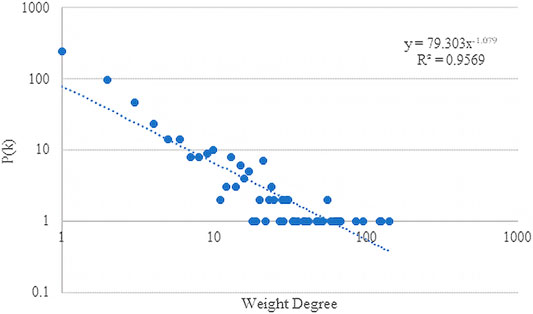
FIGURE 5. The weight degree distribution of the TOA Network: Plot the number of the weight degree on the vertical Y-axis to logarithmic against weight degree on the horizontal x-axis to logarithmic.
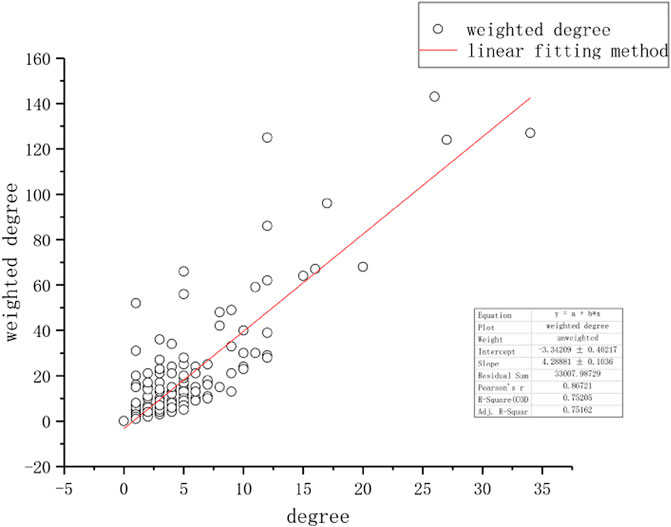
FIGURE 6. The relationship between the degree and the weight degree of TOA Network: The linear relation between the degree and the weighted degree in TOA network is shown in this figure. After applying a linear fitting method, an linear equation, y = 4.28881x − 3.34209, is plotted. Note that the Pearsons r, R-Square, Adj. R-Square are all greater than 0.5, meaning that this fitting is quite appropriate.
As shown in the Figures 7–8, we find that the distribution of the eigencentrality of the TOA network is a power law.
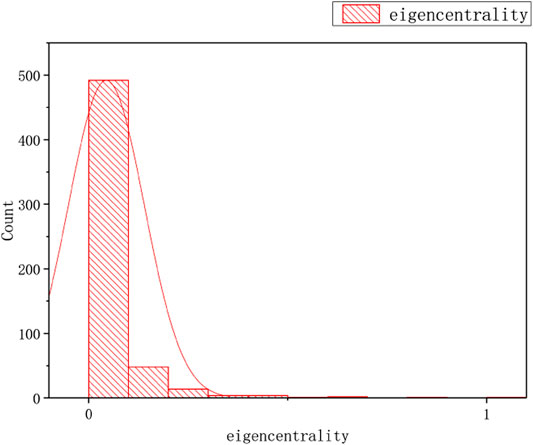
FIGURE 7. The distribution of eigencentrality and RangeRank of the TOA Network: Plot the number of the number of eigencentrality on the vertical Y-axis against eigencentrality on the horizontal x-axis.
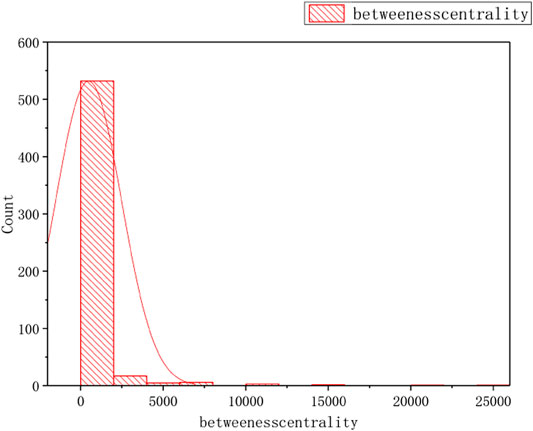
FIGURE 8. The distribution of betweeness centrality of the TOA Network: Plot the betweeness centrality on the vertical Y-axis against betweeness centrality on the horizontal x-axis.
The Figure 9 to Figure 10 display the distribution of CC, BC, EC, and RR, respectively. The distribution of the BC, EC, and RangeRank are the same; however, the distribution of CC is different from the three, which is very interesting.
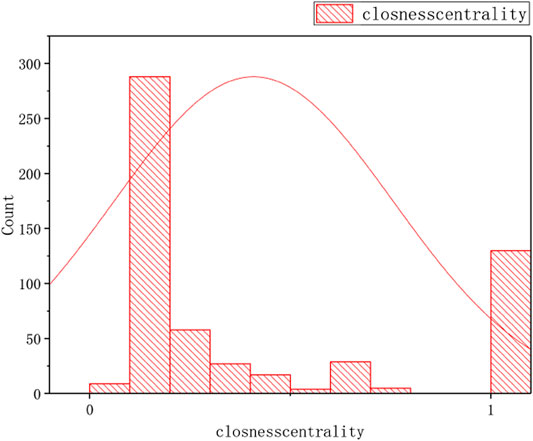
FIGURE 9. The distribution of closness centrality of the TOA Network: Plot the number of the number of closness centrality on the vertical Y-axis against closness centrality on the horizontal x-axis.
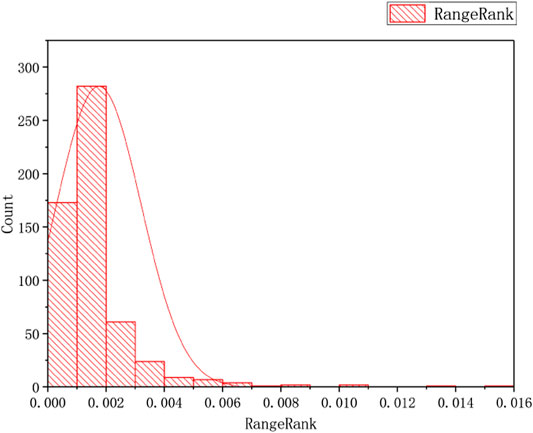
FIGURE 10. The distribution of RangeRank of the TOA Network: Plot the number of the number of RangeRank on the vertical Y-axis against RangeRank on the horizontal x-axis.
The top-20 ranked groups by betweenness centrality (BC), degree centrality (DC), eigenvector centrality (EC), and PageRank (PR) in TOA network as shown in the Table 2.
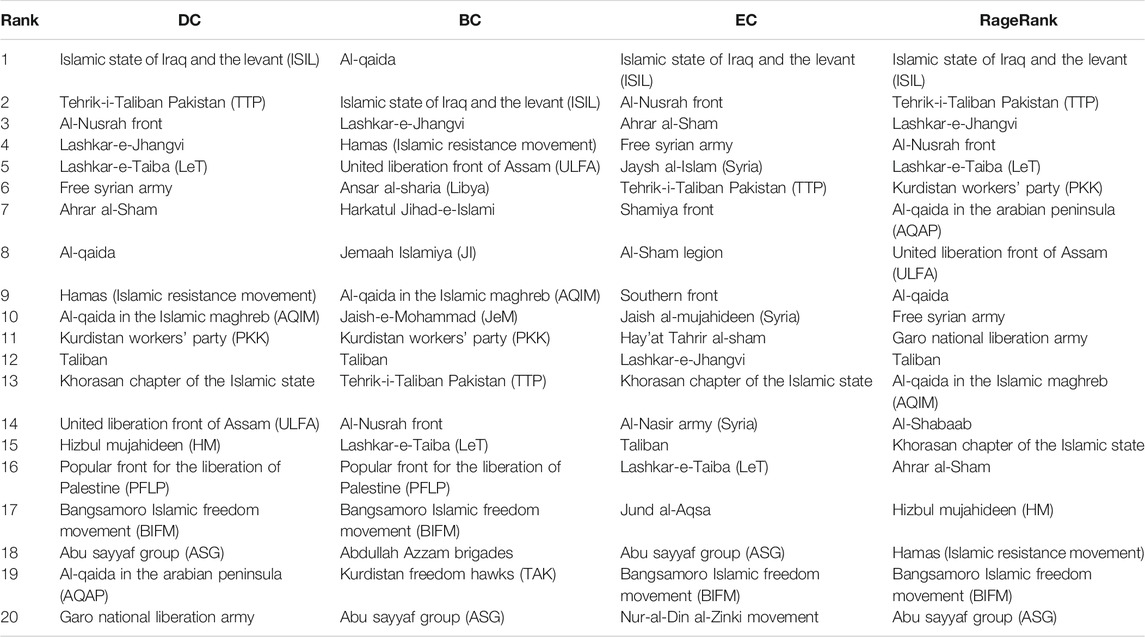
TABLE 2. The top-20 ranked Terrorist Organizations base on degree centrality (DC), betweenness centrality (BC), eigenvector centrality (EC), and PageRank (PR) in TOA network.
Table 2 compares four identity nodes finding ways in the TOA network and gives the top 20 critical terrorist organizations in different ways. The terrorist organization ISIL always occupies the top one in the DC, EC, and RR ways, and in the BC, the ISLT is the second critical organization. Due to the closeness of the 130 Terrorist Organizations (centrality of 1), it is not possible to display these Terrorist Organizations. Comparison of the proposed method ranks ISIL, TTP, AI-Musrah Front, Lashkar-e-Jhangvi, LeT, BIFM, and ASG all as being in the top 20; others are not all in the top 20, as some are in three methods like the Taliban only note in the RangRank and PKK only in the DC and BC, some are in two methods like the Free Syrian Army in the DC and RangRank, some are in one method like the Garo National Liberation Army only in the DC.
In this part, we compare the traditional methods with the results obtain in the DC, BC, CC, EC, and RR. At the same time, from Table 2 and Table 3, we can find the results of these traditional ways are different; thus, a global way to measure the key nodes is very necessary.
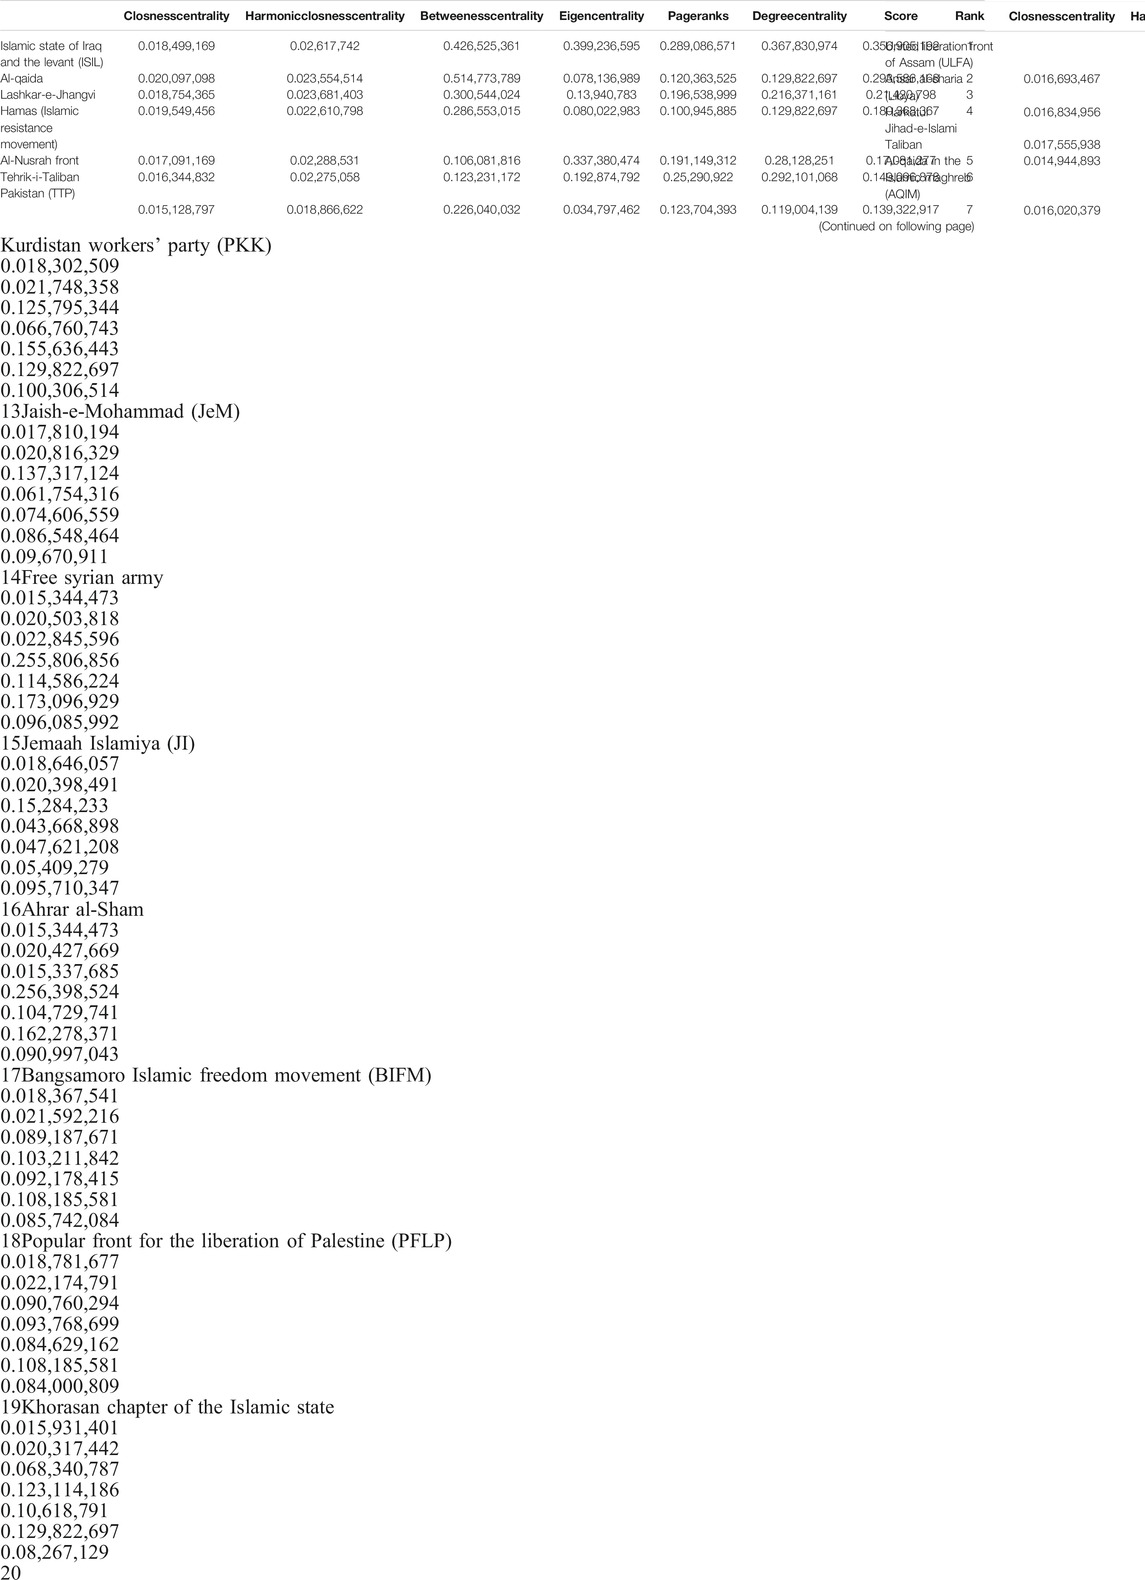
TABLE 3. The top-20 ranked Terrorist Organizations.
In this section, we used the two-tail test to find the significant among these ways. The t-text is shown below.
Where
As shown in Tables 3, 4 and Table 6, H = 0 indicates that the zero hypothesis is not rejected under 5% confidence; H = 1 indicates that the zero hypothesis is rejected, that is, that there is discrimination.
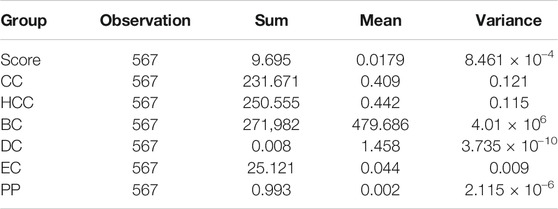
TABLE 4. Statistical description of the results of traditional methods and our ways.
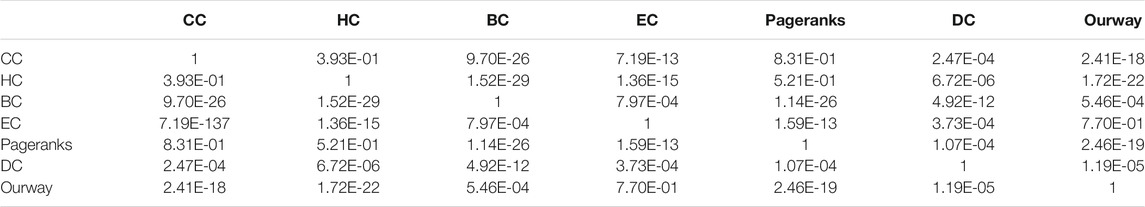
TABLE 5. The p-value of these ways.
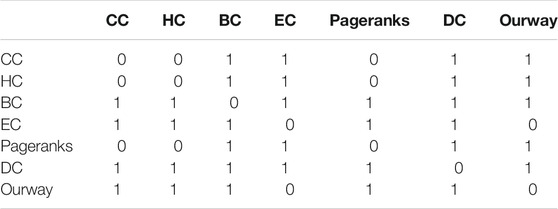
TABLE 6. T-test results of these ways.
At present, the research on terrorist attacks is mainly based on multi-agents, such as Refs. reference [25, 26]. These two articles analyze terrorist organizations through multi-agent simulation and study their change rules. In this paper, the complex network method is used to find the key terrorist organizations. The entropy method is used to measure the harm of terrorist attack organizations and find the key terrorist organizations. Compared with other models, it is relatively novel.
In this paper, we sort the terrorist organizations by using the calculation model of the key nodes in the complex network and find the key terrorist organizations. Through the previous calculation, we find that the terrorist attacks made by terrorist organizations are very harmful, and their concentration will obviously concentrate some weapon resources together, and attack at different locations at the same time, These researches seriously endanger the security of today’s society. The purpose of this paper is to better prepare for the fight against terrorist organizations and the maintenance of world peace. And we observe some characteristics of the TOA network. Based on the traditional methods, a new method is given to find the key nodes as soon as critical organizations. We find that there are significant differences among these traditional methods; comparing these ways, we found that there is no significant difference among CC, HC, and Pageranks, and there is no significant difference between EC and our way. There are significant differences between other indicators. Therefore, through t-tests and Figure 11, we found that there are differences between the integrated score and each centrality, which also shows that the information obtained by traditional methods is local information and cannot fully reflect the importance of nodes. Therefore, the weighted method can better integrate all the information, and we can get the more accurate and important nodes.
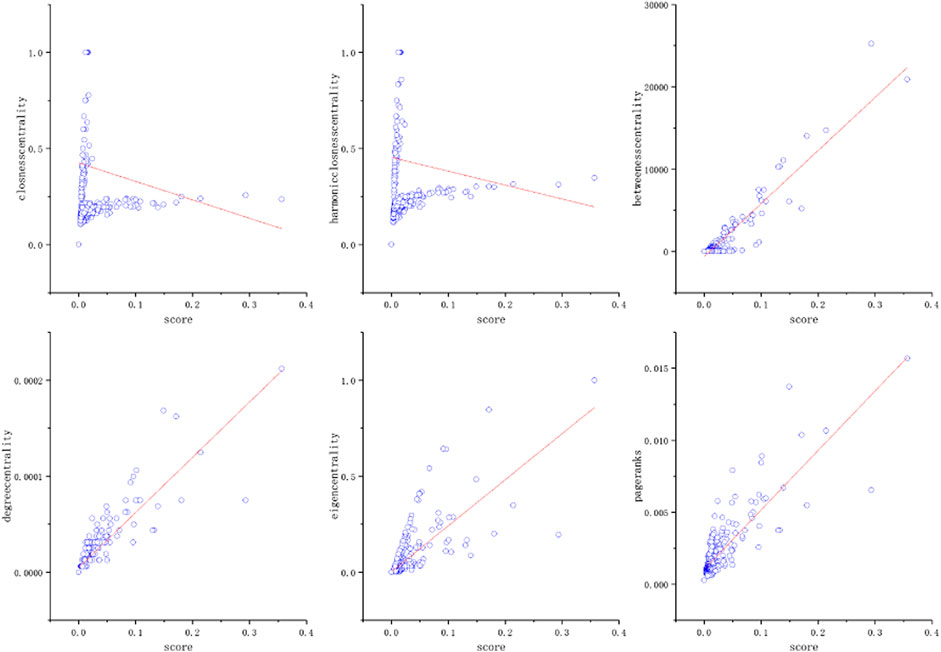
FIGURE 11. The relationship between node strength and different centrality values.
Publicly available datasets were analyzed in this study. This data can be found here: https://www.start.umd.edu/gtd/.
JH: Visualization, Software, Computation, Drawing and Writing CC: Writing-Reviewing and Editing LX: Conceptualization, PW: Investigation, Visualization, Software HL: Methodology, Validation.
This work is supported by the National Natural Science Foundation of China (Nos. 71871233, 71701049, and 717871159), the Fujian Science and Technology Economic Integration Service Platform, Fundamental Research Funds for the Central Universities of China (Nos.2020XD-A01-1).
The authors declare that the research was conducted in the absence of any commercial or financial relationships that could be construed as a potential conflict of interest.
All claims expressed in this article are solely those of the authors and do not necessarily represent those of their affiliated organizations, or those of the publisher, the editors and the reviewers. Any product that may be evaluated in this article, or claim that may be made by its manufacturer, is not guaranteed or endorsed by the publisher.
1. Balcells L, Torrats-Espinosa G, Using a Natural experiment to Estimate the Electoral Consequences of Terrorist Attacks, Proc Natl Acad Sci USA 115 (2018) 10624–9. doi:10.1073/pnas.1800302115
2. Mitts T. Terrorism and the Rise of Right-Wing Content in Israeli Books. Int Org (2019) 73:203–24. doi:10.1017/s0020818318000383
3. Xue A, Wang W, Zhang M. “Terrorist Organization Behavior Prediction Algorithm Based on Context Subspace [C]” in International Conference on Advanced Data Mining and Applications.. Berlin, Heidelberg: Springer, 7121 (2011) 332–45. doi:10.1007/978-3-642-25856-5_25
4. Nurudeen M, Zou B, Zhu C, A Neuro-Fuzzy Crime Prediction Model Based on Video Analysis[J], Chin J Electro, 27 (2018) 968–75. doi:10.1049/cje.2018.02.019
5. Li Z, Sun D, Li B, Li Z, Li A, Terrorist Group Behavior Prediction by Wavelet Transform-Based Pattern Recognition, Discrete Dyn Nat Soc 2018, (2018) 1–16. doi:10.1155/2018/5676712
7. Li G, Hu J, Song Y, Yang Y, Li H-J, Analysis of the Terrorist Organization Alliance Network Based on Complex Network Theory, IEEE Access 7 (2019) 103854–62. doi:10.1109/access.2019.2929798
8. Fang L, Fang H, Tian Y, Yang T, Zhao J. The alliance Relationship Analysis of International Terrorist Organizations with Link Prediction. Physica A: Stat Mech its Appl (2017) 482:573–84. doi:10.1016/j.physa.2017.04.068
9. Hakim MA, Mujahidah DR, Social Context, Interpersonal Network, and Identity Dynamics: A Social Psychological Case Study of Terrorist Recidivism, Asian J Soc Psychol 23 (2020) 3–14.doi:10.1111/ajsp.12349
10. Li S, Zhao D, Wu X, Tian Z, Li A, Wang Z. Functional Immunization of Networks Based on Message Passing. Appl Math Comput (2020) 366:124728. doi:10.1016/j.amc.2019.124728
11. Zhu P, Han J, Guo Y, Lombardi F, Reliability and Criticality Analysis of Communication Networks by Stochastic Computation, IEEE Netw 30 (2016) 70–6. doi:10.1109/mnet.2016.1500221nm
13. Gao C, Fan Y, Jiang S, Deng Y, Liu J, Dynamic Robustness Analysis of a Two-Layer Rail Transit Network Model, IEEE Trans Intell Transport Syst (2021) 1–16. doi:10.1109/tits.2021.3058185
14. Washio T, Motoda H, State of the Art of Graph-Based Data Mining. SIGKDD Explor Newsl 5 (2003) 59–68. doi:10.1145/959242.959249
15. Gao C, Su Z, Liu J, Kurths J, Even central Users Do Not Always Drive Information Diffusion, Commun ACM 62 (2019) 61–7. doi:10.1145/3224203
16. Zhu P, Guo H, Zhang H, Han Y, Chu C, The Role of Punishment in the Spatial Public Goods Game[J], Nonlinear Dyn 102 (2020) 1–10. doi:10.1007/s11071-020-05965-0
17. Zhu P, Hou X, Guo Y, Xu J, Liu J. Investigating the Effects of Updating Rules on Cooperation by Incorporating Interactive Diversity[J]. The Eur Phys J B (2020) 94:58. doi:10.1140/epjb/s10051-021-00059-1
18. Pappi FU, Scott J. Social Network Analysis: A Handbook. Contemp Sociol (1993) 22:128. doi:10.2307/2075047
19. Du Y, Gao C, Hu Y, Mahadevan S, Deng Y. A New Method of Identifying Influential Nodes in Complex Networks Based on TOPSIS. Physica A (2014) 399:57C69. doi:10.1016/j.physa.2013.12.031
20. Bialynicki-Birula I, Mycielski J, Uncertainty Relations for Information Entropy in Wave Mechanics[J], Commun Math Phys 44 (1975) 129.
21. Campbell J. Grammatical Man: Information, Entropy, Language, and life[M]. New York: Simon & Schuster (1982).
22. Devroye L, Gyrfi L, Lugosi G. A probabilistic Theory of Pattern Recognition. Berlin, Heidelberg: Springer Science and Business Media. (1996) 31.
23. Li H-J, Bu Z, Wang Z, Cao J, Dynamical Clustering in Electronic Commerce Systems via Optimization and Leadership Expansion, IEEE Trans Ind Inf, 16 (2020) 5327–34. doi:10.1109/tii.2019.2960835
24. Zhu P, Wang X, Zhi Q, Ma J, Guo Y. Analysis of Epidemic Spreading Process in Multi-Communities. Chaos, Solitons Fractals (2018) 109:231–7. doi:10.1016/j.chaos.2018.02.007
25. Lu P, Yang H, Li H, Li M, Zhang Z, Swarm Intelligence, Social Force and Multi-Agent Modeling of Heroic Altruism Behaviors under Collective Risks[J], Knowledge-Based Syst 214 (2021) 106–725. doi:10.1016/j.knosys.2020.106725
Keywords: terrorist organization alliance, key terrorist, complex network, centrality, social network
Citation: Hu J, Chu C, Xu L, Wu P and Lia H-j (2021) Critical Terrorist Organizations and Terrorist Organization Alliance Networks Based on Key Nodes Founding. Front. Phys. 9:687883. doi: 10.3389/fphy.2021.687883
Received: 30 March 2021; Accepted: 07 June 2021;
Published: 09 August 2021.
Edited by:
Shudong Li, Guangzhou University, ChinaCopyright © 2021 Hu, Chu, Xu, Wu and Lia. This is an open-access article distributed under the terms of the Creative Commons Attribution License (CC BY). The use, distribution or reproduction in other forums is permitted, provided the original author(s) and the copyright owner(s) are credited and that the original publication in this journal is cited, in accordance with accepted academic practice. No use, distribution or reproduction is permitted which does not comply with these terms.
*Correspondence: Peng Wu, d3VwZW5nODg4NTdAZ21haWwuY29t; Hui-jia Lia, SGpsaUBhbXNzLmFjLmNu
Disclaimer: All claims expressed in this article are solely those of the authors and do not necessarily represent those of their affiliated organizations, or those of the publisher, the editors and the reviewers. Any product that may be evaluated in this article or claim that may be made by its manufacturer is not guaranteed or endorsed by the publisher.
Research integrity at Frontiers
Learn more about the work of our research integrity team to safeguard the quality of each article we publish.