 J. R. Nicolás-Carlock
 I. Luna-Pla
- Institute of Legal Research, National Autonomous University of Mexico, Mexico City, Mexico
Corruption in public procurement transforms state institutions into private entities where public resources get diverted for the benefit of a few. On this matter, much of the discussion centers on the legal fulfillment of the procurement process, while there are fewer formal analyses related to the corporate features which are most likely to signal organized crime and corruption. The lack of systematic evidence on this subject has the potential to bias our understanding of corruption, making it overly focused on the public sector. Nevertheless, corruption scandals worldwide tell of the importance of taking a better look at the misuse and abuse of corporations for corrupt purposes. In this context, the research presented here seeks to contribute to the understanding of the criminal conspiracy of companies involved in public procurement corruption scandals under a network and complexity science perspective. To that end, we make use of a unique dataset of the corporate ownership and management information of four important and recently documented cases of corruption in Mexico, where hundreds of companies were used to embezzle billions of dollars. Under a bipartite network approach, we explore the relations between companies and their personnel (shareholders, legal representatives, administrators, and commissioners) in order to characterize their static and dynamic networked structure. In terms of organized crime and using different network properties, we describe how these companies connect with each other due to the existence of shared personnel with role multiplicity, leading to very different conspiracy networks. To best quantify this behavior, we introduce a heuristic network-based conspiracy indicator that together with other network metrics describes the differences and similarities among the networks associated with each corruption case. Finally, we discuss some public policy elements that might be needed to be considered in anti-corruption efforts related to corporate organized crime.
1 Introduction
Corruption is a complex adaptive problem that threatens the integrity of modern societies. According to the United Nations, corruption is a transnational phenomenon that affects all societies in deep and multiple ways, at their political, economic, ecological, and social fronts [1, 2]. This is especially harmful in developing countries where it links to other forms of crime, such as organized crime [3, 4], economic crime, and where, on top of that, delegation of authority takes place [5].
For many years, academic researchers have provided insight into the corruption phenomenon through multidisciplinary approaches [6, 7]. Under these approaches, corruption is broken down into various types of individual or collective behaviors within several processes that affect private and public sectors likewise. Notably, the procurement of goods, services, and works is one of the governments’ activities most vulnerable to corruption, with complex processes and high level of interactions between public officials and private businesses [8]. Here, corruption transforms public state institutions into private entities where public resources get diverted for the benefit of a few. Many legal corruption types are common at all stages of the procurement process, such as embezzlement, bribery, conflict of interest, fraud, conspiracy, and the use of shell companies to alter competition, among others [3, 9]. For those reasons, governments lose a significant amount of funds in corrupt practices, and thus, purchasing is considered a high-risk activity [4, 9].
The vast academic literature on government procurement and auctions is continuously developing sophisticated analyses to tackle fraud schemes in all stages of the process, while there are fewer formal analyses related to linking corporate criminal activities to the ownership and management features and collective behaviors that are most likely to signal corruption regardless of the procurement method [10–12]. The lack of systematic evidence based on real activities on this subject has the potential to bias our understanding of corruption, making it overly focused on the public sector, ignoring the structural dynamics that take place in the ecosystem of private entities (bidders) [13]. This issue is mainly due to the poor access to widely reliable data on the private sector, specifically the management and ownership of companies. On the one hand, the abuse of private (shell) companies is a well-known phenomenon that is well documented in few cases, but most of the time, it requires extensive research on government records, long waiting periods after freedom of information act requests, and handcrafted processing of information afterward. On the other hand, companies involved or misused for corrupt purposes tend to hide or misinform about their management and ownership structure either by being registered off-shore or by using straw men. In the case of the latter, the multiplicity of personnel roles (shareholders, managers, or legal representatives) within or among companies creates unusual corporate profiles that are still far unexplored and that might provide further insight into potential criminal activity. Therefore, the analysis of corruption related to private companies, especially in developing countries’ context, is a relevant aspect at the forefront of international anti-corruption efforts that requires formal and extensive research [13].
Recently, data-driven studies based on complex systems and network theory approaches have delved into the description of the network characteristics of real corporations at the level of board members [14] as well as those that have participated in big corruption scandals [15]. Under a complex systems perspective, corruption can be seen as an adaptive phenomenon that is best understood in terms of the collective behavior of interrelated agents acting as a whole; that is, it could be hypothesized that this phenomenon is dominated by network effects and thus best characterized by unique collective properties that could provide more insight into corruption, organized crime, and cheating cases than by simply looking at isolated actors or events [12, 15–19]. Under this systemic perspective, the players are considered as connected actors on a network, regardless of their underlying interests or motivations, and the goal is to analyze the emerging structure, dynamics, organization, modus operandi, and the role that the actors play in practice as a collective. Linking actors by contracts, labor, or social relations may depict an organized network working for a common goal (win elections), multiple goals (private gain), or yielding criminal conspiracy (agreement to commit illegal acts) between companies bidding or having direct contracts while they intend to remain undetected and camouflage their activity. In public procurement, it is known that networked corruption schemes limit competition and affect the quality and efficacy of services, goods, and activities financed by governments [8, 10, 17]. However, to this day, there is no comprehensive understanding and convincing systematic evidence about the main structural and dynamical features of networked companies that might be able to define signs of corruption in organized crime activity despite the purchasing method.
In this context, the research presented here seeks to contribute to the understanding of the criminal conspiracy of companies involved in public procurement scandals under a network and complexity science perspective. In particular, due to the quality and scope of the data used, we focused on the collective features of the companies at the ownership and management levels in order to describe and identify structural and dynamical patterns that might be able to provide further insight into the corrupt schemes and nature of the cases. As stated above, the multiplicity of personnel roles within or among companies creates unusual corporate profiles that are still far unexplored and that might provide further insight into potential criminal activity. To that end, we make use of a unique microlevel corporate ownership and management dataset of four important and recently documented cases of corruption in Mexico, where hundreds of companies were used to embezzle billions of dollars. Under a bipartite network approach, we explore the relations between companies and their personnel (shareholders, legal representatives, administrators, and commissioners) in order to depict their network structure. Using diverse network metrics, we describe how these companies are not independent but connected with each other due to the existence of shared personnel with role multiplicity. To quantify this behavior, we introduce a heuristic network-based conspiracy indicator that together with other network metrics describes the differences and similarities among the networks associated with each corruption case. Finally, we discuss the advantages and shortcomings of data and network-based approaches, open research, and public policy elements that might need to be considered in anti-corruption efforts related to corporate organized crime.
1.1 Data and Methods
Important remark: The judicial and criminal investigation processes of some of the cases presented in this study are pending; therefore, the present analysis is only valid for academic purposes. For privacy protection, we have held in anonymity all the information regarding the identification of the companies and associated people. The data analyzed during the current study are available online (see Data Availability).
1.1.1 Data
The data used in this study were first gathered by investigative journalists and members of a local citizen participation committee, and it is related to four corruption scandals in public procurement involving three local administrations and the national government in Mexico: Veracruz (Case 1), Puebla (Case 2), Guanajuato (Case 3), and the Federation (Case 4), respectively. A short description of each case is presented below.
In order to have quality datasets that would allow for consistent comparisons among cases, we manually curated and double-verified the original data by using fiscal and official procurement records (when available). In some cases, the information regarding the tendering process and awarded contracts was missing or incomplete. Consequently, having consistent and verified data at the level of contracting bodies, suppliers, or bidders for all scandals was not possible. For this reason, the commonly employed analysis of the procurement environment as a network that considers the connections between the contracting institutions and suppliers, either under a bipartite institution–supplier network or a firm–firm co-bidding network [8, 17, 20], was not possible. However, the information regarding the connections of public servants and business people to their corresponding institutions or companies, respectively (beyond hidden political ties), is an aspect that can be further explored. In particular, the multiplicity of personnel roles within or among companies creates unusual corporate profiles and networks at the level of the supplier’s ecosystem that are still far unexplored and that might provide further insight into potential criminal activity. Therefore, we focused on the collective features of the companies at the ownership and management levels in order to describe and identify structural and dynamical patterns that might be able to provide further insight into the corrupt schemes and nature of the cases.
After curating and cross-validating the records, we came up with datasets that contain information regarding the four roles that comprise the ownership and management of the firms as they appear in the companies’ charters and contracts: shareholders (SHs), administrators (ADMs), legal representatives (LRs), and commissioners (COMs). The date of creation of the companies as well as identifier of whether the company has been classified as shell by fiscal authorities are also provided (more details in the data repository; see Data Availability).
The cases presented in this research fall into a certain type of procurement practices within an environment that deems common in Mexico. Since 2013, the tendency in federal public spending has increasingly turned over the direct contracting and restricted invitations, in substitute to the bidding procedures, to the point that by 2020, over 80 percent of the federal government contracts were directly awarded to companies [21]. This tendency replicates within the states, where heterogeneous legislation often allows budget thresholds to be exceeded, requires fewer requisites for tenders, and not all state governments make calcification and on-site visits [22]. As a consequence of this high-risk corruption context, market concentration and the creation of short-term companies that can offer multiple products and services prevail in the county. When federal or state public officials and private actors bypass legislation to obtain private gain (a corruption or criminal goal), they use companies (existing and new) to divert resources. Many of those companies become listed as shell given tax offenses within the course of three years [23]. Specifically, within the four cases selected for this study, nonstandard practices are often in place, such as bid-rigging, communication between companies during tender process, increased input costs and contract prices, and high degree of discretion of public servants in the application of the public procurement regulatory framework.
These four cases are selected for the following reasons: data availability, the governments assigned contracts to a set of companies that later were prosecuted by fiscal authorities and finally enlisted as shells, and these cases portrayed a great number of companies and personnel involved. Corruption in the cases presumably happened when companies failed to comply with the contracts, diverted public goods, product substitution, and/or simulated operations under Mexican fiscal legislation in order to commit embezzlement, fraud, and money laundering. The data used in the study imply certain limitations. Since most of the information is public or was made public after freedom of information requests, it is possible that governments answered in a restrained fashion, discarding documents and contracts that also relate to the network’s or cartels’ activities. Also, the contracts analyzed for the study contain straw men, criminal impersonation, and inauthentic companies’ address, due to the criminal activities undertaken. And finally, the contract samples are not the result of statistical methods, but a selection of corruption media scandals set by a journalistic narrative; therefore, criminal files may or may not correspond to the grouping of participants. Although the data of the cases do not represent a large-scale sample of the procurement environment, other studies have used media corruption scandals based on government information to describe network structure and dynamics over the time [16, 24]. Hence, the results are not applicable to all procurement environments, but only to procurement and direct contracts activities that have been flagged by the fiscal and prosecution authorities, and where information is publicly available after corruption activity or the use of shell companies has been detected.
A shell company is commonly defined as an entity legally incorporated that, structurally speaking, lacks substantial assets, operations, or even employees, and when used for illicit purposes, the entity is typically oriented to the concealment of beneficial ownership. Likewise, it is characterized by the appointment of informal nominees, such as children, spouses, relatives, or associates who do not appear to be involved in the running of the corporate enterprise [25]. According to Mexican fiscal law, shell companies are categorized as such based on the government registry of tax evasion that is publicly available, when there is missing or in existent address, simulated operations, inauthentic documentation, lack of assets, or issue fiscal receipts to feign operations. Mexican fiscal authorities list them after an investigation that could take months or years after they were established.
Case 1-Veracruz: The data of this case were originally gathered from governmental sources (open to public access under Mexico’s General Law of Transparency and Access to Information and local transparency legislation) by the nongovernmental organization known as Mexicanos Contra la Corrupción e Impunidad (Mexicans Against Corruption and Impunity) and the investigative journalism group known as Animal Político in 2016 [23]. Journalists also undertook field trips to verify shell companies’ addresses. These companies participated in bidding procedures and direct award. At least four state government agencies contracted the group of companies and have been prosecuted for diverting public funds, amounting over 30 million of U.S. dollars between the years 2012 and 2014 [23]. Unlike the other three cases selected for this study, the procurement environment and legal framework in Veracruz favor an array of concentration practices. Although the end recipients of the funds are unclear, the journalist group has reasons to believe that resources were diverted to the political campaign for the national presidency held in 2012. This would explain the participation of a larger number of companies and collaborating under a meticulous design of fraud scheme for over 3 years. The corruption schemes under investigation by the fiscal authorities consisted in the use of straw men, other fiscal offenses, and tax fraud to divert public funds through tenders. In this scandal, there are 354 companies (96 of which are shell) and 306 personnel (or people) associated with those companies.
Case 2-Puebla: The contracts sampled for this case date from 2015 to 2018 where the state and municipal government of Puebla contracted services and goods from companies that were mostly listed as shell by the national fiscal authority. In total, the companies developed contracts over 17 million dollars. The research was made by journalism group Datamos, in coordination with the International Center for Journalists and Connectas [26]. The collection of data methods included filing of freedom of information requests under state legislation and from official websites available by legal transparency mandate (Plataforma Nacional de Transparencia and Compranet). In addition, journalists undertook field trips to verify shell companies’ addresses and also interview several companies’ stakeholders and public officials to validate data. The contracted companies were founded during the years 2012–2015, and three years later, 68 companies were listed as shell companies by the tax federal authority Servicio de Administración Tributaria. At least eleven state and municipal agencies contracted the companies from the sectors of education, infrastructure, health, security, and others. The corruption scheme under investigation by the fiscal authorities consisted in the use of straw men, other fiscal offenses, and tax fraud to divert public funds through tenders. In this scandal, there are 90 companies (87 of which are shell) and 230 personnel associated with those companies.
Case 3-Guanajuato: The data sample comprises the state and municipal governments of Guanajuato. The contracts were assigned to companies that have been listed as shell by the federal fiscal authority during the years 2014–2019. The source of this information is a special report of the Citizenship Committee of the State’s Anti-corruption System, an official agency created by the anti-corruption state law with oversight powers. The committee filed numerous freedom of information requests and appeals to gather the data of the contracts with the state government, 4 municipalities, the state university, and other agencies. The report aimed to evaluate the state’s situation regarding simulated operations and to track public funding diverted to shell companies for over 9 million U.S. dollars [27, 28]. In this case, the corruption scheme under investigation by the fiscal authorities also consisted in the use of straw men, other fiscal offenses, and tax fraud to divert public funds through tenders. There are 110 companies (101 of which are shell) and 511 personnel associated with those companies.
Case 4-Federation: The case was known in the media as the “Master Fraud” (Estafa Maestra) where federal and six state governments channeled public resources to regular and shell companies through state universities. The data were originally gathered from official sources and websites under Mexico’s General Law of Transparency and Access to Information by the nongovernmental organization Mexicanos Contra la Corrupción e Impunidad (Mexicans Against Corruption and Impunity) and the investigative journalism group known as Animal Político [29]. The case sample was made after the general audit authority reviewed the contracts and identified possible fraud, embezzlement, money laundry, and misuse of public resources between the years 2013–2014 for over 380 million dollars. In this case, the government funds were diverted through contracts with public universities that hired shell companies to develop projects and activities, in which the general audit authority identified illegal contracts, fiscal offenses, and tax fraud in tenders. There are 120 companies (51 of which are shell) and 446 personnel associated with those companies.
2 Methods
In this study, criminal conspiracy is seen as an organized crime act or as “an agreement between two or more people to commit an illegal act, along with an intent to achieve the agreement’s goal” (e.g., see Whitfield v. United States, 453 U.S. 209 (2005)). Despite not having real evidence that the companies communicated previously or during the government purchases, we hypothesize that the emergence of networked structures due to the existence of shared personnel among companies represents a relevant proxy to the level of conspiracy of the actors involved; that is, if conspiracy is present, then it is encoded in the structure of the corporate networks.
We consider this a valid hypothesis in the context of the procurement corruption scandals studied here, where the corporate ownership and management information is not readily available or even not existent, and true ownership can be easily concealed. In this scenario, the abuse and misuse of small-size corporations is easily done by (although not restricted to), for example, the use of multiple straw men. Therefore, if conspiracy is encoded in networked structures of companies with shared personnel, network analysis will allow us to identify and quantify the static and dynamic network properties that might be able to signal organized crime and corruption [15, 16].
Under the previous considerations, our analysis is divided into three parts: I) an elemental statistical description of some quantities related to the companies and personnel per case, II) an analysis of the relationships among companies and individuals under a bipartite network analysis perspective, and III) an analysis based on a heuristic conspiracy indicator that together with other network metrics is able to classify and quantify different levels of conspiracy. Below, we present the elements considered for each part of the analysis.
Part I-Elemental corporate features: For each case, the exploratory analysis considers the following basic variables:
• Total number of companies,
• Total number of personnel,
• Number of companies created per year,
• Number of new personnel added per year,
• Number of personnel per role (SHs, ADMs, COMs, and LRs).
• Number of role pairs (these are the number of individuals that fall within the intersection of any role pairs).
• Number of personnel per number of roles performed.
Part II-Bipartite networks: Given the nature of the data, we considered an undirected weighted bipartite network approach in which companies and individuals represent two different sets of nodes that are connected by four types of edges (SHs, ADMs, COMs, and LRs), and where the weight of the edges is given by the number of roles an individual performs within a company. The network properties we considered are as follows [30]:
• Density,
where
• Mean degree,
where
• Mean weighted degree or strength,
where
• Clustering coefficient of Robins–Alexander,
• Number of connected components,
Part III-Conspiracy indicator: According to our hypothesis—if conspiracy is present, then it is encoded in the network structure of companies with shared personnel—one straightforward measure of the conspiracy levels of a given set of companies is the ratio of connected components
All analyses were done using custom Python code. The network metrics were computed using the Python’s NetworkX package [32]. The network visualizations were created using Cytoscape [33].
3 Results
3.1 Part I-Elemental Corporate Features
The main results for the first part of our analysis are presented in Figures 1, 2.
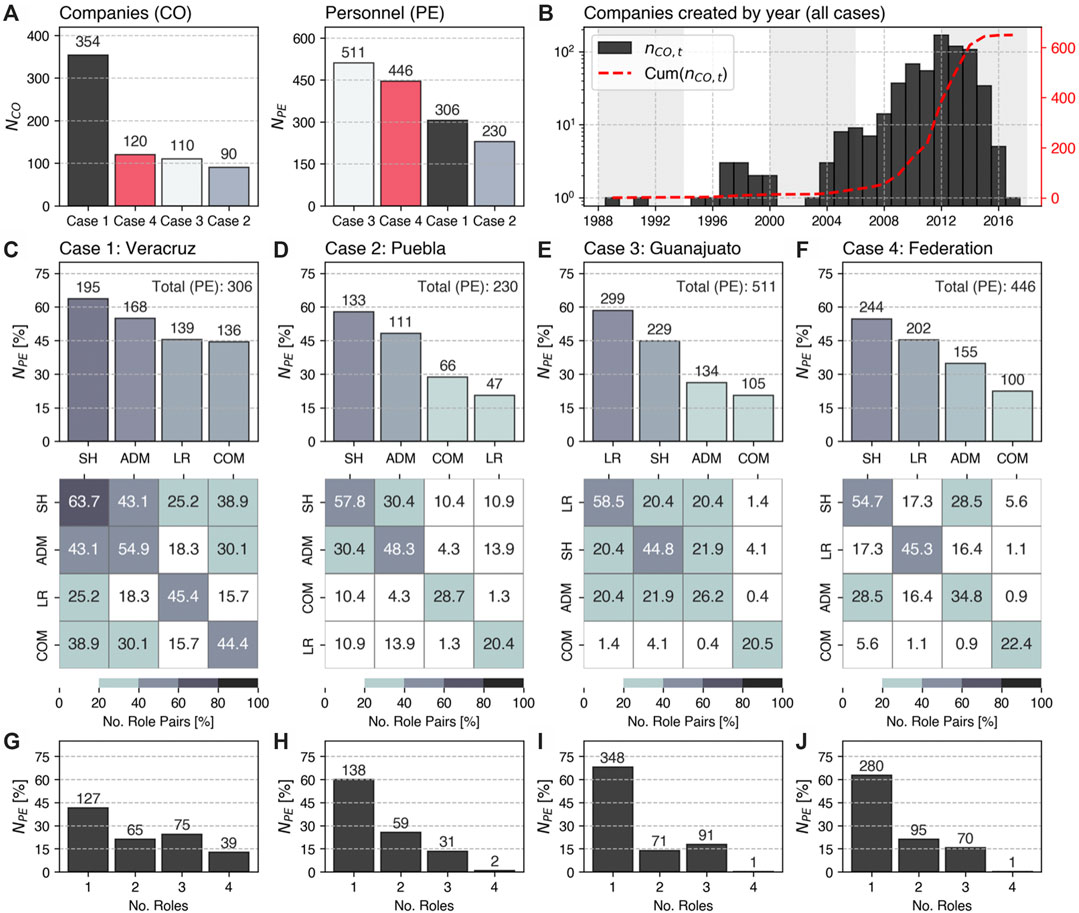
FIGURE 1. Corporate features per case. (A) Number of companies and personnel,
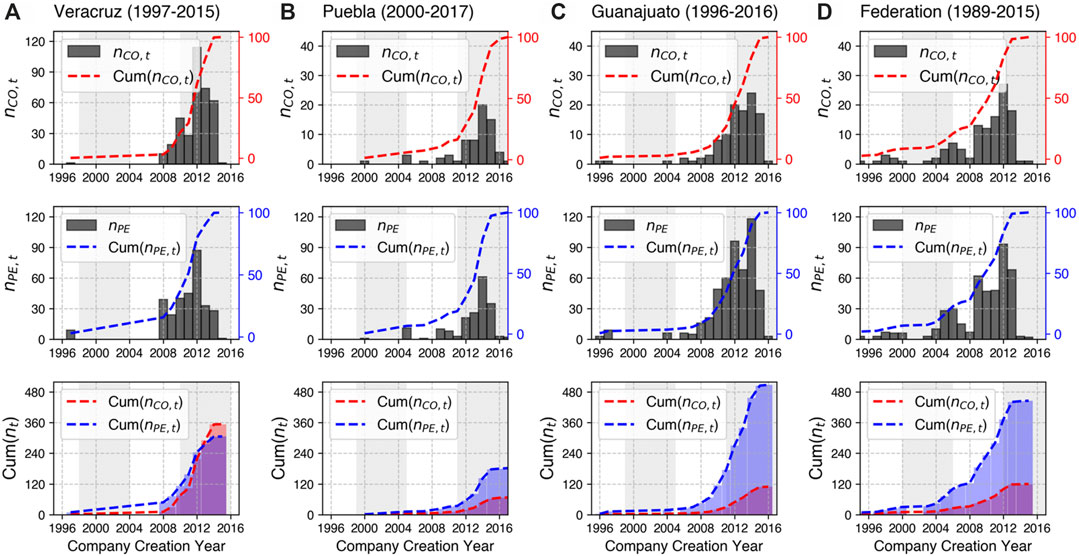
FIGURE 2. Corporate temporal features per case. (A–D) (first row) Number and cumulative percentage of companies created per year,
In Figure 1A, we show the total number of companies,
In Figures 1C–F, we present some ownership and management statistics. First (top of the panel), we show the percentage of personnel according to its role within a company (SHs, ADMs, COMs, and LRs), with exact numbers indicated. Here, it is observed that the most prominent role is the one of shareholder (SH), followed by administrator (ADM) and legal representative (LR), and last, commissioner (COM). Second (bottom of the panel), we show the role-pairs in the form of a co-occurrence percentage matrix. The diagonal reproduces the distribution on top, while off-diagonal elements are associated with the percentage of individuals that fall within the intersection of any role-pairs. The most prominent role-pair is SH–ADM, which in all cases shows up above 20%, followed by SH–LR and ADM–LR that fall closely below 20%. Commissaries seem to be the least important actors as seen for Cases 2–4; however, they recover an important role for Case 1, where the different types of roles are highly connected, indicating a high degree of role multiplicity. This is even clearer in Figures 1G–J, where, in correspondence with the previous panel, we show the personnel profiles according to the number of roles performed. For Cases 2–4, most people (around 60%) perform just one role, while four roles is the least likely profile to be observed. However, Case 1 displays a maximum number of these very unlikely four-role profiles and the least percentage of one-role individuals.
As observed in this part of the analysis, although Cases 2–4 vary in the number of companies and personnel, they share common properties regarding the distribution of role-pairs, role profiles, and temporal dynamics. Case 1 clearly presents an anomalous behavior that deviates from the rest.
3.1.1 Part II-Bipartite Networks
The main results for the second part of our analysis are presented in Figures 3, 4.
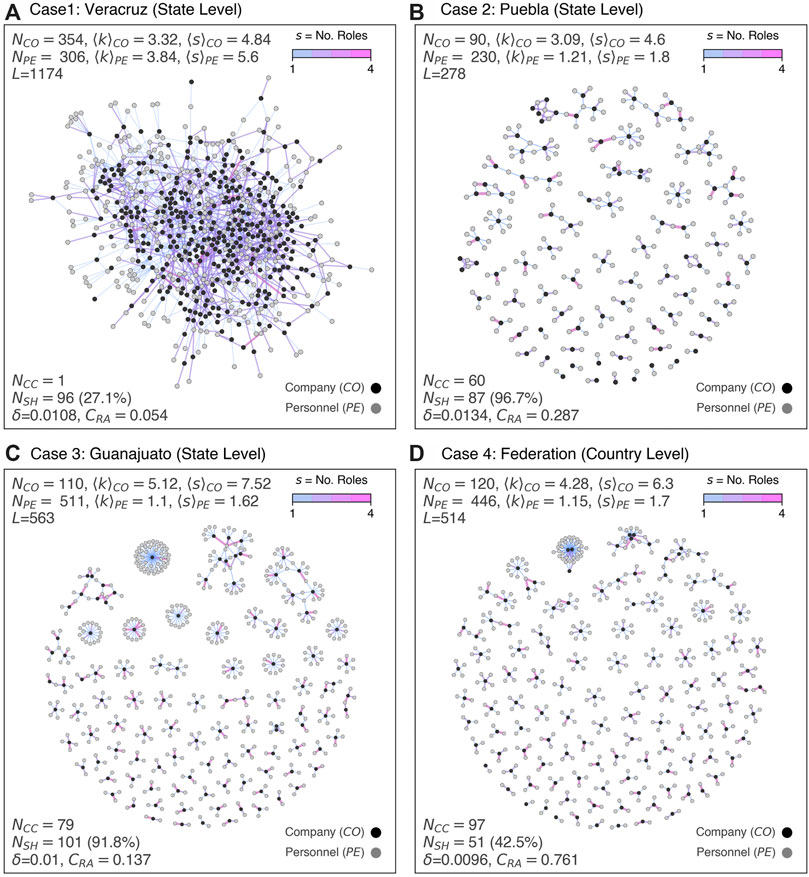
FIGURE 3. Network visualizations and metrics. For each case (A–D), we indicate the number of company nodes,

FIGURE 4. Corporate network dynamics. (A) Mean degree and mean strength difference for company nodes, (B) mean degree and mean strength difference for personnel nodes, (C) density, (D) clustering coefficient of Robins–Alexander, and (E) number of connected components. In (A–E), the temporal variable, Cum
In Figure 3, we show the network visualizations and some network metrics: Case 1 (Veracruz), Figure 3A; Case 2 (Puebla), Figure 3B; Case 3 (Guanajuato), Figure 3C; and Case 4 (Federation), Figure 3D. For each case, we indicate the number of company nodes,
We found a remarkable difference in the network connectivity among cases, with Case 1 being the only one forming one giant connected component, while Cases 2–4 show very similar sparsity, although the density (given by Eq. 1) is quite similar for all cases, with
In the case of the mean degree,
The mean strength,
Notably, the differences and similarities previously described are best appreciated by looking at the evolution of these quantities in time. In Figure 4, we present a comparative corporate network dynamics for all cases with respect to different network metrics. As the time variable, we consider the normalized cumulative number of companies per year, Cum
In Figure 4A, we show the mean degree and mean strength difference for company-type nodes (or the average role multiplicity in a company) as time progresses. Remarkably, Case 1 mimics Case 2 and Case 4 at initial stages; however, the latter has higher values and a different behavior (steeper slope) than the former one. The higher values of Case 3 indicate that, on average, companies tend to have personnel with higher role multiplicity. In Figure 4B, we show the mean degree and mean strength difference for personnel-type nodes (or the average role multiplicity of an individual). Remarkably, Cases 2–4 display identical (almost constant steady) dynamics, while Case 1 clearly differentiates from the rest, indicating a highly irregular increase in the role multiplicity of individuals as time progresses.
The previous observations regarding Case 1 can be complemented and best understood by comparing them with the cumulative number of companies, Cum
In Figure 4C, we show the dynamics of the density, which is almost identical for all cases; in Figure 4D, we show the clustering coefficient of Robins–Alexander, which presents different dynamics for each case, with Case 1 and Case 4 being clearly differentiated at all times, while Cases 2 and 3 only for their later years; in Figures 4D,E, we show the number of connected components. Notably, Cases 2–4 display the same dynamics in their formation of connected components, while Case 1 is completely anomalous.
In Figures 4F–I, we present a comparative analysis for both role multiplicity indicators,
The results presented in this part of our analysis show that network science is a powerful analytical framework that is able to provide a deeper insight into the static and dynamical features of the cases studied. In particular, they clearly highlight Case 1 as a very irregular event compared even with other corruption cases. However, when it comes to having a better measure of the conspiracy levels for each case, it is hard to identify the set of network metrics that might be able to provide that description.
3.1.2 Part III-Conspiracy Indicator
According to our hypothesis—if conspiracy is present, then it is encoded in the network structure of companies with shared personnel—one straightforward measure of the conspiracy levels of a given set of companies is the ratio of connected components,
where
Notice that both
Here, when
In Figure 5, we present our description based on the conspiracy indicator
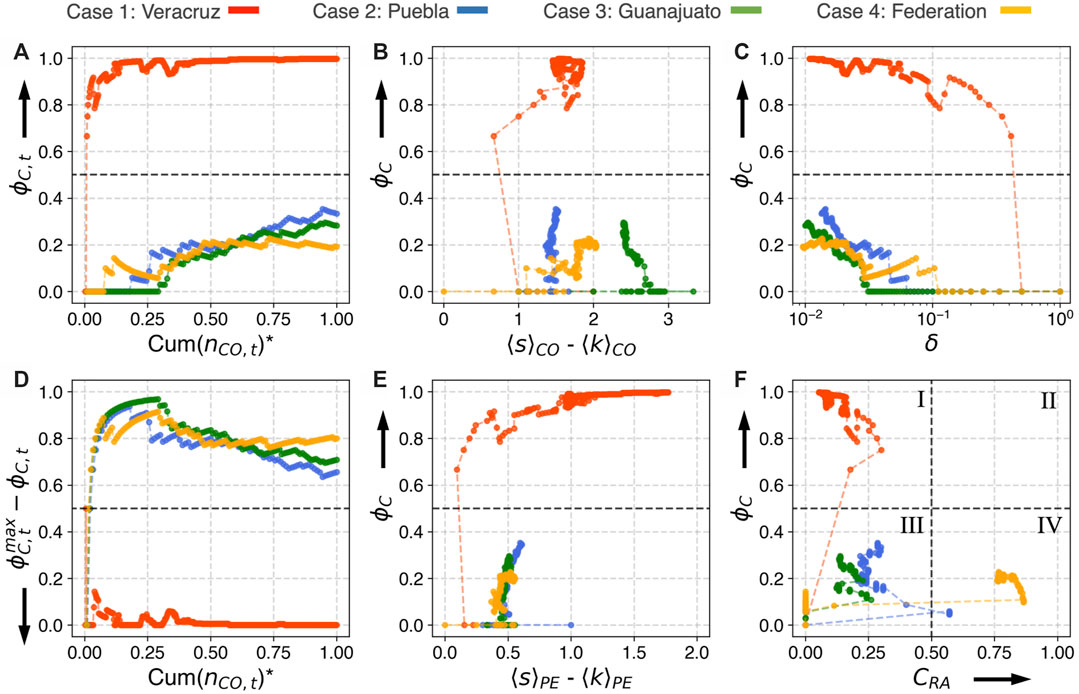
FIGURE 5. Network-based conspiracy description. (A) Conspiracy indicator,
Finally, in Figure 5F, we show its behavior with respect to the clustering coefficient of Robins–Alexander. Considering that both quantities are bounded,
4 Discussion
4.1 Organized Crime, Conspiracy, and Corruption in Procurement
The organized crime studies in law and social sciences are long familiar with the organization’s analytical model of a network [34] and, more recently, with network analysis applied to criminal cases [24, 35]. According to Steffensmeier, the normative concept of organized crime groups is typically defined after three main characteristics: a formalized structure whose primary objective is to obtain money through illegal activities, the structure’s activity has continuity over time, and it maintains its position through use of violence or threat of violence, corruption of public officials, and extortion [34]. Networks as criminal organizations are difficult to prosecute because they camouflage information and actions, and they grant impunity by adding security actors, such as public functionaries and politicians [34, 36], and also by acting in criminal conspiracy.
Conspiracy is a legal crime convenient when there is no substantive proof that an offense has been committed and evidence has been covered, but the agreement for fraud exists, and the centrality of the group activity is apparent as a “single invisible empire” [37]. Therefore, as a complexity problem, the recognition of factors that trigger criminal conspiracy for corruption in public procurement represents a step forward in predicting certain behaviors and discussing control strategies. In this research, criminal conspiracy is considered as an organized crime act or as “an agreement between two or more people to commit an illegal act, along with an intent to achieve the agreement’s goal.” The analysis of the procurement environment as a network commonly considers the connections between the contracting institutions and suppliers, either under a bipartite institution–supplier network or a firm–firm co-bidding network [8, 17, 20]. However, the information regarding the connections of public servants and business people to their corresponding institutions or companies, respectively (beyond hidden political ties), is an aspect that can be further explored. In particular, our results tell of the importance of the analysis of the supplier environment of a given country under a network and complex system approach, and of the relevance of creating network-based corruption indicators at the level of ownership and management of the companies involved in procurement.
The risk in procurement networks has also been qualified by a centrality proxy that opposes competition legislation [17]. The present research argues that while centrality is relevant as a normative risk indicator, it might not be useful in a political context where the rule of law is deteriorating and large-scale public and private actors acting unlawfully is common (see Data and Methods regarding the Mexican scenario).
4.1.1 Complexity Science Approaches to Conspiracy Networks
Corruption is a phenomenon that occurs within the structure and dynamics of complex social, economic, political, and technological systems. Although there is no general consensus on a comprehensive definition for complex system, in this study, we considered the following: complex systems are networks made of a number of components that interact with each other, typically in a nonlinear fashion. Complex systems may arise and evolve through self-organization such that they are neither completely regular nor completely random, permitting the development of emergent behavior at macroscopic scales [38].
As such, corruption in public procurement manifests as a non-separable or intertwined activity that takes places within a complex procurement system defined by contracting institutions, suppliers, public servants, and business people interacting through tendering processes, awarded contracts, labor relationships, and through hidden ties or connections [8, 12, 15]. At the level of ownership and management of the companies involved in procurement, this definition allowed us to hypothesize the criminal conspiracy (as a proxy for corruption) of corporations as an underlying behavior that creates connections among companies with shared personnel and that could be identified and quantified through the macroscopic properties of the corporate networks. First, we found that the companies involved in the scandals have unusual corporate profiles full of multi-role personnel, especially Case 1 (Figure 1). Also, the rate of creation of companies compared to the rate of addition of new personnel displayed some common patterns, except for Case 1 (Figure 2). Then, the analysis was performed under an empirical bipartite company–personnel network approach that allowed us to do the following: i) show how companies indeed nucleate into networks, with different properties, due to the existence of shared multi-role personnel, pointing toward potential criminal conspiracy activity (Figure 3); ii) describe and quantify the subtle differences and similarities in the structure and dynamics of the corporate networks for each corruption scandal (Figure 4); iii) show the degree to which the companies behave in a conspiracy fashion by introducing a conspiracy indicator,
We would like to remark that although our analysis is able to differentiate the corrupt cases in terms of the conspiracy and other metrics (such as the clustering) of the corporate networks, it still needs to be applied in a context that also includes non-corrupt companies in order to test its capabilities to classify corrupt from non-corrupt patterns. Also, one downside of our analysis is that so far, we have no evidence to conclude that these network structures are features of the whole ecosystem. As such, our research does not replace or substitute traditional corruption approaches or research on the procurement environment, but brings more elements to consider regarding corporate risk indicators based on the network properties of companies connected at the ownership and management level before any tendering process or contract is awarded.
4.1.2 Professional Practice and Further Research
Corruption practices in procurement processes have been extensively explored in the literature [8, 39], and it has been relevant to promote standards, legislation, and enforcement mechanisms in order to prevent opportunities for behaviors such as collusion, bid-rigging, and cartel agreements [17, 20, 40, 41], often by looking at the economic incentives and punishment rules [42, 43]. Global strategies seek to increase transparency, convenience, higher revenue in procurement through electronic government procurement [2, 4, 44, 45], and improve the value of reputation of the suppliers with compliance policies [46–48]. The underlying presumption seems to be that governments’ purchasing decisions are influenced by legitimate concerns and governments are willing to work with firms with a reputation, where public–private partnership will be endorsed within the compliance of domestic and international legal framework and codes of ethics [9]. Nevertheless, the assessments and risk metrics in procurement are becoming more comprehensive in order to fully ascertain the presence of organized crime acting in conspiracy and other offenses such as collusion and fraud in a way that they promote competition on the bases of law enforcement scenarios [49, 50]. Governments are the controllers and the responsible parties for enforcing anti-corruption legislation, but fragmentation, electoral interests, or private gain often diverts public officials from public purpose, and corruption is more difficult to detect [51].
The cases presented in this study represent examples of corruption where the government officials such as governors; heads of federal and state agencies, companies, and notaries; and natural persons undertake corruption action plans allegedly for electoral and self-profit ends. In contexts where governments are acting unlawfully, buyers and/or suppliers are acting in conspiracy with the obvious intent to remain undetected, and public officials protect or act in collusion with corporate networks; information traces hidden in journalistic investigations remain one of the best tools to expose criminal activities. Using corruption scandals data precisely benefits scientific analysis by often proving that regardless of a comprehensive legal framework, procurement practices overtake normative rationality, to serve a practical realpolitik system that poses a challenge to the design of corruption proxies and network analysis. Also, by analyzing corporate corruption under a network’s perspective, it is possible to avoid biases, such as taking for granted honesty, firm’s reputation [18], or public officials’ lawfulness, that go beyond the risks posed by single author’s offenses into patterns of racketeering activity [37].
Further research should delve into which corporate characteristics are likely to maximize connectivity by exploring the contribution of each personnel layer to the macro properties of the network together with the heuristic function for alleged conspiracy introduced in this article. Also, with more official information about the cases regarding government participation and financial transactions or taxpayers activities, extra analysis could assess the role of government in perpetuating and protecting corruption networks in procurement. Likewise, the more corruption judicial cases there could be before courts, the better understanding of the wrongfulness of the conspiracy activities could be categorized.
Data Availability Statement
For privacy protection, we have held in anonymity all the information regarding the identification of the companies and associated people. The data is available at the Supporting Data for “Conspiracy of Corporate Networks in Corruption Scandals” repository, https://figshare.com/s/1efd3d6ce33f289044fa.
Author Contributions
ILP reviewed the criminal networks and legal literature, connecting concepts and identifying the contribution of the analysis of cases here presented. JRNC developed the datasets, designed the methodology, and performed the network and statistical analyses. Both authors contributed equally to the interdisciplinary analysis of the results and manuscript preparation and approval.
Funding
Research funded by Universidad Nacional Autónoma de México (UNAM) through the “Programa de Apoyo a Proyectos de Investigación e Innovación Tecnológica” (PAPIIT), Grant No. PAPIIT-IV300217.
Conflict of Interest
The authors declare that the research was conducted in the absence of any commercial or financial relationships that could be construed as a potential conflict of interest.
Acknowledgments
We thank Arturo Ángel, Raúl Olmos and Yosune Chamizo, members of the investigative journalism group, Animal Político, and the non-governmental organization, Mexicanos Contra la Corrupción e Impunidad, for the access granted to their data records on the “Veracruz” and “Federal” cases. We thank René Valencia e Israel Velázquez, members of the investigative journalism group, Datamos, for the access granted to their data records on the “Puebla” case. We are thankful for the important work of the Comité de Participación Ciudadana of the state of Guanajuato, México, that lead to the data for the “Guanajuato” case. We also are thankful to all the students that contributed to this research, particularly Alfredo Andrés López Rivas, Ricardo Martínez Morales, Diana Gabriela Baena Rivera, Ana Laura Chávez García, Miguel Ángel Enríquez Gutiérrez and Linda Angulo.
References
2.UNECE. UNECE Standard on a Zero Tolerance Approach to Corruption in PPP Procurement. Implementing the United Nations Agenda for Sustainable Development through Effective. United Nations (2017).
3. Schultz J, Søreide T. Corruption in Emergency Procurement. Disasters (2008) 32(4):516–36. doi:10.1111/j.1467-7717.2008.01053.x
4.WB. Enhancing Government Effectiveness and Transparency. The Fight against Corruption. Global Report. Washington, DC: World Bank (2020). Technical report.
5. DeAses AJ. Developing Countries: Increasing Transparency and Other Methods of Eliminating Corruption in the Public Procurement Process. Public Contract L J (2005) 34(3):553–72.
7. Rose-Ackerman S, Palifka B. Corruption and Government: Causes, Consequences, and Reform. Cambridge: Cambridge University Press (1999).
8. Fazekas M, Cingolani L, Tóth B. A Comprehensive Review of Objective Corruption Proxies in Public Procurement: Risky Actors, Transactions, and Vehicles of Rent Extraction. In: GTI-WP/2016 (2016). p. 3.
9.OECD. Preventing Corruption in Public Procurement. Paris: Organization for Economic Co-operation and Development (2016). Technical report.
10. Reeves-Latour M, Morselli C. Bid-rigging Networks and State-Corporate Crime in the Construction Industry. Social Networks (2017) 51:158–70. doi:10.1016/j.socnet.2016.10.003
11. Lambert-Mogiliansky A, Sonin K. Collusive Market Sharing and Corruption in Procurement. J Econ Manage Strategy (2006) 15(4):883–908. doi:10.1111/j.1530-9134.2006.00121.x
12. Kertész J, Wachs J. Complexity Science Approach to Economic Crime. Nat Rev Phys (2020) 1–2. doi:10.1038/s42254-020-0238-9
13. Fazekas M, Tóth B. Proxy Indicators for the Corrupt Misuse of Corporations. Bergen, Norway: Michelsen Institute (2017).
14. Jeude JAv. Ld., Aste T, Caldarelli G. The Multilayer Structure of Corporate Networks. New J Phys (2019) 21(2):025002. doi:10.1088/1367-2630/ab022d
15. Luna-Pla I, Nicolás-Carlock J. Corruption and Complexity: a Scientific Framework for the Analysis of Corruption Networks. Appl Netw Sci (2020) 5(1):13. doi:10.1007/s41109-020-00258-2
16. Ribeiro HV, Alves LGA, Martins AF, Lenzi EK, Perc M. The Dynamical Structure of Political Corruption Networks. J Complex Networks (2018) 6(6):989–1003. doi:10.1093/comnet/cny002
17. Wachs J, Fazekas M, Kertész J. Corruption Risk in Contracting Markets: a Network Science Perspective. Int J Data Sci Analytics (2020), 1–16. doi:10.1007/s41060-019-00204-1
19. Ferrali R. Partners in Crime? Corruption as a Criminal Network. Games Econ Behav (2020) 124:319–53. doi:10.1016/j.geb.2020.08.013
20. Lyra M, Curado A, Damásio B, Bação F, Pinheiro FL. Characterization of the Firm-Firm Public Procurement Co-bidding Network from the State of Cear’a (brazil) Municipalities. arXiv 2021). preprint arXiv:2104.08547.
21.IMCO. Compras públicas en méxico. competencia: la gran ausente. Mexico: Instituto Mexicano para la Competitividad A.C (2020). Technical report.
22.OECD. Review of Practices of Local Public Procurement in Five Mexican States. Paris: Organization for Economic Cooperation and Development (2015). Technical report.
23.Animal-Político. Animal-Político (2016). El caso de las empresas fantasma de veracruz. Mexico: Animal Político (2016). Technical report.
24. DellaPosta D. Network Closure and Integration in the Mid-20th century American Mafia. Soc Networks (2017) 51:148–57. Crime and Networks. doi:10.1016/j.socnet.2016.11.005
26. Valencia R, Velázquez M. Puebla, fábrica de empresas fantasma. Puebla: Datamos (2020). Technical report.
27. Pizano C, Lab P. Dos empresas contratadas por autoridades de guanajuato están ligadas a la estafa maestra. Anim Político (2020).
28. León G. Dependencias guanajuatenses habrían pagado hasta 193 mdp a empresas fantasmas: Cpc. Guanajuato: Zona Franca (2020).
29. Mcca A. La estafa maestra graduados en desaparecer dinero público. Mexico: Mexicanos Contra la Corrupción and Animal Político (2017). Technical report.
30. Menczer F, Fortunato S, Davis CA. A First Course in Network Science. Cambridge: Cambridge University Press (2020). doi:10.1017/9781108653947
31. Robins G, Alexander M. Small Worlds Among Interlocking Directors: Network Structure and Distance in Bipartite Graphs. Comput Math Organ Theor (2004) 10(1):69–94. doi:10.1023/b:cmot.0000032580.12184.c0
32. Hagberg A, Swart P, S Chult D. Exploring Network Structure, Dynamics, and Function Using Networkx. Los Alamos, NM (United States): Los Alamos National Lab.(LANL) (2008). Technical report.
33. Shannon P, Markiel A, Ozier O, Baliga NS, Wang JT, Ramage D. Cytoscape: a Software Environment for Integrated Models of Biomolecular Interaction Networks. Genome Res (2003) 13(11):2498–504. doi:10.1101/gr.1239303
34. Steffensmeier D, Martens F. Crime: Organized. In: NJ Smelser, and PB Baltes, editors. International Encyclopedia of the Social and Behavioral Sciences. Oxford: Pergamon (2001). p. 2928–34. doi:10.1016/b0-08-043076-7/01850-7
35. Tumminello M, Petruzzella F, Ferrara C, Miccichè S. Anagraphical Relationships and Crime Specialization within Cosa Nostra. Soc Networks (2021) 64:29–41. doi:10.1016/j.socnet.2020.07.011
36. Sargiacomo M, Ianni L, D’Andreamatteo A, Servalli S. Accounting and the Fight against Corruption in Italian Government Procurement: A Longitudinal Critical Analysis (1992-2014). Crit Perspect Account (2015) 28:89–96. doi:10.1016/j.cpa.2015.01.006
37. Sergi A. Organised Crime in English Criminal Law. J Money Laundering Control (2015) 18(2):182–201. doi:10.1108/jmlc-10-2014-0038
38. Sayama H. Introduction to the Modeling and Analysis of Complex Systems. New York: Open SUNY Textbooks (2015). doi:10.7551/978-0-262-33027-5-ch009
39. Fazekas M, Kocsis G. Uncovering High-Level Corruption: Cross-National Objective Corruption Risk Indicators Using Public Procurement Data. Br J Polit Sci (2020) 50(1):155–64. doi:10.1017/s0007123417000461
40. Porter RH, Zona JD. Detection of Bid Rigging in Procurement Auctions. J Polit Economy (1993) 101(3):518–38. doi:10.1086/261885
41. Conley TG, Decarolis F. Detecting Bidders Groups in Collusive Auctions. Am Econ J Microeconomics (2016) 8(2):1–38. doi:10.1257/mic.20130254
42. Olken BA, Pande R. Corruption in Developing Countries. Annu Rev Econ (2012) 4(1):479–509. doi:10.1146/annurev-economics-080511-110917
43. Kwon I. Motivation, Discretion, and Corruption. J Public Adm Res Theor (2012) 24(3):765–94. doi:10.1093/jopart/mus062
44. Concha G, Astudillo H, Porrúa M, Pimenta C. E-government Procurement Observatory, Maturity Model and Early Measurements. Government Inf Q (2012) 29:S43–S50. Government Information Networks. doi:10.1016/j.giq.2011.08.005
45.OECD. Follow up Report on mexico’s Compranet Reform Improving E-Procurement through Stakeholder Engagement. Paris: Organization for Economic Co-operation and Development (2019). Technical report.
46. Klabi H, Mellouli S, Rekik M. A Reputation Based Electronic Government Procurement Model. Government Inf Q (2018) 35(4Supplement):S43–S53. Platform Governance for Sustainable Development. doi:10.1016/j.giq.2016.01.001
47. Haberbush KL. Limiting the Government’s Exposure to Bid Rigging Schemes: A Critical Look at the Sealed Bidding Regime. Public Contract L J (2000) 30(1):97–122.
49. LaCasse C. Bid Rigging and the Threat of Government Prosecution. RAND J Econ (1995) 26(3):398–417. doi:10.2307/2555995
50. Velasco RB, Carpanese I, Interian R, Paulo Neto OCG, Ribeiro CC. A Decision Support System for Fraud Detection in Public Procurement. Intl Trans Op Res (2021) 28:27–47. doi:10.1111/itor.12811
Keywords: corruption, conspiracy, corruption networks, social network analysis (SNA), complex networks, complex systems, social physics, legal studies
Citation: Nicolás-Carlock JR and Luna-Pla I (2021) Conspiracy of Corporate Networks in Corruption Scandals. Front. Phys. 9:667471. doi: 10.3389/fphy.2021.667471
Received: 13 February 2021; Accepted: 14 May 2021;
Published: 09 June 2021.
Edited by:
Pierpaolo Vivo, King’s College London, United KingdomReviewed by:
Haroldo V. Ribeiro, State University of Maringá, BrazilMihaly Fazekas, Central European University, Hungary
Copyright © 2021 Nicolás-Carlock and Luna-Pla. This is an open-access article distributed under the terms of the Creative Commons Attribution License (CC BY). The use, distribution or reproduction in other forums is permitted, provided the original author(s) and the copyright owner(s) are credited and that the original publication in this journal is cited, in accordance with accepted academic practice. No use, distribution or reproduction is permitted which does not comply with these terms.
*Correspondence: J. R. Nicolás-Carlock, am5pY29sYXNAdW5hbS5teA==