 Juan M. Soto
 José A. Rodrigo
 Tatiana Alieva
94% of researchers rate our articles as excellent or good
Learn more about the work of our research integrity team to safeguard the quality of each article we publish.
Find out more
ORIGINAL RESEARCH article
Front. Phys. , 17 June 2021
Sec. Optics and Photonics
Volume 9 - 2021 | https://doi.org/10.3389/fphy.2021.666256
This article is part of the Research Topic Optical Microscopic and Spectroscopic Techniques Targeting Biological Applications View all 24 articles
Optical diffraction tomography (ODT) is a computational imaging technique based on refractive index (RI) contrast. Its application for microscopic imaging of weakly absorbing and scattering samples has been demonstrated by using a specially designed holographic microscope with angular scanning of the coherent sample illumination direction. Recently, an alternative low cost technique based on partially coherent sample illumination (PC-ODT), which is compatible with the conventional wide-field transmission microscope, has been established. In this case, the 3D refractive index distribution of the sample is obtained by deconvolution from a single stack of through-focus intensity images. The performance of PC-ODT has been successfully tested on various fixed specimens (diatom frustule and biological cells) and moving bacteria. Here, we demonstrate that the PC-ODT is an efficient tool for the analysis of living eukaryotic cell dynamics at short- and long-term periods. The COS-7 cells, which hail from the African green monkey kidney, have been chosen for this study. A fast data acquisition setup comprising an optical scanning module can be easily attached to the microscope, and it allows observing cell 3D organelle movements and RI variations, with the required temporal resolution. In particular, a more rapid nucleoli rotation than previously reported has been found. The long-term cell monitoring during necrosis reveals significant changes in cell dry mass concentration obtained from recovered RI contrast.
While the theoretical fundamentals of the ODT were developed more than a half of century ago [1], its applications in high-resolution microscopy have been started relatively recently [2–4]. The widely known ODT modality uses spatially and temporally coherent laser light for sample illumination, indicated throughout the article as coherent ODT (C-ODT). It can be implemented in specially designed holographic microscopes [2–4]. Data acquisition consists in angular scanning of sample illumination directions (i.e., illumination beam rotation) and the corresponding hologram recording. The complex field amplitude of the scattered beam is reconstructed from holograms for every illumination direction. Posterior numerical refocusing and deconvolution allow recovering the 3D sample refractive index (RI) distribution. Note that the C-ODT is based on synthetic aperture microscopy extended to 3D case [5, 6]. This angular scanning is a relatively slow process. To improve temporal resolution of 3D RI imaging up to 10 Hz, a non-interferometric C-ODT technique using limited annular illumination has been recently established [7]; however, the demonstrated lateral (487 nm) and axial (3.4 μm) resolutions are rather low for cell analysis. Another technique which is also based on angular scanning for non-interferometric microscopy has been reported [8], where Kramers–Kronig relations and oblique illuminations are exploited for phase recovery, instead of interferometric measurements. Coherent noise is another limitation of the interferometric C-ODT. Recently, temporally low-coherence light source and a diffraction-based illumination scanning method (using a ferroelectric liquid crystal spatial light modulator for generating the temporally multiplexed sinusoidal patterned beam) have been used to achieve fast (up to 20 Hz) and low-noise 3D RI reconstruction [9].
However, refractive index tomography is also possible to implement in a conventional wide-field transmission microscope obtaining similar results as by C-ODT. It is based on the approach proposed by N. Streibl [10] that allows reconstructing the RI of a studied sample from a stack of through-focus intensity images obtained by simultaneous illumination of the sample from all the directions allowed by the microscope aperture. The experimental implementation of this modality, further referred to as partially coherent ODT (PC-ODT), has been demonstrated in different examples: fibers, spherical particles, diatom frustule, fixed biological cells, and moving bacteria [11–16]. However, probably the main challenge of ODT is the study of cell behavior in its natural environment that has not been reported yet for the case of PC-ODT. Here, we demonstrate the applications of this technique for short- and long-term cell dynamics analysis reaching fast (0.1 s for 60 × 60 × 14 μm3 volume) 3D RI reconstruction with high lateral (125 nm) and axial (270 nm) resolutions. Note that the 3D RI distribution provides valuable information for biomedical cell studies: its shape, volume, dry mass, and internal structure organization that certainly evolve with time.
This work is organized as follows. First, we shortly review the principle of the PC-ODT technique and describe the experimental setup used for its implementation. We pay special attention to the design of the optical refocusing module (ORM) which has to be attached to the conventional wide-field microscope for fast and easy data acquisition. Note that the ORM is easy to incorporate into any commercial microscope, as for the example the one used in this work (Nikon Eclipse Ti-U inverted). The next section is devoted to the discussion of the experimental results. The work ends with concluding remarks.
The goal of the ODT [1] is the recovering of the sample scattering potential defined as
from a series of intensity measurements. Here, k0 is the wavenumber in vacuum, r is a position vector, and n(r) and nm are the RI of the sample and surrounding media, correspondingly. The scattering potential is, in general, a complex valued function
with real and imaginary parts,
Let us consider that the sample satisfies the first-order Born approximation, which is suitable for weakly absorbing and low scattering samples. Under this approximation, the 3D intensity distribution I(r) measured in a bright-field microscope (e.g., a stack of through-focus intensity images) can be written as the convolution of the point spread function (PSF), h (r), of the microscope and the sample’s scattering potential, as demonstrated in Ref [10–14]. By splitting the PSF into its real and imaginary contributions, one obtains the functions hP (r) and hA (r) representing the microscope response to a point scatter, δ(r), and to a point absorber, iδ (r), correspondingly. Then, I(r) can be understood as the linear superposition of the real and imaginary contributions of the scattering potential, respectively, convolved with hP (r) and hA (r), as it follows [11].
with B being the background intensity (un-scattered light). p(r) and therefore nre(r) can be easily recovered from this equation for the case of a non-absorbing sample. For weakly absorbing sample, it can be supposed that the real and imaginary parts of the RI are proportional nim = εnre, where ε takes a small positive value (in the range 10-5–10-3) [13, 14]. Then introducing the effective point spread function
The deconvolution process is usually carried out in the Fourier space [13, 14]. The analytical expressions for the phase and absorption optical transfer functions (which are the 3D Fourier transform of
One of the advantages of PC-ODT is that it can be easily implemented in conventional transmission wide-field microscope (e.g., Nikon Eclipse Ti-U inverted) equipped with a quasi-monochromatic LED illumination source filtered with a band-pass filter (depending on the desired working wavelength). In this work, the sample was illuminated with quasi-monochromatic partially coherent light (λ = 560 nm, band-pass filter with FWHM = 30 nm), and a dry condenser lens (Thorlabs-CSC200 NAc = 0.78) and imaged with an oil-immersed objective (Nikon Plan-Apo, 60x, nimm = 1.518, NAo = 1.45) with a tube lens (fTL = 200 mm). The lateral and axial resolutions of the setup defined as the Nyquist distance [19] are 125 nm and 270 nm, correspondingly.
The 3D through-focus intensity stack required for PC-ODT can be obtained in two different ways: mechanically or optically. The mechanical refocusing consists of changing the distance between the stage of the sample and the objective lenses (for instance, with a motorized piezo stage). However, it is undesirable for high-resolution microscopy (immersed objectives). Conversely, the optical refocusing considered here allows for axial scanning of the sample without moving it physically. It is achieved by incorporation of an optical refocusing module (ORM) after the intermediate image space, as it is shown in Figure 1. An electrically tunable lens (ETL) with a variable focal length is a crucial element of this module that enables a fast measuring of a through-focus intensity stack I (r).
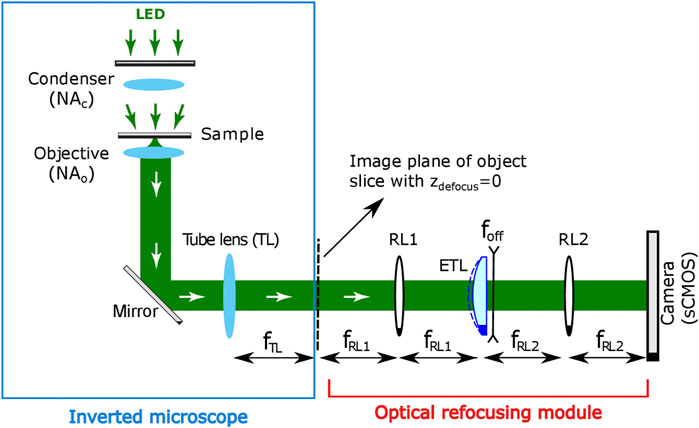
FIGURE 1. Experimental setup for PC-ODT implementation. Optical refocusing module includes an ETL with an integrated divergent offset lens and additional relay lenses (RL1 and RL2) and the camera.
The high-speed ETL (Optotune EL-10-30-C-VIS-LD-MV device in our case) is located in the Fourier conjugated plane with respect to the central slice, zdefocus = 0 μm of the intermediate 3D image. The camera sensor records a 2D image (intensity distribution) corresponding to the transverse xy-object slice located in the microscope’s focal plane (defocus distance zdefocus = 0 μm). The position of the focused plane is optically shifted according to electric current applied to the ETL, therefore yielding the axial z-scanning of the sample almost in real time. Finally, I (r) is acquired by an sCMOS camera (Hamamatsu, Orca Flash 4.0, 16-bit gray-level, pixel size of p = 6.5 μm, in our case) and stored in a computer for its processing.
The shift of the imaged plane (
The culture and preparation of COS-7 cells (hail from the African green monkey kidney) considered in the next section were conducted as follows. First, the cells were cultured in Dulbecco’s modified Eagle medium (DMEM) supplemented with 10% fetal bovine serum (FBS) and incubated at 37°C and 5% CO2 for 4 days. 12 h before fixation, the cells were trypsinized and transferred to the coverslip. Afterward, the cells are immersed in phosphate-buffered saline (PBS) and sealed between coverslips, to prevent evaporation. The RI of the PBS is similar to water.
Living cell monitoring is an important source of information in biophysics and medicine. Below, we consider the application of PC-ODT for the analysis of fast and slow cell RI changes.
The fast monitoring of the sample provided by PC-ODT enables the study of cells with fleeting dynamics (wobbling, flickering, etc.), which exhibit noticeable changes in the time scale below 0.5 s. For evaluating the capability of PC-ODT for the study of intracellular motion, we analyze the behavior of living fibroblast-like COS-7 cell for 9 s. The prepared sample has been considered to observe the process of cell attachment to the substrate. The intensity stack comprises 50 2D images acquired with 2-ms camera exposure time (0.1 s for one stack). During 9 s 25 of such stacks have been measured. Then, the 3D RI distribution in the volume of 500 × 500 × 50 pixels, corresponding to 60 × 60 × 14 μm3, has been obtained by applying the PC-ODT deconvolution procedure explained in Partially Coherent-Optical Diffraction Tomography Principle. The temporal evolution of two RI tomograms at z = 0 μm (the cell is attached to the substrate) and z = 4 μm is presented in Supplementary Video S1. Alternatively, the temporal evolution of 3D RI distribution can be observed in Supplementary Video S2, where the dynamic cell is shown as a volumetric reconstruction with a color-coded depth and brightness-coded RI applied for fast and easy cell 3D visualization. We have developed this volumetric reconstruction by using a customized ImageJ macro based on “Z-stack Depth Color Code” and “Clear Volume” plugins [21].
In Figure 2, we show the time evolution of RI at three characteristic planes, at z = 0 μm, z = 1 μm, and z = 4 μm. The slices at z = 0 μm and z = 1 μm (Figure 2A) and (Figure 2B) show intensive activity of lamellipodia, while the indicated filopodium and rear protrusion are immobile. Lamellipodia are a cytoskeletal protein actin projection on the leading edge of the cell. Together with filopodia, they organize process of cell migration. However, while lamellipodia enable an explorative, rather fast random, walk (up to 1.2 μm/s according to Ref [22]), the filopodia promote a more slow ballistic migration guided by external inputs [23]. The sub-second-scale rearrangement of barbed actin filaments of lamellipodia is observed in Figures 2A,B (see also Supplementary Videos S1 and S2). The recent comparative fluorescence and RI microscopic study [24] allows easy identification of the cell organelles in the RI images. Thus (see insets of Figure 2A), the mitochondria network and lipid droplets can be found. At the slice at z = 4 μm (Figure 2C) several organelles including nucleoli immersed in the nucleus are observed. We underline that fibroblast cells often have several nucleoli in the nucleus as in the cases studied in this work. The RI distributions in the plane z = 4 μm demonstrate that the cell exhibits intensive intracellular trafficking, nucleus plication, and counterclockwise rotation.
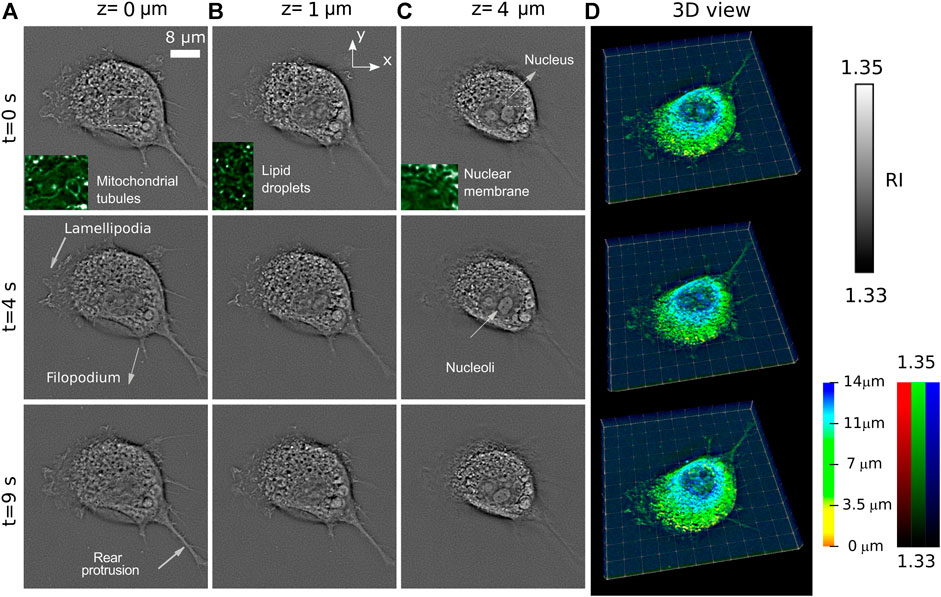
FIGURE 2. Temporal evolution of cell RI distribution observed at three different axially separated slices z = 0 μm (A), z = 1 μm (B), and z = 4 μm (C) of a living COS-7 cell immersed in PBS solution. (D) 3D rendering with a color-coded depth and brightness-coded RI applied.
This cell activity is also reflected in Figure 2C, where 3D rendering of the entire cell at different moments of time is shown. The visualization principle is the same as in the Supplementary Video S2.
Let us consider now more rapid changes of this cell. In Figure 3, four consecutive frames (each pair separated by only 0.36 s) have been analyzed for the planes z = 0 μm and z = 4 μm. Along with RI distributions, we also include speed map plots (see enlarged images, green arrows) of the structures inside the nucleus for studying the rotation motion of its internal organelles. The speed maps have been obtained by using PIVlab plug-in (a digital particle image velocimetry tool) available for MATLAB [25] that performs a multipass window deformation ensemble correlation widely applied in particle velocimetry applications [26]. Thus, by considering the correlation between consecutive image pairs, one can obtain the velocity of each region of the cell. Note that every speed arrow corresponds to a region of 7 × 7 pixels. Thanks to the streamlines of this speed vector field, one is able to characterize the motion of organelles inside the entire cell. A higher activity is observed inside the nucleus, in the form of a relatively fast rotation. It is observed that the speed field magnitude is variable within the range 0.18–1.4 μm/s, with certain tendency to vorticity particularly noticeable at z = 4 μm. The nucleus is rotated around an axis perpendicular to the substrate with a speed about 3 degrees/s.
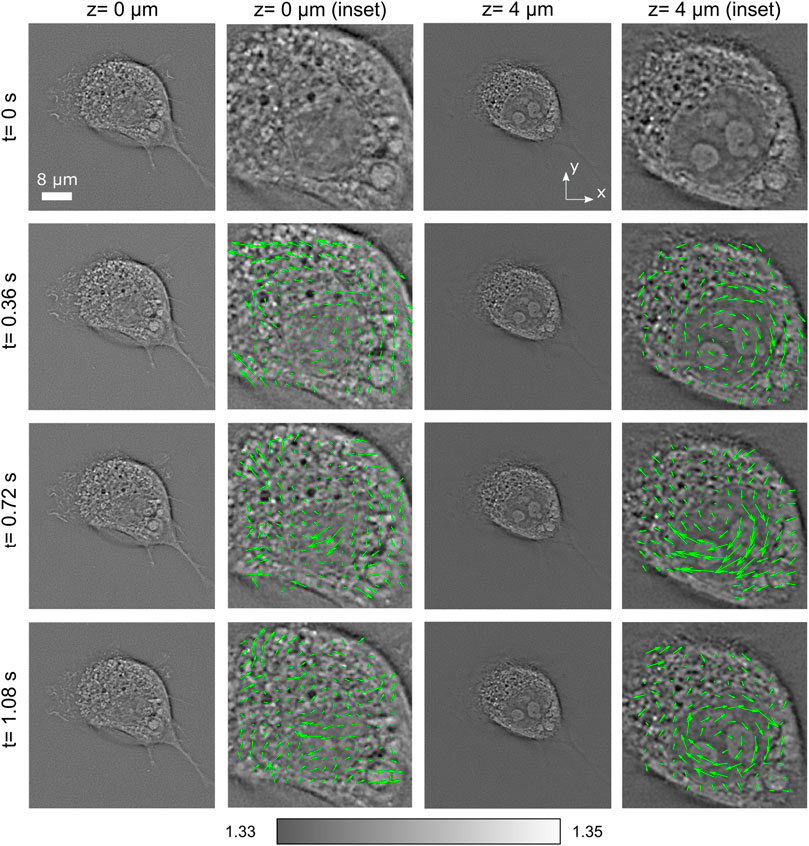
FIGURE 3. Short-term evolution of RI slices of a living COS-7 cell, along with a speed map plot representing the velocity field of the cell structures. The speed field magnitude is variable within the range 0.18–1.4 μm/s. Certain tendency to vorticity is particularly noticeable at z = 4 μm.
Note that the fibroblast cells often display a high nuclear rotational activity [27]. The nuclear rotation and oscillation are associated with cell movement, mitosis, and necrosis or are induced by external factors, such as mechanical shear stress [28], and have been reported in several publications, but on the larger temporal sampling (minutes). The entire nucleus rotation of the order 10-20 degrees/min (0.2-0.3 degrees/s) has been recently observed using C-ODT [24]. Here, significantly more rapid nucleus rotation (3 degrees/s) is observed (see also Supplementary Videos S1 and S2). This example illustrates the capability of PC-ODT for fast and high-spatial resolution studies of living cells, in particular their behavior under environmental changes, external force applications [22], differentiation, mitosis, etc.
Apart from short-term dynamics, long-term processes such as cell mitosis (division) or necrosis (death) are also of great interest in biomedicine. Thus, it is important to prove the applicability of PC-ODT for this type of studies, where the observation can take minutes or even hours. Here, we consider the process of induced necrosis of two COS-7 cells under nutrient deprivation. We scan a field of view (60 × 60 × 16 μm3). 3D intensity stack has been measured within 2 hrs in 5-min regular intervals, and the RI has been recovered. The temporal evolution of 3D RI distribution can be observed in Supplementary Video S3, as a volumetric reconstruction with a color-coded depth and brightness-coded RI applied for fast and easy cell 3D visualization (as in Supplementary Video S2). In Figure 4A, two different z-slices for z = 0 μm and z = 4.5 μm of the sample RI are presented, at four different times (t = 0 min, 15 min, 60 min, and 120 min). At z = 0 μm, the cells are attached to the substrate. At z = 4.5 μm, the cell nucleus with several nucleoli is observed. Also in Figures 2A,B, the mitochondrial network and lipid droplets can be identified. Volumetric cell reconstruction with a color-coded depth and brightness-coded RI for different moments of time is shown in Figure 4B.
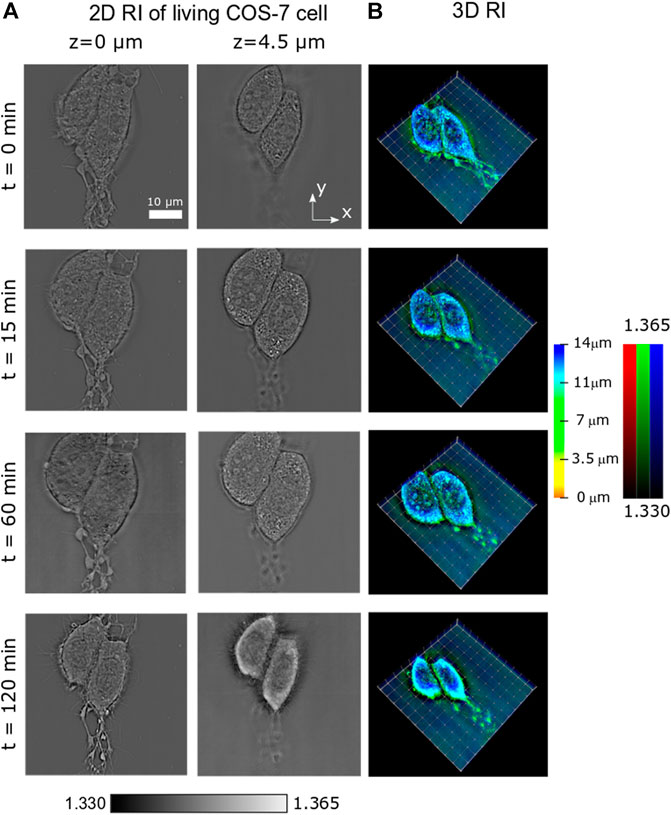
FIGURE 4. Temporal evolution of the RI of a COS-7 cell undergoing necrosis. (A) 2D slices of the RI at two different planes z = 0 μm and z = 4.5 μm. (B) 3D rendering of the cell RI in four moments of time.
The different phases of the cell cycle have been observed during this long-term study. First, the cell swells progressively (from t = 0 min up to t = 60 min, see Figures 4A,B) until a maximum size is reached. Later, the multiple disruption of the outer cell membrane starts, resulting in the efflux of intracellular contents and a dramatic loss of cell volume (compare RI slices in Figure 4A). This behavior can be observed in Supplementary Video S3.
For quantitative characterization of the observed necrosis process, we analyze the average dry mass concentration (DMC), which can be easily obtained from RI contrast. Indeed, it is widely accepted [29–32] that for biological samples immersed in an aqueous medium, there exists a linear relationship linking the DMC of the sample and the real part of its RI as DMC(r)=[n(r)-nm]/a, where a represents the so-called specific refractive index increment, n is the sample’s RI, and nm is the water RI. Although the cell chemical composition is variable, an average value around a = 0.0018 dL/g is usually used within the light visible range when nucleated cells are considered [30, 32].
To obtain the average DMC, the reconstructed RI stack must be split into cell and background (surrounding medium). The applied segmentation algorithm takes into account the gradient and the absolute value of the sample RI. The 3D image regions that simultaneously satisfy both
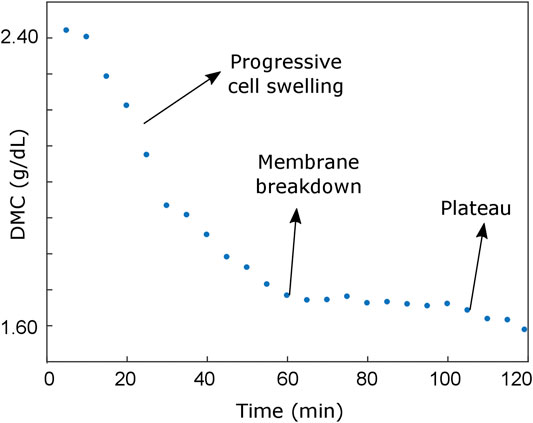
FIGURE 5. Dry mass concentration evolution during the experiment, which enables the identification of two different cell behaviors during the necrosis: an initial progressive cell swelling (characterized by an approximately linear decrease of the average DMC) and a plateau region corresponding to the cell shrinking process.
The cell death phenomenon is a topic of great interest in biology and medicine [33–36], and PC-ODT seems to be a suitable tool for this study. Note that data for long-term cell temporal evolution observation can be acquired automatically by programmable activation of both ETL and camera sensor.
It has been demonstrated in two examples of living eukaryotic cell that by using the 3D RI distribution obtained with PC-ODT, it is possible to study a variety of biological physiological changes in living cells at different time intervals from sub-seconds to hours. We have demonstrated that fast 3D RI monitoring allows revealing sub-second range cell organelle activity (nucleoli rotation and lamellipodia movements), which requires further biological study. The simple relation between the RI and dry mass provides biologically meaningful quantitative information for cell analysis, in particular for the study of cell necrosis, apoptosis, mitosis, and other processes in a natural environment. We conclude that PC-ODT, feasible in the conventional wide-field microscope with an automatized refocusing module, is a viable alternative to C-ODT, realizable in the commercially available holographic microscopes [32, 33], for fast high-resolution quantitative study of living cells.
The raw data supporting the conclusions of this article will be made available by the authors, without undue reservation.
JS performed the experiments. JR and TA supervised the project. All the authors wrote the manuscript and revised the results.
The Spanish Ministerio de Ciencia e Innovación is acknowledged for the project PGC2018-095595-B-I00 (MCI/AEI/FEDER, UE).
The authors declare that the research was conducted in the absence of any commercial or financial relationships that could be construed as a potential conflict of interest.
The samples were prepared by JS during his stay in the laboratory of nanophotonics, in the Institut d’Optique (University of Bordeaux), under the supervision of Pierre Bon and Laurent Cognet.
The Supplementary Material for this article can be found online at: https://www.frontiersin.org/articles/10.3389/fphy.2021.666256/full#supplementary-material
Supplementary Video 1 | The temporal evolution of COS7 cell refractive index tomograms at z = 0 μm (where the cell is attached to the substrate) and z = 4 μm. Lamellipodia movements (left panel) and nucleus rotation (right panel) are observed during 9 s.
Supplementary Video 2 | The fast dynamics of COS7 cell is shown as a volumetric reconstruction with a color-coded depth and brightness-coded refractive index (different perspectives). Observation time 9 s with an interval of 0.36 s (repeated two times).
Supplementary Video 3 | The slow dynamics of COS7 cell is shown as a volumetric reconstruction with a color-coded depth and brightness-coded refractive index (different perspectives). Observation time 2 hours with an interval of 5 min.
1. Wolf E. Three-dimensional Structure Determination of Semi-transparent Objects from Holographic Data. Opt Commun (1969) 1(4):153–6. doi:10.1016/0030-4018(69)90052-2
2. Haeberlé O, Belkebir K, Giovaninni H, Sentenac A.Tomographic Diffractive Microscopy: Basics, Techniques and Perspectives. J Mod Opt (2010) 57(9):686–99. doi:10.1080/09500340.2010.493622
3. Cotte Y, Toy F, Jourdain P, Pavillon N, Boss D, Magistretti P, et al. Marker-free Phase Nanoscopy. Nat Photon (2013) 7(2):113–7. doi:10.1038/nphoton.2012.329
4. Kim Y, Shim H, Kim K, Park H, Heo JH, Yoon J, et al. Common-path Diffraction Optical Tomography for Investigation of Three-Dimensional Structures and Dynamics of Biological Cells. Opt Express (2014) 22(9):10398–407. doi:10.1364/oe.22.010398
5. Mico V, Zalevsky Z, García-Martínez P, García J. Synthetic Aperture Superresolution with Multiple off-axis Holograms. J Opt Soc Am A (2006) 23:3162–70. doi:10.1364/josaa.23.003162
6. Zheng G, Horstmeyer R, Yang C. Wide-field, High-Resolution Fourier Ptychographic Microscopy. Nat Photon (2013) 7(9):739–45. doi:10.1038/nphoton.2013.187
7. Li J, Matlock A, Li Y, Chen Q, Zuo C, Tian L. High-speed In Vitro Intensity Diffraction Tomography. Adv Photon (2019) 1(6):066004. doi:10.1117/1.ap.1.6.066004
8. Baek Y, Park Y. Intensity-based Holographic Imaging via Space-Domain Kramers-Kronig Relations. Nat Photon (2021) 15(7):354–60. doi:10.1038/s41566-021-00760-8
9. Park C, Lee K, Baek Y, Park Y. Low-coherence Optical Diffraction Tomography Using a Ferroelectric Liquid crystal Spatial Light Modulator. Opt Express (2020) 28(26):39649. doi:10.1364/oe.405418
10. Streibl N. Three-dimensional Imaging by a Microscope. J Opt Soc Am A (1985) 2(2):121–7. doi:10.1364/josaa.2.000121
11. Jenkins MH, Gaylord TK. Three-dimensional Quantitative Phase Imaging via Tomographic Deconvolution Phase Microscopy. Appl Opt (2015) 54(31):9213. doi:10.1364/ao.54.009213
12. Chen M, Tian L, Waller L. 3D Differential Phase Contrast Microscopy. Biomed Opt Express (2016) 7(10):3940–50. doi:10.1364/BOE.7.003940
13. Soto JM, Rodrigo JA, Alieva T. Label-free Quantitative 3D Tomographic Imaging for Partially Coherent Light Microscopy. Opt Express (2017) 25(14):15699–712. doi:10.1364/oe.25.015699
14. Soto JM, Rodrigo JA, Alieva T. Optical Diffraction Tomography with Fully and Partially Coherent Illumination in High Numerical Aperture Label-free Microscopy [Invited]. Appl Opt (2018) 57(1):A205–A214. doi:10.1364/ao.57.00a205
15. Soto JM, Mas A, Rodrigo JA, Alieva T, Domínguez-Bernal G. Label-free Bioanalysis of Leishmania Infantum Using Refractive index Tomography with Partially Coherent Illumination. J Biophotonics (2019) 12:e201900030. doi:10.1002/jbio.201900030
16. Rodrigo JA, Soto JM, Alieva T. Fast Label-free Microscopy Technique for 3D Dynamic Quantitative Imaging of Living Cells. Biomed Opt Express (2017) 8:5507–17. doi:10.1364/boe.8.005507
17. Bao Y, Gaylord TK. Quantitative Phase Imaging Method Based on an Analytical Nonparaxial Partially Coherent Phase Optical Transfer Function. J Opt Soc Am A (2016) 33(11):2125–36. doi:10.1364/josaa.33.002125
18. Soto JM, Rodrigo JA, Alieva T. Partially Coherent Illumination Engineering for Enhanced Refractive index Tomography. Opt Lett (2018) 43(19):4699–702. doi:10.1364/ol.43.004699
19. Lauer V.New Approach to Optical Diffraction Tomography Yielding a Vector Equation of Diffraction Tomography and a Novel Tomographic Microscope. J Microsc (2002) 205(2):165–76. doi:10.1046/j.0022-2720.2001.00980.x
20. Rodrigo JA, Alieva T. Rapid Quantitative Phase Imaging for Partially Coherent Light Microscopy. Opt Express (2014) 22(11):13472–83. doi:10.1364/oe.22.013472
21. Royer LA, Weigert M, Günther U, Maghelli N, Jug F, Sbalzarini IF, et al. ClearVolume: Open-Source Live 3D Visualization for Light-Sheet Microscopy. Nat Methods (2015) 12:480–1. doi:10.1038/nmeth.3372
22. Cojoc D, Difato F, Ferrari E, Shahapure RB, Laishram J, Righi M, et al. Properties of the Force Exerted by Filopodia and Lamellipodia and the Involvement of Cytoskeletal Components. PLoS ONE (2007) 2(10):e1072. doi:10.1371/journal.pone.0001072
23. Innocenti M. New Insights into the Formation and the Function of Lamellipodia and Ruffles in Mesenchymal Cell migration. Cell Adhes Migration (2018). p. 1–16. doi:10.1080/19336918.2018.1448352 New Insights into the Formation and the Function of Lamellipodia and Ruffles in Mesenchymal Cell MigrationCel Adhes Migration.
24. Sandoz PA, Tremblay C, van der Goot FG, Frechin M. Image-based Analysis of Living Mammalian Cells Using Label-free 3D Refractive index Maps Reveals New Organelle Dynamics and Dry Mass Flux. PLOS Biol (2019) 17:e3000553. doi:10.1371/journal.pbio.3000553
25.PivLab (2021). Available at: https://www.mathworks.com/matlabcentral/fileexchange/27659-pivlab-particle-image-velocimetry-piv-tool. [Accessed 7 June 2021].
26. Santiago JG, Wereley ST, Meinhart CD, Beebe DJ, Adrian RJ. A Particle Image Velocimetry System for Microfluidics. Experiments in Fluids (1998) 25(4):316–9. doi:10.1007/s003480050235
27. Bard F, Bourgeois CA, Costagliola D, Bouteille M. Rotation of the Cell Nucleus in Living Cells: a Quantitative Analysis. Biol Cel (1985) 54(2):135–42. doi:10.1111/j.1768322x.1985.tb00388.x10.1111/j.1768-322x.1985.tb00388.xM
28. Maninová M, Iwanicki MP, Vomastek T. Emerging Role for Nuclear Rotation and Orientation in Cell Migration. Cel Adhes Migration (2014) 8:42–8. doi:10.4161/cam.27761
29. Barer R.Determination of Dry Mass, Thickness, Solid and Water Concentration in Living Cells. Nature (1953) 172(4389):1097–8. doi:10.1038/1721097a0
30. Mahlmann DM, Jahnke J, Loosen P. Rapid Determination of the Dry Weight of Single, Living Cyanobacterial Cells Using the Mach-Zehnder Double-Beam Interference Microscope. Eur J Phycology (2008) 43(4):355–64. doi:10.1080/09670260802168625
31. Popescu G, Park Y, Lue N, Best-Popescu C, Deflores L, Dasari RR, et al. Optical Imaging of Cell Mass and Growth Dynamics. Am J Physiology-Cell Physiol (2008) 295(2):C538–C544. doi:10.1152/ajpcell.00121.2008
32. Yakimovich A, Witte R, Andriasyan V, Georgi F, Greber UF. Label-free Digital Holo-Tomographic Microscopy Reveals Virus-Induced Cytopathic Effects in Live Cells. mSphere (2018) 3(6):e00599–18. doi:10.1128/mSphereDirect.00599-18
33. Buendia B, Courvalin JC, Collas P. Dynamics of the Nuclear Envelope at Mitosis and during Apoptosis. Cell Mol Life Sci (2001) 58(12-13):1781–9. doi:10.1007/PL00000818
34. D’Arcy MS. Cell Death: a Review of the Major Forms of Apoptosis, Necrosis and Autophagy. Cell Biol Int (2019) 43(6):582–92. doi:10.1002/cbin.11137
35.Tomocube website (2021). Available at: http://www.tomocube.com/ (Accessed June 7, 2021).
36.Nanolive website (2021). Available at: http://nanolive.ch/ (Accessed June 7, 2021).
Keywords: optical diffraction tomography, wide-field transmission microscopy, quantitative imaging, cell imaging, refractive index
Citation: Soto JM, Rodrigo JA and Alieva T (2021) Partially Coherent Optical Diffraction Tomography Toward Practical Cell Study. Front. Phys. 9:666256. doi: 10.3389/fphy.2021.666256
Received: 09 February 2021; Accepted: 21 May 2021;
Published: 17 June 2021.
Edited by:
Vicente Mico, University of Valencia, SpainReviewed by:
Kyoohyun Kim, Max Planck Institute for the Science of Light, GermanyCopyright © 2021 Soto, Rodrigo and Alieva. This is an open-access article distributed under the terms of the Creative Commons Attribution License (CC BY). The use, distribution or reproduction in other forums is permitted, provided the original author(s) and the copyright owner(s) are credited and that the original publication in this journal is cited, in accordance with accepted academic practice. No use, distribution or reproduction is permitted which does not comply with these terms.
*Correspondence: Juan M. Soto, anVhbnNvdG9AdWNtLmVz
Disclaimer: All claims expressed in this article are solely those of the authors and do not necessarily represent those of their affiliated organizations, or those of the publisher, the editors and the reviewers. Any product that may be evaluated in this article or claim that may be made by its manufacturer is not guaranteed or endorsed by the publisher.
Research integrity at Frontiers
Learn more about the work of our research integrity team to safeguard the quality of each article we publish.